Abstract
The estrogen receptor (ER) functions as a dimer and is involved in several different biological functions. However ER dimeric proteins have not been identified by in situ methodologies. Structured illumination microscopy (SIM) has been recently developed, which enabled the localization of protein and protein interaction. Therefore, in this study, we firstly demonstrated that ERs formed both homodimers and heterodimers in breast carcinoma cell lines using Nikon’s SIM (N-SIM). ERα/α homodimers were detected in the nuclei of both ERα-positive MCF-7 and T-47D cells; 23.0% and 13.4% of ERα proteins formed ERα/α homodimers, respectively. ERα/β heterodimers were also detected in MCF-7 and T-47D. Approximately 6.6% of both ERα and ERβ1 proteins formed ERα/β1 heterodimers in MCF-7. In addition, 18.1% and 22.4% of ERα and ERβ proteins formed ERα/β2 heterodimers and ERα/β5 heterodimers in MCF-7, respectively. In addition, by using proximity ligation assay (PLA) in MCF-7, estradiol-induced ERα/α homodimers and ERα/β1 heterodimers were both detected after 15 to 45 min of treatment and at 15 min, respectively. The percentage of total ER proteins could also be determined using N-SIM. By using both methods, it has become possible to evaluate precise localization and ratio of ER dimers among different cell types.
I. Introduction
Estrogen plays a physiologically important role in various organs [2, 26]. It is also well-known that estrogen exerts cell proliferative effects on breast carcinomas, and the effects of estrogen are principally mediated by specific receptor, estrogen receptor (ER) [21, 22]. ER has two isoforms, ERα and ERβ, which form either homo (α/α, β/β) or heterodimers (α/β), each harboring different biological functions [4]. In breast carcinoma cells, it is well known that an ERβ signal disrupts estrogen-induced cell proliferation via an ERα signaling pathway [14]. This ER dimerization pattern has also been known to exert different functions on intracellular estrogen signaling pathways. The ERα/α homodimer was reported to stimulate estrogen-induced cell proliferation, whereas the ERβ/β homodimer exerts inhibitory effects on estrogen-dependent cell proliferation in breast carcinoma cells [14]. In addition, ERα/β heterodimers was also known to inhibit cell proliferation because ERβ inhibits ERα-mediated cell proliferation through the co-expression of ERα and ERβ in estrogen responsive cells [14]. Five different splice variants of ERβ isoforms, designated ERβ1–5, has been so far reported [16]. ERβ1 and ERβ2 are also known as wild-type ERβ and ERβcx, respectively. High levels of ERβ1, ERβ2, and ERβ5 expression were reported in normal mammary gland and breast carcinoma cell lines [16]. In addition, nuclear ERβ2 and ERβ5, but not ERβ1, were reported to promote survival in breast cancer patients [13, 24]. However, Chantzi et al. reported that ERβ2 status was associated with adverse clinical outcome in ERα-negative breast cancer patients [3]. Ogawa et al. also reported that ERβ2 preferentially formed a heterodimer with ERα, rather than with ERβ1, thereby inhibiting DNA binding by ERα [17]. In addition, ERβ2, ERβ4, and ERβ5 do not necessarily form homodimers with themselves, but it readily form a heterodimer with ERβ1 [15]. Therefore, it has become pivotal to evaluate the status of ER dimers in breast cancer patients in order to obtain a better understanding of the potential effects of estrogen on carcinoma cell proliferation.
ER dimeric proteins have largely been identified by bioluminescence resonance energy transfer (BRET)/förster resonance energy transfer (FRET) analyses but application of in situ methodologies has not been reported, which has made it rather impossible to localize homo- or heterodimers in individual estrogen-responsive cells [1, 20, 27]. We have previously reported the detection of ERα homodimers and ERα/β heterodimers in breast cancer cells and tissues by using a proximity ligation assay (PLA) [10]. PLA was developed in order to visualize protein-protein interactions [25]. In addition, a specific immunohistochemical staining method using dual binders was reported as a tool for visualization of protein-protein interactions [28]. Recently, structured illumination microscopy (SIM) has been developed [7, 23]. Owing to the diffraction limit of light, the resolution of conventional fluorescence microscopy is rather limited to ~200 nm [29, 32]. In submicrometer-sized spines, virtually all the proteins could therefore appear as more or less co-localized, which prevented a detailed analysis of spatial relationships [29, 32]. The dimerization of some membrane receptors, such as epidermal growth factor receptor induced by its ligand, was evaluated by super-resolution microscopic analysis [31]. However, the study regarding the detection of nuclear receptor dimers using super-resolution microscopic N-SIM (Nikon’s structured illumination microscopy) analysis has not been reported to the best of our knowledge. Therefore, in this study, we firstly demonstrated the levels of the ERα/α homodimer and ERα/β isoform heterodimers formation in breast carcinoma cell lines using both N-SIM analysis and PLA. We also evaluated the effects of estradiol (E2) treatment on the status of ERα/α homodimer and ERα/β isoform heterodimers in breast carcinoma cell lines.
II. Materials and Methods
Cell lines and cell culture
The human breast carcinoma cell lines MCF-7, T-47D, and MDA-MB-231 were purchased from the American Type Cell Culture (ATCC; Manassas, VA). Cells were cultured in RPMI-1640 medium (Sigma-Aldrich, St Louis, MO) supplemented with 10% fetal bovine serum (FBS; Nichirei Biosciences, Tokyo, Japan) and 100 μg/mL penicillin/streptomycin (Invitrogen, CA, USA). Cells were incubated in a humidified (37°C, 5% CO2) incubator and passaged upon reaching 80% confluence.
Effects of estradiol on ERα expression in MCF-7 cells
MCF-7 cells were seeded at a density of 1.0 × 10⁵ cells per mL and were quantified after culturing for 48 hr in phenol-red-free RPMI-1640 (Sigma-Aldrich) supplemented with 10% dextran-coated charcoal-treated FBS for estrogen free experiments. Next, estradiol (E2; Wako Pure Chemical Industries, Osaka, Japan) dissolved in DMSO was added to this culture media.
Immunoblot analysis
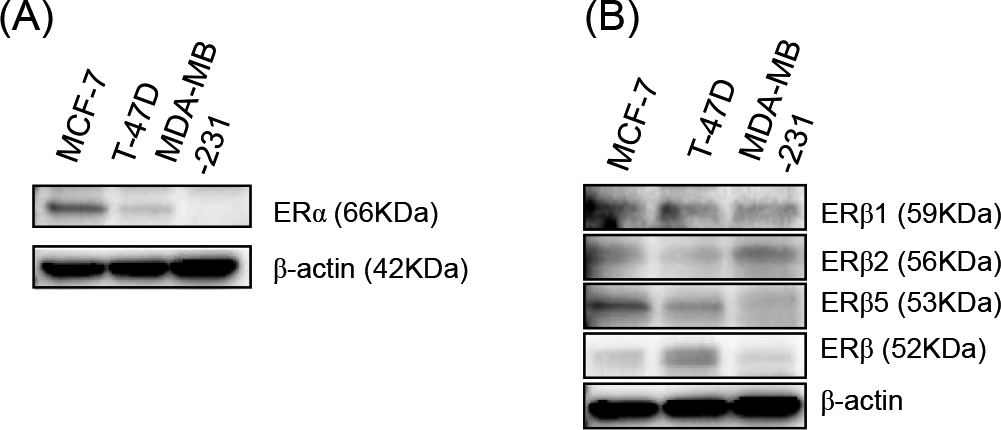
Cells were washed with phosphate buffered saline (PBS; Sigma-Aldrich) and proteins were extracted using Mammalian Protein Extraction Reagent (Pierce Biotechnology, Rockford, IL, USA) supplemented with Halt Protease Inhibitor Cocktail (Pierce Biotechnology). The total protein concentration was measured using the Protein Assay Rapid Kit (Wako Pure Chemical Industries). Proteins were separated by SDS-PAGE (10% acrylamide gel) and transferred to a Hybond-P PVDF membrane (GE Healthcare, Chalfont St Giles, UK). Membranes were then blocked with 4% skim milk (Wako) for 1 hr at room temperature, incubated with a primary antibody overnight at 4°C, washed with tris buffered saline, and incubated with a secondary antibody for 1 hr at room temperature. Antibody-protein complexes on the blots were detected using ECL Plus western blotting detection reagents (GE Healthcare), and the chemiluminescence signal was visualized using a ChemiDoc XRS+ System (BIO RAD, Tokyo, Japan). We examined the expression level of ERα, ERβ1, ERβ2, ERβ5, and ERβ proteins in MCF-7, T-47D, and MDA-MB-231 cells. By immunoblotting analysis, a higher level of ERα protein was detected in MCF-7 cells compared to that in T-47D cells (Fig. 1A). In MDA-MB-231 cells, ERα was not detected (Fig. 1A). The immunoreactivity of the ERβ antibody (68-4) that recognizes a common epitope of ERβ isotypes was higher in T-47D cells compared to that in MCF-7 and MDA-MB-231 cells (Fig. 1B). Low levels of ERβ1 and ERβ5 were detected in MDA-MB-231 cells. Otherwise, ERβ2 levels were high in MDA-MB-231 cells (Fig. 1B).
Cells were suspended in 500 μL of PBS and then centrifuged at 1500 rpm for 3 min. Pellets obtained were fixed for 3 min in 10% neutral-buffered formalin, centrifuged at 1500 rpm for 3 min and then washed in PBS. Fibrinogen dissolved in PBS was added to the cells and then rapidly mixed with thrombin. The clot was gently removed from the tube, transferred to a tissue cassette, and moved into ethanol and xylene, and finally embedded in paraffin.
Immunofluorescence
Paraffin sections (3-μm thick) were dewaxed with xylene and ethanol. Antigen retrieval was performed by heating the slides in an autoclave at 121°C for 5 min in citrate buffer, pH 6.0. Sections were washed with PBS and incubated for 30 min at room temperature with blocking solution. These sections were further incubated overnight in a moist chamber at 4°C with primary antibodies. The characteristics of the primary antibodies employed in this study were summarized in Table 1. The sections were subsequently incubated with fluorescence-labeled secondary antibodies (Alexa Fluor 488 anti-rabbit and Alexa Fluor 594 anti-mouse; Invitrogen) for 1 hr at room temperature. The reacted slides were then mounted with mounting medium with DAPI. The dimeric proteins were detected by super-resolution imaging using structured illumination microscopy (Nikon, Tokyo, Japan). The areas of the yellow, green, and red signals were analyzed by Lumina Vision (Mitani Corp, Japan). We then determined the “% of ER dimer (i.e., ERα/α and ERα/β)” according to the following equation: (Yellow area/Yellow + Green + Red areas) × 100 (%).
Table 1.
Antibodies employed in this study
| Antigen |
Clone |
Species |
Description |
Reference |
Application |
| ERα |
6F11 |
Mouse |
Monoclonal |
Leica (HE, GER) |
IF, PLA |
|
SP-1 |
Rabbit |
Monoclonal |
Abcam (MA, USA) |
IF, PLA |
|
polyclonal |
Rabbit |
Polyclonal |
Santa Cruz |
WB |
| ERβ |
68-4 |
Rabbit |
Monoclonal |
Merck Millipore |
WB |
| ERβ1 |
PPG5/10 |
Mouse |
Monoclonal |
AbDSerotec (OXF, UK) |
IF, PLA |
|
7DN |
Rabbit |
Polyclonal |
Invitrogen (CA, USA) |
WB |
| ERβ2 |
57/3 |
Mouse |
Monoclonal |
AbDSerotec |
IF, PLA, WB |
| ERβ5 |
5/25 |
Mouse |
Monoclonal |
AbDSerotec |
IF, PLA, WB |
PLA, ploximityligation assay; IF, immunofluorescence; WB, western blotting.
In this study, we employed in situ PLA to detect ER dimerization according to our previous study [10].
We used the Duolink in situ PLA kit from Olink Bioscience (Olink Bioscience, Uppsala, Sweden). The cells grown on cover slides were fixed in 4% paraformaldehyde and permeabilized using 0.1% Triton-X-100. Cells were then incubated with blocking solution and incubated overnight with primary antibodies at 4°C. The characteristics of the primary antibodies used in this study were summarized in Table 1. The cells were subsequently incubated with PLA PLUS and MINUS probes for mouse and rabbit and incubated with ligation-ligase solution, and subsequently with amplification-polymerase solution according to the manufacturer’s instructions. The slides were mounted with mounting medium with DAPI. The number of ER dimers in breast carcinoma cell lines was quantified as the area of the dots in the nuclei using image analysis (Lumina Vision, Mitani Corp, Japan).
III. Results
Imaging of ERα/α homodimers in breast carcinoma cells using N-SIM
ERα/α homodimer was identified as double-stained ERα proteins using two different anti-ERα antibodies, such as 6F11 (red) and SP-1 (green), and analyzed by using super-resolution microscopy (i.e., N-SIM). Both green and red fluorescent signals were detected in the nuclei of MCF-7 and T-47D cells (Fig. 2A, B). The ERα/α homodimer was detected as yellow signal spots, resulting from overlapping green and red fluorescent signals (Fig. 2A, B). Results of our study revealed that 23.0% and 13.4% of ERα/α homodimers were detected in MCF-7 and T-47D cells, respectively (Fig. 2C). ERα/α homodimers were also detected in both MCF-7 and T-47D cells using the PLA method as well as N-SIM (Fig. 2D). The PLA score in MCF-7 cells tended to be higher than that in T-47D cells (Fig. 2F). The ratio of ERα/α homodimers in MCF-7 and T-47D cells were significantly higher than that in MDA-MB-231 cells using both N-SIM (p = 0.0003, p = 0.0120) and PLA (p = 0.0012, p = 0.0236) (Fig. 2C, F). In ERα-negative MDA-MB-231 cells, the ER signal could not be detected by either analysis (Fig. 2B–E).

Using N-SIM, ERα/β isotype heterodimers were detected in ERα-positive MCF-7 and T-47D cells (Fig. 3A). The percentages of each dimer determined by N-SIM analysis were as follows (Fig. 3B). MCF-7: ERα/β1, 6.6%; ERα/β2, 18.1%; ERα/β5, 22.4%. T-47D: ERα/β1, 5.1%; ERα/β2, 10.1%; ERα/β5, 10.1%. The ratio of ERα/β1 heterodimers in MCF-7 cells were significantly higher than that in MDA-MB-231 cells (p = 0.0206) and that of ERα/β2 heterodimers in MCF-7 and T-47D cells were significantly higher than that in MDA-MB-231 cells (p < 0.0001, p = 0.0004). In addition, the ratio of ERα/β2 heterodimers in MCF-7 cells was significantly higher than that in T-47D cells (p = 0.0020). The ratio of ERα/β5 heterodimers in MCF-7 and T-47D cells was also significantly higher compared to that in MDA-MB-231 (p < 0.0001, p = 0.0109). In addition, the ratio of ERα/β5 heterodimers in MCF-7 cells was significantly higher than that in T-47D cells (p = 0.0034).
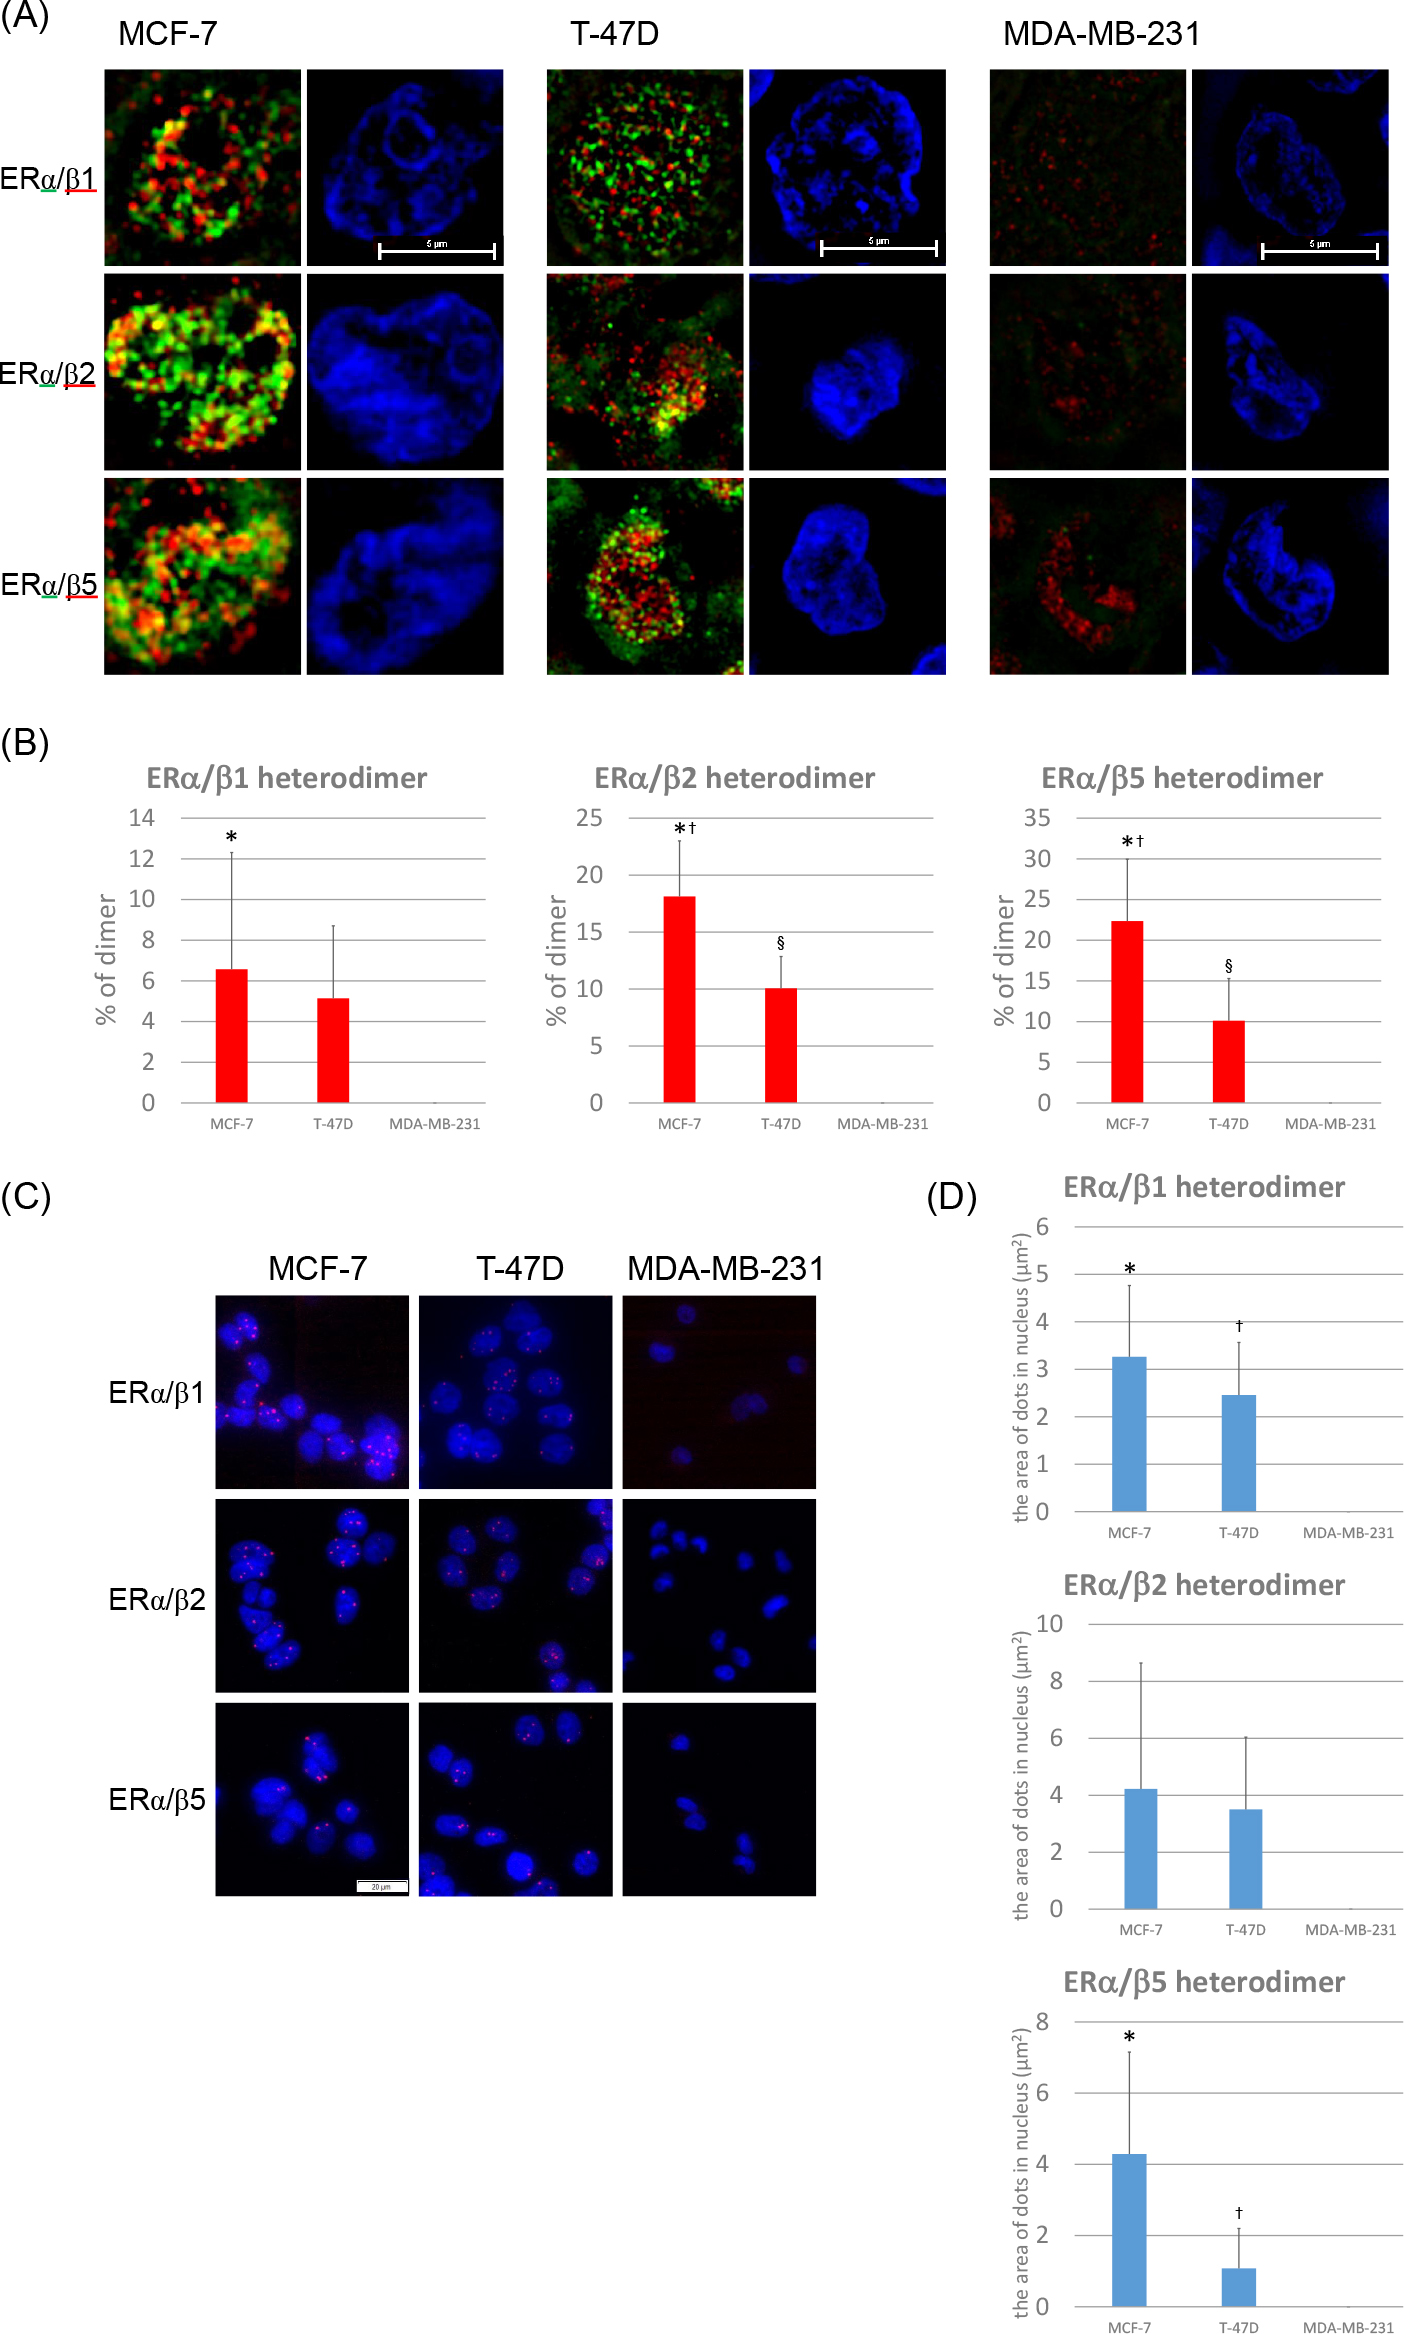
ERα//β heterodimers were detected in both MCF-7 and T-47D cells using the PLA method as well as N-SIM (Fig. 3C, D). The area of each dimer determined by PLA were as follows (Fig. 3D). MCF-7: ERα/β1, 3.3 μm2; ERα/β2, 4.2 μm2; ERα/β5, 4.3 μm2. T-47D: ERα/β1, 2.5 μm2; ERα/β2, 3.5 μm2; ERα/β5, 1.1 μm2. ERα/β1 heterodimers in MCF-7 and T-47D cells were significantly higher than that in MDA-MB-231 cells (p = 0.0011, p = 0.0039). The number of ERα/β2 heterodimers in MCF-7 and T-47D cells was higher than that in MDA-MB-231 cells. However, these differences did not reach statistical significance. The number of ERα/β5 heterodimers in MCF-7 and T-47D cells was significantly higher than that in MDA-MB-231 cells (p = 0.0051, p = 0.0337). In ERα-negative MDA-MB-231 cells, ERα/β heterodimers were not detected (Fig. 3A–D).
Formation of estradiol-induced ERα/α homodimers in MCF-7 cells evaluated by N-SIM
E2-induced ERα/α homodimers were detected in MCF-7 cells (Fig. 4A, B). We added 10 nM of E2 to breast carcinoma cells and evaluated how this influenced the expression of ERα/α homodimers after 15, 45, and 90 min of incubation by employing N-SIM (Fig. 4A, B). Intranuclear ERα/α homodimers were detected in control and E2-treated MCF7 cells. The ratio of ERα/α homodimers in MCF-7 cells increased after 15 and 45 min of E2 treatment (Fig. 4A, B). In addition, the ratio of ERα/α homodimers after 15 min of E2 treatment was significantly higher than that obtained in the control (p = 0.0121). Similar results were also obtained by PLA analysis (Fig. 4D, E). The PLA signal increased after 15 and 45 min of E2 treatment (p = 0.0252) (Fig. 4D, E). Results of immunoblotting analysis revealed that the ERα protein level decreased after 15, 45, and 90 min of E2 treatment (Fig. 4C).
Visualization of the effects of E2 treatment upon ERα/β heterodimer formation in MCF-7 cells using PLA
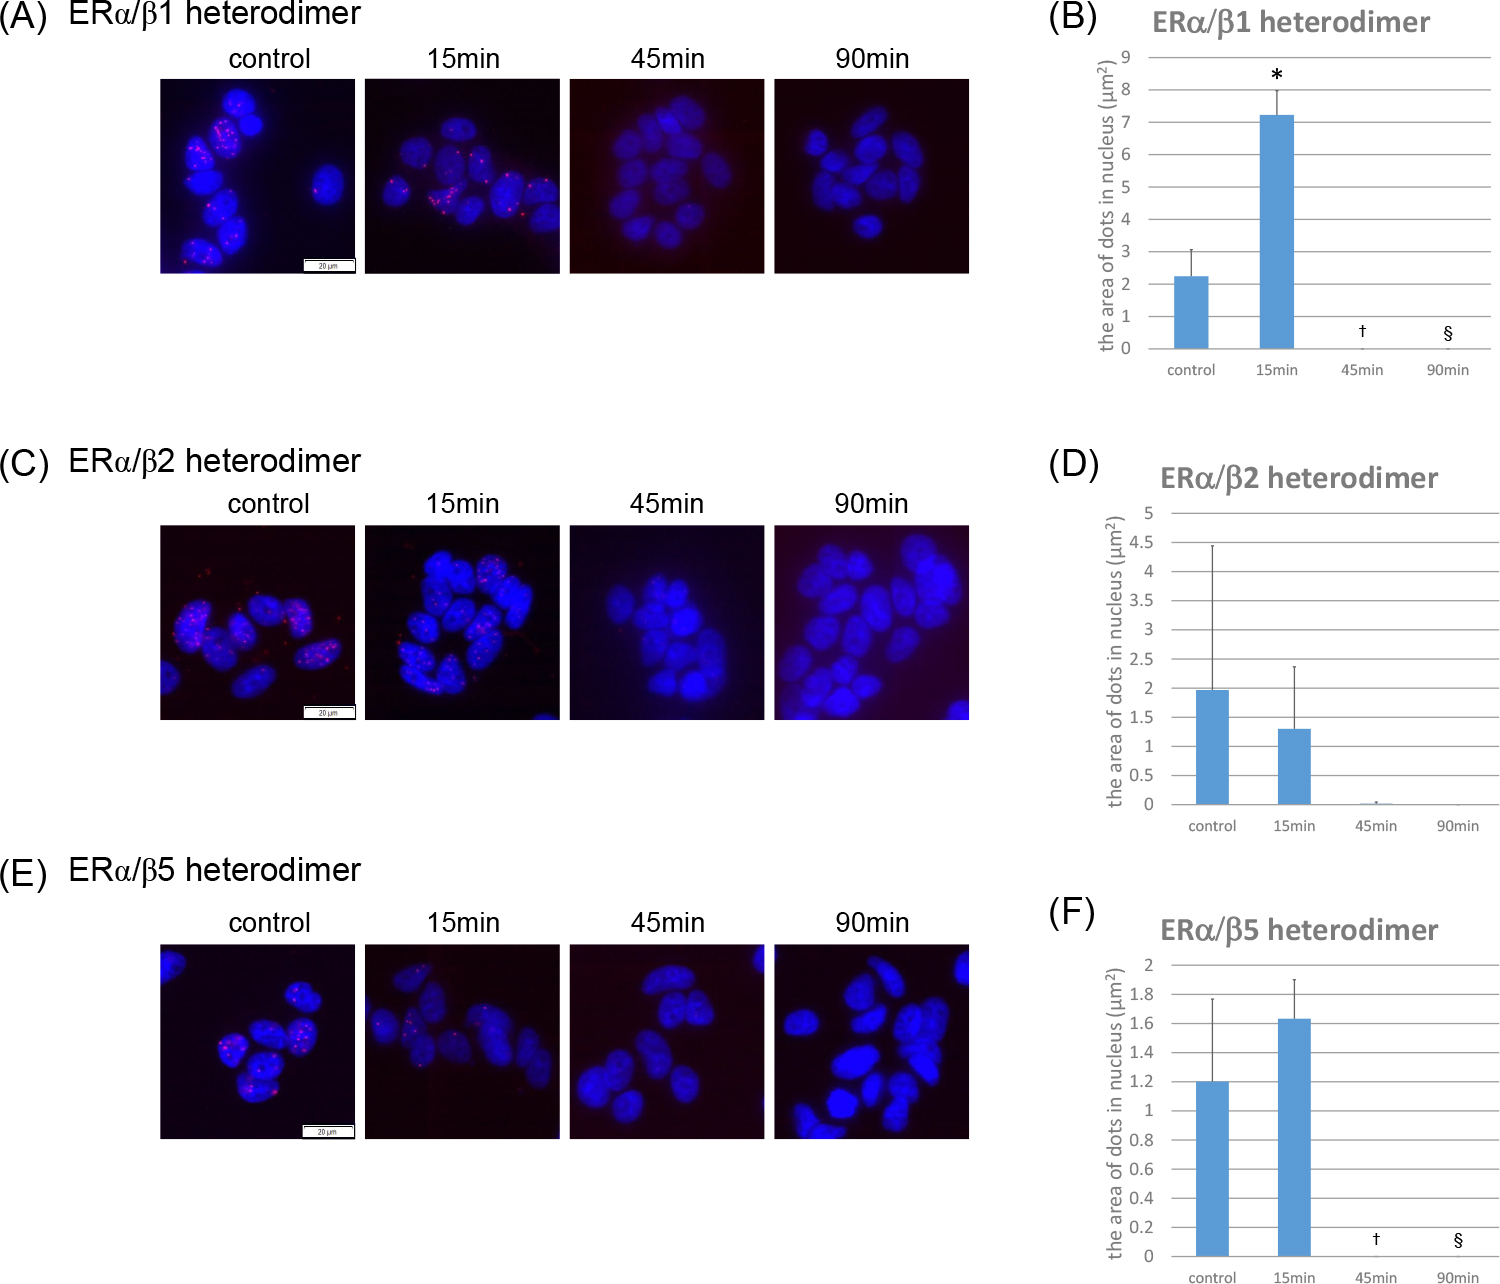
We also evaluated the formation of ERα/β heterodimers using PLA. We added 10 nM of E2 to breast carcinoma cells and used PLA to examine the status of ERα/β isotype heterodimers after 15, 45, and 90 min of treatment (Fig. 5).
The number of E2-induced ERα/β1 heterodimers increased after 15 min of E2 treatment (Fig. 5A, B). There were no changes in the number of either ERα/β2 or ERα/β5 heterodimers in MCF-7 cells treated with E2 (Fig. 5C–F). None of the ERα/β subtype heterodimers could be detected after 45 or 90 min of treatment (Fig. 5A–F). The number of ERα/β1 heterodimers after 15 min of E2 treatment was significantly higher than that in the control (p < 0.0001). In addition, the number of ERα/β1 and ERα/β5 heterodimers was significantly less after 45 and 90 min of treatment compared to that in the control (ERα/β1; 45 min, p = 0.0030; 90 min, p = 0.0030) (ERα/β5; 45 min, p = 0.0040; 90 min, p = 0.0040) (Fig. 5B, D, F).
IV. Discussion
This is the first study to detect ER dimeric proteins using N-SIM. Both ER homo- and heterodimers were detected in ERs double-positive MCF-7 and T-47D cells. In ERα−/ERβ+ MDA-MB-231 cells, only ERα/β heterodimers were detected and immunoblotting analysis also revealed that a higher level of ERα protein was detected in MCF-7 cells compared to that in T-47D cells. In both N-SIM analysis and PLA, the level of ERα/α homodimer in MCF-7 cells was higher than that in T-47D cells. In addition, no ERα/α homodimer signal was detected by either N-SIM analysis or PLA in ERα-negative MDA-MB-231 cells. In addition, the E2-treatment assay in MCF-7 cells demonstrated that the peak PLA signal for the ERα/α homodimer occurred after 45 min of treatment, as shown in both our previous report and this study [10]. The ERα/α homodimer patterns obtained by N-SIM analysis was similar to that in E2-treated MCF-7 cells by PLA. Results of our present study also indicate that the detection sensitivity of the ER dimer by PLA was equal to that detected by FRET [10]. Therefore, these findings did indicate that N-SIM could be a useful analytical tool, comparable to PLA, in detecting ERα/α homodimer in breast carcinoma cells.
Results of immunoblotting analysis revealed that the expression levels of ERβ1 and ERβ2 in MCF-7 cells were very similar to those in T-47D cells but the ERα protein levels in MCF-7 cells were markedly higher than those in T-47D cells. However in dimeric signaling analysis using both N-SIM and PLA, there were no differences in ERα/ERβ1 and ERα/ERβ2 heterodimer formation between MCF-7 and T-47D cells. Therefore, the formation of ERα/ERβ1 or ERα/ERβ2 heterodimers could be determined more by the expression levels of ERβ1 or ERβ2 than that of ERα. The ERα/β1 heterodimer signal revealed by PLA increased after 15 min of E2 treatment in MCF-7 cells. However, E2 treatment had no effects upon the levels of ERα/β2 or ERα/β5 heterodimers. A possible reason for this discrepancy might be that ERβ2 formed heterodimers with ERα or ERβ1 without ligand binding [17, 18]. Ligand-independent dimer formation of ERβ5 has not been reported but ERβ5 was reported to bind to E2 with moderate affinity compared to that of ERβ1 [15]. In our present study, PLA signals from ERα/ERβ isoform heterodimers disappeared after 45 or 90 min of E2 treatment. One possible reason for this is that E2 treatment decreased the protein levels of ERα. However, in both N-SIM analysis and PLA, the formation of the ERα/ERα homodimers remained at a level equal to or more than that of the intact MCF-7 level because ERβ1 is well known to bind to E2 with lower affinity than ERα [11]. Therefore, these findings did suggest that the ERα/α homodimer could be more predominantly induced by E2 compared to that of the ERα/β heterodimer in breast carcinoma cell lines.
As for ERα/β heterodimer, all ERβ isoforms inhibited the transcriptional activities of ERα for an estrogen response element-containing promoter but it is also true that the various ERβ isoforms had different degrees of these effects [19]. Nuclear ERβ2 and ERβ5, but not ERβ1, were reported to be significantly correlated with good overall survival in breast cancer patients [13, 24]. However, in both ERα-negative and HER2-positive breast cancer, ERβ2 status was indeed associated with adverse clinical outcome of the patients [30]. In addition, ERβ2 preferentially formed a heterodimer with ERα rather than with ERβ1 in ER-transfected COS-7 cells [17]. These findings all indicated that the effects of ER on breast cancer could be different depending on the dimer patterns of ERα and ERβ. However, further examination, such as an analysis of the dimer patterns of ERα and ERβ (including its variant forms) in breast cancer patients are required for clarification of the significance of ER dimmers in biological behavior of ER positive breast cancer patients.
In this study, we examined the dimeric protein pattern of ER by both N-SIM and PLA in breast carcinoma cells. Both N-SIM analysis and PLA are generally considered powerful laboratory methods for the detection of nuclear receptor dimers such as ERα and ERβ in breast carcinoma cells. Results of our previously reported study revealed that PLA was suitable for a large-scale study using tissue samples as in immunochemical analysis [10]. However, N-SIM analysis has been reported to have high sensitivity, specificity, and resolution compared to light microscopy [8, 9]. Raloxifen were reported to translocate ERα into the nucleoli in breast cancer cell line [6]. Therefore, using N-SIM technique, it is possible to detect the patterns of intranuclear distribution of ER dimers stimulated by its agonists. In addition, N-SIM analysis could visualize protein-protein interactions of more than three proteins using multiple staining, whereas PLA could only visualize protein-protein interactions of two proteins. Therefore, in addition to detecting the ER dimers, we could distinctively identify the complex patterns of ER dimer with cofactor proteins using N-SIM. Furthermore, N-SIM analysis also could indeed evaluate fine structures and function in single living cell [5, 12, 31]. This could allow evaluation of dynamic changes in ERα and ERβ dimer formation using N-SIM analysis.
V. Disclosure/Duality of Interest
All authors declare that they have no competing interests.
VI. Acknowledgments
We thank Ms. Kazue Ise for her support and Chiaki Sugawara (from Nikon) for technical support. We also acknowledge the support of the Biomedical Research Core at Tohoku University Graduate School of Medicine. This work was supported by Grant-in-Aid for Exploratory Research 25670174.
VII. References
- 1 Bai, Y. and Giguére, V. (2003) Isoform-selective interactions between estrogen receptors and steroid receptor coactivators promoted by estradiol and ErbB-2 signaling in living cells. Mol. Endocrinol. 17; 589–599.
- 2 Batmunkh, B., Choijookhuu, N., Srisowanna, N., Byambatsogt, U., Synn, Oo. P., Noor, Ali, M., Yamaguchi, Y. and Hishikawa, Y. (2017) Estrogen accelerates cell proliferation through estrogen receptor α during rat liver regeneration after partial hepatectomy. Acta Histochem. Cytochem. 50; 39–48.
- 3 Chantzi, N. I., Tiniakos, D. G., Palaiologou, M., Goutas, N., Filippidis, T., Vassilaros, D. S., Dhimolea, E., Mitsiou, J. D. and Alexis, N. M. (2013) Estrogen receptor beta 2 is associated with poor prognosis in estrogen receptor alpha-negative breast carcinoma. J. Cancer Res. Clin. Oncol. 139; 1489–1498.
- 4 Cowley, S. M., Hoare, S., Mosselman, S. and Parker, M. G. (1997) Estrogen receptors alpha and beta form heterodimers on DNA. J. Biol. Chem. 272; 19858–19862.
- 5 Daito, J., Harada, Y., Dai, P., Yamaoka, Y., Tamagawa-Mineoka, R., Katoh, N. and Takamatsu, T. (2014) Neutrophil phagocytosis of platelets in the early phase of 2,4,6-trinitro-1-chlorobenzene (TNCB)-induced dermatitis in mice. Acta Histochem. Cytochem. 47; 67–74.
- 6 Gushima, M., Kawate, H., Ohnaka, K., Nomura, M. and Takayanagi, R. (2010) Raloxifene induces nucleolar translocation of the estrogen receptor. Mol. Cell. Endocrinol. 319; 14–22.
- 7 Gustafsson, M. G. L., Shao, L., Carlton, P. M., Wang, J. R. C., Golubovskaya, N. I., Cande, Z. W., Agard, A. D. and Sedat, W. J. (2008) Three-dimensional resolution doubling in wide-field fluorescence microscopy by structured illumination. Biophys. J. 94; 4957–4970.
- 8 Heintzmann, R. and Ficz, G. (2013) Breaking the resolution limit in light microscopy. Methods Cell Biol. 114; 525–544.
- 9 Hirai, Y., Hirano, Y., Matsuda, A., Hiraoka, Y., Honda, T. and Tomonaga, K. (2016) Borna disease virus assembles porous cage-like viral factories in the nucleus. J. Biol. Chem. 291; 25789–25798.
- 10 Iwabuchi, E., Miki, Y., Ono, K., Onodera, Y., Suzuki, T., Hirakawa, H., Ishida, T., Ohuchi, N. and Sasano, H. (2017) In situ detection of estrogen receptor dimers in breast carcinoma cells in archival materials using proximity ligation assay (PLA). J. Steroid Biochem. Mol. Biol. 165; 159–169.
- 11 Kuiper, G., Enmark, E., Peltohuikko, M., Nilsson, S. and Gustafsson, J. A. (1996) Cloning of a novel estrogen receptor expressed in rat prostate and ovary. Proc. Natl. Acad. Sci. U S A 93; 5925–5930.
- 12 Kusumi, A., Tsunoyama, T. A., Hirosawa, K. M., Kasai, R. S. and Fujiwara, T. K. (2014) Tracking single molecules at work in living cells. Nat. Chem. Biol. 10; 524–532.
- 13 Leung, Y. K., Lee, M. T., Lam, H. M., Tarapore, P. and Ho, S. M. (2012) Estrogen receptor-beta and breast cancer: Translating biology into clinical practice. Steroids 77; 727–737.
- 14 Madak-Erdogan, Z., Charn, T.-H., Jiang, Y., Liu, E. T., Katzenellenbogen, J. A. and Katzenellenbogen, B. S. (2013) Integrative genomics of gene and metabolic regulation by estrogen receptors α and β, and their coregulators. Mol. Syst. Biol. 9; 676.
- 15 Leung, Y. K., Mak, P., Hassan, S. and Ho, S. M. (2006) Estrogen receptor (ER)-beta isoforms: a key to understanding ER-beta signaling. Proc. Natl. Acad. Sci. U S A 103; 13162–13167.
- 16 Moore, J. T., McKee, D. D., Slentz-Kesler, K., Moore, L. B., Jones, S. A., Horne, E. L., Su, L. J., Kliewer, S. A., Lehmann, J. M. and Willson, T. M. (1998) Cloning and characterization of human estrogen receptor beta isoforms. Biochem. Biophys. Res. Commun. 247; 75–78.
- 17 Ogawa, S., Inoue, S., Watanabe, T., Orimo, A., Hosoi, T., Ouchi, Y. and Muramatsu, M. (1998) Molecular cloning and characterization of human estrogen receptor betacx: a potential inhibitor ofestrogen action in human. Nucleic Acids Res. 26; 3505–3512.
- 18 Omoto, Y., Eguchi, H., Yamamoto-Yamaguchi, Y. and Hayashi, S. (2003) Estrogen receptor (ER) beta1 and ERbetacx/beta2 inhibit ERalpha function differently in breast cancer cell line MCF7. Oncogene 22; 5011–5020.
- 19 Peng, B., Lu, B., Leygue, E. and Murphy, L. C. (2003) Putative functional characteristics of human estrogen receptor-beta isoforms. J. Mol. Endocrinol. 30; 13–29.
- 20 Powell, E. and Xu, W. (2008) Intermolecular interactions identify ligand-selective activity of estrogen receptor alpha/beta dimers. Proc. Natl. Acad. Sci. U S A 105; 19012–19017.
- 21 Sasano, H., Suzuki, T., Miki, Y. and Moriya, T. (2008) Intracrinology of estrogens and androgens in breast carcinoma. J. Steroid Biochem. Mol. Biol. 108; 181–185.
- 22 Sasano, H., Miki, Y., Nagasaki, S. and Suzuki, T. (2009) In situ estrogen production and its regulation in human breast carcinoma: From endocrinology to intracrinology. Pathol. Int. 59; 777–789.
- 23 Schermelleh, L., Carlton, P. M., Haase, S., Shao, L., Winoto, L., Kner, P., Burke, B., Cardoso, C. M., Agard, A. D., Gustafsson, G. L. M., Leonhardt, H. and Sedat, W. J. (2008) Subdiffraction multicolor imaging of the nuclear periphery with 3D structured illumination microscopy. Science 320; 1332–1336.
- 24 Shaaban, A. M., Green, A. R., Karthik, S., Alizadeh, Y., Hughes, A. T., Harkins, L., Ellis, O. I., Robertson, F. J., Paish, C. E., Saunders, T. K. P., Groome, P. N. and Speirs, V. (2008) Nuclear and cytoplasmic expression of ERβ1, ERβ2, and ERβ5 identifies distinct prognostic outcome for breast cancer patients. Clin. Cancer Res. 14; 5228–5235.
- 25 Söderberg, O., Gullberg, M., Jarvius, M., Ridderstråle, K., Leuchowius, K. J., Jarvius, J., Wester, K., Hydbring, P., Bahram, F., Larsson, L. G. and Landegren, U. (2006) Direct observation of individual endogenous protein complexes in situ by proximity ligation. Nat. Methods 3; 995–1000.
- 26 Takekoshi, S., Yasui, Y., Inomoto, C., Kitatani, K., Nakamura, N. and Osamura, R. Y. (2014) A histopathological study of multi-hormone producing proliferative lesions in estrogen-induced rat pituitary prolactinoma. Acta Histochem. Cytochem. 47; 155–164.
- 27 Tamrazi, A., Carlson, K. E., Daniels, J. R., Hurth, K. M. and Katzenellenbogen, J. A. (2002) Estrogen receptor dimerization: ligand binding regulates dimer affinity and dimer dissociation rate. Mol. Endocrinol. 16; 2706–2719.
- 28 Van Dieck, J., Schmid, V., Heindl, D., Dziadek, S., Schraeml, M., Gerg, M., Massoner, P., Engel, M. A., Tiefenthaler, G., Vural, S., Stritt, S., Tetzlaff, F., Soukupova, M., Kopetzki, E., Bossenmaier, B., Thomas, M., Klein, C., Mertens, A., Heller, A. and Tacke, M. (2014) Development of bispecific molecules for the in situ detection of protein-protein interactions and protein phosphorylation. Chem. Biol. 21; 357–368.
- 29 Westin, L., Reuss, M., Lindskog, M., Aperia, A. and Brismar, H. (2014) Nanoscopic spine localization of Norbin, an mGluR5 accessory protein. BMC Neurosci. 15; 45.
- 30 Wimberly, H., Han, G., Pinnaduwage, D., Murphy, C. L., Yang, R. X., Andrulis, L. I., Sherman, M., Figueroa, J. and Rimm, L. D. (2014) ERβ splice variant expression in four large cohorts of human breast cancer patient tumors. Breast Cancer Res. Treat. 146; 657–667.
- 31 Winckler, P., Lartigue, L., Giannone, G., De Giorgi, F., Ichas, F., Sibarita, J. B., Lounis, B. and Cognet, L. (2013) Identification and super-resolution imaging of ligand-activated receptor dimers in live cells. Sci. Rep. 3; 2387.
- 32 Xie, S., Naslavsky, N. and Caplan, S. (2014) Diacylglycerol kinase α regulates tubular recycling endosome biogenesis and major histocompatibility complex class I recycling. J. Biol. Chem. 289; 31914–31926.