| M. Kouchi corresponding author. e-mail: m-kouchi@aist.go.jp phone: +81-3-3599-8194; fax: +81-3-5530-2066 Published online 16 April 2004 in J-STAGE (www.jstage.jst.go.jp) DOI: 10.1537/ase.00071 |
Brachycephalization has continued since the medieval period in Japan (Suzuki, 1969; Nakahashi, 1987). Head shape change in the last 100 years revealed by somatometric data was mainly due to an increase in head breadth, and the rate of this change was extremely high (Kouchi, 2000).
The size and shape as an adult is the result of a continuous interaction between genetic and environmental influences during growth (Eveleth and Tanner, 1990). Factors that have been thought to be responsible for variation in head form include climate (Beals, 1972; Crognier, 1981; Kobyliansky, 1983), heterosis (Billy, 1975, 1979), migration (Kobyliansky, 1983), socioeconomic status or social classes (Pálsson and Schwidetzky, 1973; Mikic, 1990), allometry related to increases in height (Susanne et al., 1988), posture (Mizoguchi, 1992) and nutrition or diet (Lasker, 1946; Shimada, 1974). Many of these factors are also related to variation in height (Bogin, 1988; Eveleth and Tanner, 1990). Changes in head shape that accompanied increases in height, in recent years, took the form of brachycephalization in Japan and Korea, while debrachycephalization was seen in European populations (Kouchi, 2000). Although the direction is opposite, head breadth is the key characteristic in both brachycephalization and debrachycephalization. Explanations concerning the cause of change of head shape must account for both systematic increase and decrease of head breadth associated with an increase in height.
Environmental factors such as an improvement of nutritional conditions are considered to be the main cause of secular change in height (Wieringen, 1986). The latter is considered to be the result of secular change in growth rate, mainly in early childhood (Bock and Sykes, 1989; Eveleth and Tanner, 1990; Alberman et al., 1991). By the same token, brachycephalization is the result of secular change in growth rate in head breadth and head length, the two components of the cephalic index. The fact that very rapid secular changes in height and head breadth occurred simultaneously suggests that common environmental factors with direct effects on growth are influencing both height and head breadth (Kouchi, 2000).
The neurocranium and the viscerocranium are joined to form the cranium, and face measurements such as bizygomatic breadth significantly and consistently correlate with head breadth (Mizoguchi, 1992). Very rapid brachycephalization indicates that the function of the neurocranium does not constrain its shape. On the other hand, we assume that the shape of the viscerocranium is more strictly related to function. Secular changes in face measurements during the last 100 years are not well known. This is because there are problems such as large inter-observer measurement error and few existing somatometric data. Results obtained from somatometric data may be different from those obtained from craniometric data because the former are influenced by the nutritional conditions at the time of measurement. To obtain information on secular changes in crania from somatometric data, effects of confounding factors such as the nutritional condition, the age at measurement (aging), and inter-observer measurement errors must be separated from the effects of secular change.
The purpose of this study is to clarify secular change of the main cephalic measurements, after removing the effects of confounding factors by 1) comparing data measured by the same observer, and 2) examining the relationships between somatometric measurements and birth year, age at the time of measurement, and year of measurement, using data obtained from the literature. Another purpose of this study is to discuss the cause of brachycephalization based on the thus obtained analytical results.
Somatometric measurements are susceptible to inter-observer measurement errors, which can be very large (Kouchi, 1983). Therefore, in the present study, data obtained by a single observer was compared. The data used for comparison were obtained in three somatometric surveys of healthy Japanese. In each survey, two groups of subjects were examined: subjects between 18 and 29 years of age (young adult subjects); and subjects 60 years of age (older subjects). The difference between the mean ages of the two groups was about 50 years. The number of subjects and the basic statistics for birth year and age at the time of measurement are shown in Table 1.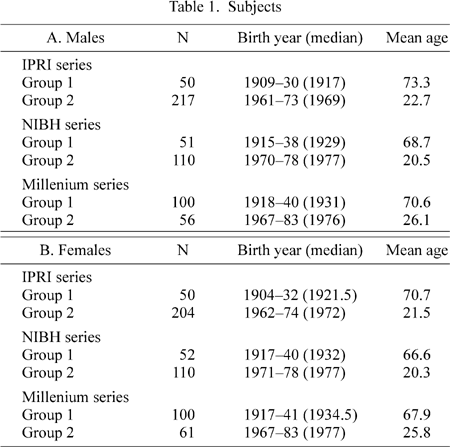
1) IPRI series: This survey was conducted in 1991 and 1992 by the Industrial Product Research Institute (National Institute of Bioscience and Human-Technology, 1996). The older subjects were healthy residents of Tsuchiura city and Tsukuba city, Ibaraki prefecture. The young adult subjects were residents of the Tsukuba city area; 72% of them were students. All measurements were taken by one observer.
2) NIBH series: This survey was conducted in 1997 and 1998 by the National Institute of Bioscience and Human-Technology and the National Institute of Technology and Evaluation (Kouchi and Mochimaru, 2000). The older subjects were residents of Ami town, Ibaraki prefecture. The young adult subjects were students of a fashion college in Tokyo. All measurements were taken by one observer.
3) Millennium series: This survey was conducted in 2001 and 2002 by the National Institute of Advanced Industrial Science and Technology. All subjects were residents of the Tokyo area. All measurements were taken by the observer who performed the measurements of the NIBH series.
Most measurements were taken in accordance with the methods of Martin and Knussmann (1988). In the Millennium series, sellion was used instead of nasion in measuring morphologic face height, and interpupillary distance was measured using a pupillometer (Hoya Corporation) instead of a sliding caliper. In the IPRI series, total head height, auricular height, occiput-to-subnasale distance, and occiput-to-tragion distance were measured using a head measurement apparatus (National Institute of Bioscience and Human-Technology, 1994; Kouchi et al., 1999) instead of a large sliding caliper. Differences in the means between the two age groups within the same series were analyzed by the t-test (Statview for Macintosh, SAS Institute Inc.).
The data used for this analysis was obtained from the literature, and from published and unpublished measurements taken by the present author from 5667 male and 2724 female subjects born in or after 1920 (Kouchi, 2000). The measurements used were head length (Martin #1), head breadth (Martin #3), bizygomatic breadth (Martin #7), and total head height (Martin #16). Subjects measured by the present author were divided into groups based on birth year, and the basic statistics were calculated for each group (Appendix). The literature from which the data were obtained was as follows: Onishi (1919, 1920), Matsumura (1925), Ikeda et al. (1953), Kakimoto (1953), Otsuki (1953), Kadosaka (1955), Lee (1958), Yanagisawa (1958), Suzuki (1963), Aeromedical Laboratory, Japan Air Self Defense Force (1972, 1980, 1990), Morita and Ohtsuki (1973), Yanagisawa and Kondo (1973), Ohtsuki and Iwamura (1980), Japanese Standards Association (1984), Miyanaga (1995), Research Institute of Human Engineering for Quality Life (1997), Takeuchi (2001), and Takeuchi et al. (2002). Bizygomatic breadth obtained by Otsuki (1953) was not used, because some of the data were clear outliers when plotted against birth year. Bizygomatic breadth from the Research Institute of Human Engineering for Quality Life (1997) and the Aeromedical Laboratory, Japan Air Self Defense Force (1972, 1980, 1990) were not used because the data were not comparable, due to differences in measurement techniques. When the year of measurement was not given in the literature, the year of publication was used. When the mean or median birth year of the subjects was not given in the literature, birth year was calculated from the year of measurement and the mean age of the subjects.
To examine trends by birth year, the mean values of each measurement were regressed on mean birth year, and the significance of the regression was tested using ANOVA (Statview for Macintosh). When linear regression appeared inadequate, quadratic regression was used.
Results of the t-test are shown in Table 2. Significant differences found in two or more series were as follows: 1) young adult subjects (group 2) had larger head breadth; 2) young adult subjects had smaller nose height. Neither bizygomatic breadth nor face height showed significant differences between age groups.
The significant difference in nose height is difficult to explain, because there was no significant difference in morphologic face height or subnasale-gnathion length. Three-dimensional forms were also measured in the Millennium series. Analysis of these 3D forms may help clarify this inconsistency.
Figure 1 shows the relationship between head breadth (HB) and birth year (BY). Data obtained from the same literature source are represented with the same symbol in Figure 1 and Figure 3 to Figure 5. HB increased rapidly during the last 100 years; the increase beginning at around 1890. Coefficients of the linear regression (of Figure 1) were highly significant (males, R2=0.88; females, R2=0.83). This pattern of secular change was very similar to that of mean height of 20-year-old Japanese shown in Figure 2.
 View Details | Figure 1. Relationship between head breadth and birth year. Data from the same source are indicated by the same symbol, except small open circles (which are from different sources). |
 View Details | Figure 2. Secular change in mean height of 20-year-old Japanese based on statistics from the Japanese government. |
Figure 3 shows the relationship between head length (HL) and BY. Data from some literature sources suggest a trend toward decreasing HL for people born between 1900 and 1940 (open diamonds and open triangles), whereas data from other literature sources suggest a trend toward increasing HL for people born after 1940 (solid triangles, open circles and crosses). Linear regression was not significant, but the coefficients of quadratic regression (of Figure 3) were significant at the 0.1% level (males, R2=0.29; females, R2=0.16). The range of variation in HL for BY between 1860 and 1980 is much smaller than that of HB.
 View Details | Figure 3. Relationship between head length and birth year. Data from the same source are indicated by the same symbol, except small open circles (which are from different sources). |
Figure 4 shows the relationship between bizygomatic breadth (BZB) and BY. Figure 4 suggests a trend toward increasing BZB in both males and females. Takeuchi (2001) showed that BZB of male medical students has been increasing for the last 50 years (stars in Figure 4), whereas data obtained by Onishi (solid squares in Figure 4) suggest a trend toward decreasing BZB in male subjects. For males, quadratic regression (curved line in Figure 4, R2=0.42) fits better than linear regression (R2=0.33), and the coefficients of quadratic regression were significant at the 5% level. For females, linear regression fits well (R2=0.52), and the coefficients of the regression line were significant at the 0.1% level.
 View Details | Figure 4. Relationship between bizygomatic breadth and birth year. Data from the same source are indicated by the same symbol, except small open circles (which are from different sources). |
Figure 5 shows the relationship between total head height and BY. Some data suggest an increase in total head height (solid triangles in Figure 5), but the correlation coefficient between total head height and BY was not significant for males or females. It appears that measurement errors were too large to obtain meaningful results.
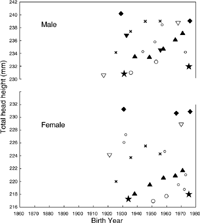 View Details | Figure 5. Relationship between total head height and birth year. Data from the same source are indicated by the same symbol, except small open circles (which are from different sources). |
Figure 6 shows the distribution of the year of measurement (YMes) for the HB data. Head breadth was used because it was the dimension with the greatest amount of data. The data used in this study were mainly collected in two periods: the 1950s, and after 1980. Because there were drastic changes in nutrition and food intake between these two periods, differences in nutritional status may have affected cephalic measurements and the relationship between BY and cephalic measurements. Therefore, data for HB, HL and BZB were divided into two groups: those obtained before 1970 (group 1), and those obtained in and after 1970 (group 2). Regression analysis was conducted for each group. In group 1, median YMes was 1950 for both sexes. In group 2, median YMes was 1988 for males and 1992 for females. This analysis was not performed for total head height, because little data was obtained before 1970.
 View Details | Figure 6. Distribution of the year of examination. |
Figure 7 shows the relationship between BY and HB. There was a significant increase in HB in both YMes groups. However, there was a systematic difference (upward shift) of about 2.5 mm between groups 1 and 2, for both sexes.
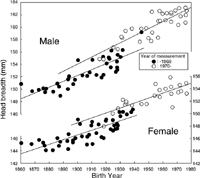 View Details | Figure 7. Relationship between head breadth and birth year for two groups based on the year of measurement. |
Figure 8 shows the relationship between BY and HL. There was a trend toward decreasing HL in group 1, for both sexes. For males in group 2, there was a trend toward increasing HL, but no change in HL was observed for females in group 2. Significant interaction between BY and YMes was indicated by the results of ANOVA, for both sexes. Close examination of Figure 8 reveals that the trend toward decreasing HL in group 1 was due to a small mean HL in subjects born between 1921 and 1939, measured between 1943 and 1957 at the age of 18 to 35 (arrows in Figure 8). Even among birth year cohorts within individual literature sources, such trends were observed.
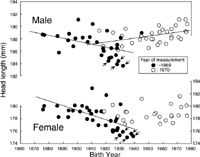 View Details | Figure 8. Relationship between head length and birth year for two groups based on the year of measurement. Arrows indicate samples born between 1921 and 1939, measured between 1943 and 1957 at the age of 18 to 35 years. |
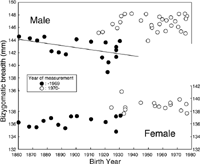
Figure 9 shows the relationship between BY and BZB. Group 2 had systematically larger BZB than group 1, for both sexes. Linear regression was only significant for group 1 males, who showed a significant negative correlation (r=−0.51, df=15).
 View Details | Figure 9. Relationship between bizygomatic breadth and birth year for two groups based on the year of measurement. |
For HL and BZB, the magnitude of systematic difference between the two YMes groups was calculated as the difference in means, using data from subjects younger than 30. The difference in HL was 2.7 mm for males and 2.1 mm for females. The difference in BZB was 4.8 mm for males and 3.3 mm for females. The magnitude of systematic difference between data obtained before and after 1970 was about the same for HB and HL, and was larger for BZB (especially for males).
Possible causes of the systematic differences between the two YMes groups are inter-observer measurement error and differences in nutritional status. It is not likely that inter-observer measurement error was a cause of these systematic differences, because data from several different authors showed the same trend. It appears more likely that differences in soft tissue thickness due to changes in nutritional level are responsible for these systematic differences, given the finding that the magnitude of the systematic difference is about the same for HL and HB and larger for BZB.
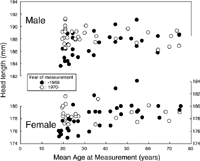
In order to examine for aging effects, mean HL and BZB were plotted against AMes. Figure 10 shows the relationship between AMes and HL. Significant correlations were observed in group 1, for both sexes (males, r=0.56; females, r=0.60). This is due to the finding that subjects in group 1 measured at an age of <30 years had smaller HL, as shown in Figure 8. The systematic difference between the two YMes groups was only clear for subjects in this age range. No aging trend was observed in group 2, for either sex.
 View Details | Figure 10. Relationship between head length and age at measurement for two groups based on the year of measurement. |
Figure 11 shows the relationship between AMes and BZB. The systematic difference between the two YMes groups is clearly shown. The only observed correlation was for group 1 males, whose BZB increased with age (r=0.76, df=15). Figure 11 strongly suggests that the positive secular change in females (Figure 4) is a spurious trend due to the systematic difference between the two YMes groups. Also, the negative secular change in group 1 males (Figure 9) may be a spurious trend due to the age-related changes in BZB.
 View Details | Figure 11. Relationship between bizygomatic breadth and age at measurement for two groups based on the year of measurement. |
When YMes was taken into consideration, HB still exhibited a clear secular change (Figure 7). The observed trend toward increasing BZB in females disappeared when YMes was taken into account (Figure 9), and it can be attributed to better nutritional status of subjects measured in and after 1970. In group 1, HL of both sexes and male BZB had significant positive correlation with AMes. Since AMes, YMes, and BY are correlated with each other, the trend first toward decreasing then increasing HL (both sexes) and BZB (male) requires further analysis.
In order to further examine the relationship between cephalic measurements and BY, partial correlation coefficients between each measurement and BY with YMes or AMes partialled out was calculated for groups 1 and 2 separately (Table 3). If the correlation between the measurement and BY becomes insignificant when YMes (or AMes) is partialled out, then the secular trend is considered to be spuriously caused by a significant correlation between BY and YMes (or AMes).
When YMes was partialled out, the significant negative correlation between HL and BY observed in group 1 became greater. However, when AMes was partialled out, the correlation between HL and BY became insignificant in females, and it became positive and significant in males. These findings indicate that YMes does not have much influence on the secular change in HL within the group 1, but AMes has significant effects. This is consistent with the observation that the subjects born between 1917 and 1939, measured between 1943 and 1957 at the age of 18 to 35 (arrows in Figure 8) have smaller HL. The reason why these subjects had smaller HL is not known. It could be due to slower and longer lasting growth of HL, or thinner soft tissues in the subjects at the time of measurement. The positive significant correlation between HL and BY observed in group 2 males also became insignificant when AMes was partialled out.
The significant negative correlation coefficient between BZB and BY observed in group 1 males became insignificant when AMes was partialled out, but the correlation became stronger when YMes was partialled out. This finding suggests that BZB increased with age in the males of group 1, and suggests that there were sex differences in nutritional status before 1960.
The present results indicate that head breadth (HB) has been increasing steadily, and its pattern of change is very similar to that of height. In contrast, bizygomatic breadth (BZB) did not show a trend with BY when effects of YMes were removed. Systematic differences between data obtained before 1970 and in and after 1970 can be attributed to effects of nutritional improvement on soft tissue thickness. This inference is consistent with the results obtained by the same observer for the two age groups (Table 2).
Strong association between HB and BZB appears to be a universal phenomenon (Mizoguchi, 1992). However, the present results indicate that HB and BZB react differently to factors that cause brachycephalization; HB increased, but BZB did not. It has been assumed that craniometric and somatometric data provide very similar information about secular changes, and this assumption has apparently been applied to measurements of the neurocranium. When environmental changes are very large, dimensions of facial bones do not change in adults, but the thickness of soft tissues of the face is affected. Thus the pattern of secular change in craniometric dimensions could differ from that of the corresponding cephalometric dimensions. Findings obtained from comparison of the two different age groups (Table 2), and the minimal secular change in BZB, suggest that the dimensions of the facial bones change less readily than the calvarial dimensions. It appears that the size of the neurocranium is important for its function (protecting the brain and providing attachment for muscles) but its form is not.
Whereas the brain follows the neural pattern of growth, height follows the general pattern of growth (Tanner, 1962). Within the first year of life, head dimensions reach more than 80% of adult size, but height reaches only 45% of adult size. Why do head breadth and height show a similar pattern of secular change, despite such differences? Parallel secular changes in cranial dimensions and limb lengths have been reported for populations other than Japanese. In studies of white American (Jantz and Jantz, 2000) and black South African (Cameron et al., 1990) populations, the pattern of secular changes in basion-bregma height and/or skull base height was similar to that of femur length.
Studies of growth and secular change in height indicate that adult height is strongly influenced by growth during the first 1 to 2 years of life (Bock and Sykes, 1989; Alberman et al., 1991; Schmidt et al., 1995). Greater height and earlier attainment of adult height are well known consequences of growth acceleration (Hoshi and Kouchi, 1981, Wieringen, 1986; Kouchi, 1996). Kretschmann et al. (1979) reported data indicating growth acceleration in brain size from 1880 to 1976. This data indicates that the speed of brain growth has increased, and that the age at which adult brain size is reached has decreased. For example, the estimated age at which 95% of male adult brain weight is attained is 6.13 years before 1880, 3.82 years from 1885 to 1890, and 2.85 years from 1966 to 1976 (Kretschmann et al., 1979). Because growth acceleration has been observed for both head size and height, if growth during early life is very important in determining adult size of both measurements, it is not surprising that they would show similar patterns of secular change.
This inference is consistent with debrachycephalization and increase in stature in European countries in recent years (Facchini and Gualdi-Russo, 1982; Susanne et al., 1988; Floud, 1994; Gyenis, 1994). Data from living subjects concerning secular change in head height is lacking, probably because measurements of auricular height are susceptible to large inter-observer measurement errors. However, the fact that the main cause of debrachycephalization in European countries is narrowing of HB with little or no increase in HL strongly suggests an increase in head height, as observed in the above-mentioned white American population.
In the present study, head breadth showed a positive secular change. A similar change has been observed in Koreans (Kouchi, 2000). However, the secular change observed in European populations is debrachycephalization due to a decrease in HB with a probable increase in head height. In both Asian and European populations, height has been increasing. This seeming discrepancy in changes of head form between Asian and European populations may be attributable to differences in the dominant direction of growth vectors.
The characteristic form of a normal neural skull is the result of the preferential direction of growth vectors of the expanding neural mass by neural fibers (Moss and Young, 1960; Sullivan, 1986). According to Trinkaus and LeMay (1982), “the metopic suture fuses at about the time anterior growth of the brain ceases (about 3 years of age), the sagittal and coronal sutures close next, consistent with a decrease in growth of the brain anteriorly and laterally, and the lambdoid suture appears to be the last to close.” The growth of cranial breadth and height are both related to growth at the sagittal and coronal sutures. If the growth vector in the lateral direction is more dominant than the growth vector in the vertical direction, a wider and lower skull will result. If the growth vector in the vertical direction is more dominant than the growth vector in the lateral direction, a narrower and higher skull will result. The observation of a compensatory relationship between cranial breadth and cranial height (Boas, 1899; Mizoguchi, 1992) supports this explanation.
Comparison of longitudinal growth data of Japanese infants (Terada and Hoshi, 1965) with longitudinal growth data of white American infants (Bayley, 1936) shows that the Japanese head is wider and shorter at 1 month, and the difference does not diminish at 3 years. These observations indicate that Asian-European differences in head form/dimensions appear very early, probably in the intrauterine period.
Suzuki (1969) and Nakahashi (1987) showed that, in Japanese, maximum cranial breadth has increased and maximum cranial length has decreased since the 14th century. Their data indicated that the trend in basion-bregma height was not clear, and that the magnitude of secular change in basion-bregma height was much smaller than those of cranial breadth and length. These observations also support the hypothesis that head breadth can change more readily than head height in Japanese.
The growth acceleration of the brain (Kretschmann et al., 1979) may be related to changes in head dimensions. Improved nutritional status in early life may accelerate brain growth in the dominant direction, but genetic factors may act in determining the dominant direction of the growth vectors.
Because the patterns of secular change differ between HL and HB (Figures 1 and 3), it is reasonable to deduce that the causes of secular changes are different, or that reactions to common factors are different. For secular change that has occurred during the last 100 years, the latter explanation is more plausible. Head length is related to posterior growth of the brain (Trinkaus and LeMay, 1982) as well as development of superstructures. Mizoguchi suggested a compensatory relationship between cranial breadth and height, with cranial length as an independent factor (Mizoguchi, 1992).
The sequence of brain growth may be an important factor in the present findings. Although much of the growth of the brain after 3 years of age is directed radially, the brain tends to expand predominantly posteriorly (Trinkaus and LeMay, 1982). In the last 100 years, brain growth has accelerated greatly, and the age at which adult brain size is attained has decreased, although the size of the adult brain has not changed much (Kretschmann et al., 1979). We speculate that earlier attainment of adult size reduces the time used for later posterior growth of the brain and leads to shorter cranial length, and that a greater amount of growth is directed laterally in Japanese and vertically in Europeans.
Japanese crania became shorter and wider from the 14th century to the 20th century (Suzuki, 1969; Nakahashi, 1987), while estimated height seems to have decreased until the late 19th century (Hiramoto, 1972). The pattern of secular change observed before the mid-19th century (wider cranium and lower estimated stature) is not consistent with that observed after 1890 (wider head and taller stature). Somatometric data can provide data for only the last 100 years, which has been a very unusual period in that the environment has changed drastically. Because the increase in mean height in the 20th century correlates very well with socioeconomic development (e.g., Bielicki, 1986), height measured in the 18th and 19th centuries is considered a useful indicator of social well-being or economic development (Fogel, 1986; Komlos, 1994). However, environmental conditions related to health in Japan from the 14th to the mid-19th century are difficult to assess, and skeletal evidence is not abundant.
With excavated skeletal materials, it is impossible to establish birth year cohorts for analysis of secular change. This obscures the pattern of change and the actual rate of change. Analysis of secular changes in modern cranial/skeletal materials based on birth year cohorts may provide more information on actual changes in the 19th century. Although the materials are not abundant, comparative analysis of skeletons from the medieval and Edo periods (especially analysis of growth processes) may provide insight into relationships between health status, environmental changes and the mechanism of the slow secular change of this period.
There are several possible explanations for the observed inconsistency in patterns of secular change. Environmental impact on growth processes of height and cranial measurements may be different, because it takes much longer for height to reach its final value than it does for head measurements. Environmental effects on prenatal and postnatal growth may be different. There may be a paleopathological paradox: results of a comparison of health status between skeletal populations based on stress markers in teeth and/or skeletons may contradict actual differences in health status (Suzuki, 1998). Cultural factors related to food may have played an important role, and physical environmental factors such as climatic change may have influenced diet. Studies based on skeletal materials are beyond the scope of this paper. Further studies are desirable to elucidate the causes and mechanism of brachycephalization.
|