| T. Hanihara, corresponding author. e-mail: hanihara@post.saga-med.ac.jp phone: +81-952-34-2220; fax: +81-952-34-2038 Published online 29 June 2004 in J-STAGE (www.jstage.jst.go.jp) DOI: 10.1537/ase.00092 |
Biological distances, regardless of the kinds of data used, reflect complex patterns of population relationship (population history) and population structure (Relethford, 1996). Regarding the population history of Japan, current evidence suggests that at least two waves of immigrants entered the Japanese archipelago from mainland Asia. The first major influx of new people is represented by the Yayoi and the subsequent Kofun populations, some of whom entered Japan via the Korean peninsula between 300 BC and 700 AD (e.g. Hanihara, 1991, 1998; Dodo et al., 1992). A second major intrusion is associated with the spread of Okhotsk people who share affinities with Amur River basin people (e.g. Yamaguchi, 1981; Ishida, 1988a, 1994, 1996), and who spread along the northeast coast of Hokkaido Island adjacent to the Okhotsk Sea between 500 AD and 900 AD, or during the period from the latter half of Epi-Jomon to the earlier half of Satsumon (regarding both Epi-Jomon and Satsumon periods in Hokkaido Island, see Dodo and Kawakubo, 2002). The Yayoi and Kofun people represent the main ancestral populations of the modern Japanese, although the genetic contribution of the prehistoric Jomonese cannot be completely excluded (e.g. Hanihara, 1991). Several researchers have demonstrated that the recent Ainu are closer to the prehistoric Jomon than they are to the Okhotsk people (Yamaguchi, 1982, 1992; Ishida, 1988a, 1996; Hanihara, 1998; Ishida and Kondo, 1999). The actual genetic contribution of the Okhotsk people to the formation of modern Japanese is unknown. While these studies provide considerable evidence for the patterns of variation, the impact of differential genetic drift and migration (gene flow) are likely to confound interpretation of historical relationships (Relethford, 1994, 1996).
The center of the debate is whether the recent Ainu are the direct descendants of the Jomon, and how the observed variation between these two groups should be interpreted in an evolutionary context (Yamaguchi, 1981; Ishida, 1988a, 1996; Hanihara, 1998; Matsumura, 2001; Dodo and Kawakubo, 2002). The primary causes of the differences between groups assumed to have an ancestor–descendant relationship, such as Jomon and Ainu, are gene flow, genetic drift, and/or natural selection. Regardless of the causes of the patterns of change, however, much of the variation observed in complex and multifactorial traits is likely to be the result of the interaction between genes and the environment (Crawford, 1998). In model-free analyses, including standard statistical methods such as Mahalanobis D2 and MMD, it is difficult to estimate explicitly the potential effects of genetic drift, gene flow, and effective population size on among-group variation (Relethford and Lees, 1982; Relethford, 1991, 1994). A model-free approach is, however, most frequently adopted in studies of physical anthropology. The justification for using model-free approaches is discussed by Pietrusewsky (2000) and Pietrusewsky and Chang (2003).
In model-free analysis, greater temporal and spatial comparisons are essential for understanding the possible causes of differentiation in local populations (Lahr, 1995, 1996). If the morphological variation observed occurs clinally over space and time, then the cause of this differentiation is not particularly important or it may be unknown. On the other hand, if the variation falls outside a general pattern, then one or more microevolutionary processes may be cited as responsible for the observed phenotypic and genetic differentiation. Taking these assumptions into account, the present study focuses on the comparison of morphological variation between Jomon and Ainu, and neighboring populations. Our purpose here is to address the specific problem of interpreting biological distances between Jomon and Ainu using a model-free approach.
The cranial samples analyzed in this study consist of two separate datasets constructed from three separate databases originally recorded by M.S., H.I., and T.H., respectively. The first dataset consists of the Jomon, Ainu, Yayoi, and modern Japanese samples collected by M.S. and the comparative samples, Sakhalin Ainu and Okhotsk people, recorded by H.I. and T.H. (Table 1). The second dataset, which was recorded by H.I. and T.H., includes 62 samples from pan-Pacific regions. The sample names and sizes with the brief information used in this study for the second dataset are presented in Table 2. The information for these samples is also given elsewhere (Hanihara and Ishida, 2001a, b, c, d, e; Hanihara et al., 2003). The Jomon sample included in the first dataset is added to the second dataset. For all the samples, both sexes were combined, since the frequency distributions by sex were not significantly different in most of the samples.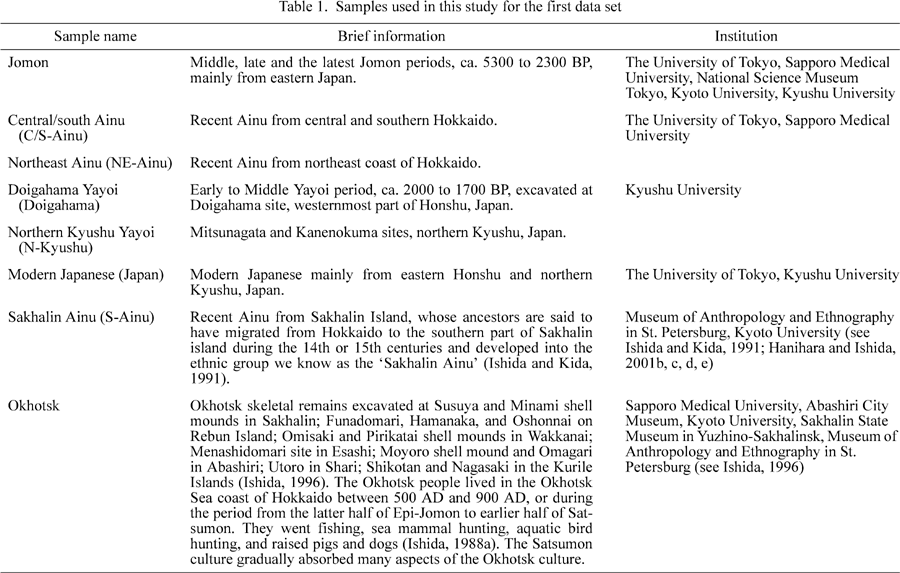


Table 3 lists the 18 traits, including references, used in this study. This study began with a selection of 22 nonmetric traits used by Dodo and Ishida (1990). Dodo and Ishida (1992) demonstrated the stability of the frequencies of the 22 traits during the last 2000 years from the Yayoi period to the present day in the Japanese archipelago, as well as their utility in discriminating between Ainu and non-Ainu Japanese. The 18 selected traits in this study are effectively free from interobserver error (Ishida and Dodo, 1990) and can be observed even in poorly preserved skeletal remains from archaeological sites.
Regarding the Ainu samples from Hokkaido, we used the term ‘northeast Ainu’ and ‘central/south Ainu’ to refer to these two Ainu groups. The northeast Ainu sample is from the region that overlaps the area containing the sites of the Okhotsk people which have been discovered thus far (Figure 1). Yamaguchi (1981) was one of the first researchers to demonstrate differences in cranial features between the Ainu from the Okhotsk Sea coast, eastern Hokkaido, and southwestern Hokkaido using discriminant function analysis and the χ2 test. The division of northeast Ainu and south/central Ainu is partially based on this study (Yamaguchi, 1981). The Ainu series housed in the University of Tokyo was examined by M.S. and H.I., respectively, to negate potential interobserver error.
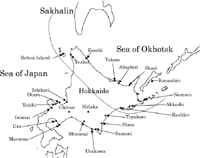 View Details | Figure 1. Map showing the location of the two Ainu groups: northeast Ainu and central/south Ainu. |
Although several new statistical methods have been developed for estimating biological distance using phenotypic traits (e.g. Konigsberg, 1990; Relethford, 1994; Relethford and Harpending, 1994, 1995), standard univariate and multivariate analyses, such as Fisher’s exact probability test, distance analysis based on Smith’s mean measure of divergence (MMD) (modified by Sjøvold, 1973), and principal coordinate analysis, are applied in the present study. Because many workers who use nonmetric traits have utilized the MMD statistic, the results obtained by MMD are more easily compared than would otherwise be the case.
The frequencies of occurrence of nonmetric traits for the samples included in the first dataset are presented in Table 4a and Table 4b. In Table 4a, the results of Fisher’s exact probability test for the difference in trait frequencies between the Jomon and two Ainu samples are given. The frequencies of four traits were found to differ significantly when the Jomon sample was compared to the two Ainu series: metopism, supraorbital foramen, ovale–spinosum confluence, and jugular foramen bridging. The frequencies of hypoglossal canal bridging and biasterionic suture vestige were significantly different between the Jomon and the central/south Ainu samples. The occurrence of the occipitomastoid bone differed significantly between the Jomon and northeast Ainu samples.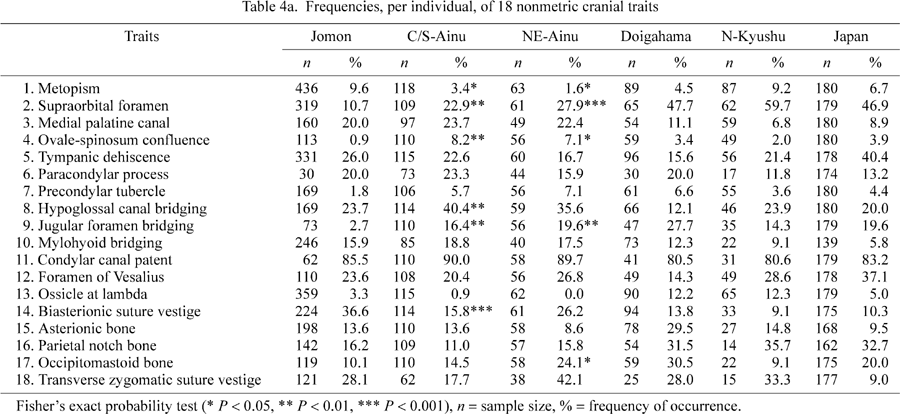
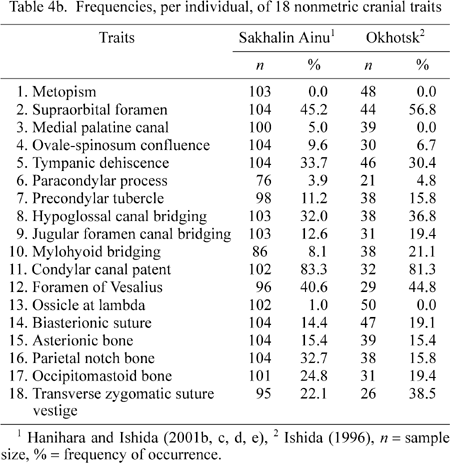
Figure 2 illustrates the frequencies of these seven traits found to be significant in evaluating the Jomon, central/south Ainu, northeast Ainu, Sakhalin Ainu, and Okhotsk samples. With a few exceptions, the frequencies of the seven traits in the Ainu groups are intermediate between those of the Jomon and Okhotsk samples. The Jomon sample shows a different pattern of trait frequencies.
 View Details | Figure 2. Graphic representation of seven nonmetric traits found to be significant in evaluating the Jomon, two Hokkaido Ainu, Sakhalin Ainu, and Okhotsk samples. |
Table 5 gives MMD distances between pairs of samples and the standard deviations based on the 18 nonmetric cranial traits shown in Table 3. Figure 3 is a plot of the samples on the first two dimensions assessed by principal coordinate analysis, accounting for 95.2% of the total variance. Four major constellations are evident. The modern Japanese and two Yayoi samples form a tight cluster. The second cluster consists of the more diffused Jomon and Hokkaido Ainu groups. The Okhotsk and Sakhalin Ainu samples form the third and fourth constellations, respectively. In Figure 3, the three Ainu samples show a relatively dispersed arrangement, suggesting large within-group variance. Moreover, some clinal variation from south to north is evident in the three Ainu samples. The central/south Ainu sample is closest to the Jomon sample. The northeast Ainu sample shifts toward the Okhotsk sample, though is still Jomon-like. The Sakhalin Ainu sample occupies an isolated position.
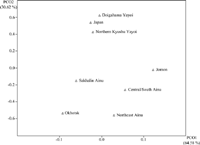 View Details | Figure 3. Two-dimensional expression of principal coordinates applied to the MMD matrix of Table 5, based on 18 non-metric cranial traits, expressing 95.2% of total variance. |
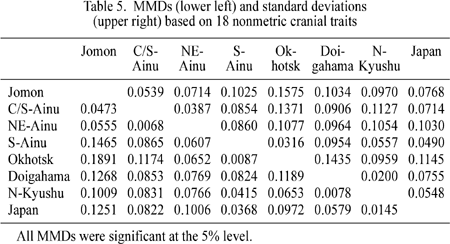
Figure 4 is a visual expression of biological distances assessed by MMDs between the Jomon, three Ainu groups, modern Japanese, two Yayoi samples, as well as the Okhotsk sample given in Table 5. The Jomon sample is the most distinct from the modern Japanese sample and the main ancestral populations of the modern Japanese (the Yayoi samples) as well as the Okhotsk sample. Among the three Ainu samples, the Sakhalin Ainu sample is the most differentiated. The two Hokkaido Ainu samples demonstrate the greatest differences when compared with the Okhotsk series.
 View Details | Figure 4. Bar chart showing MMD distances of modern Japanese, Doigahama Yayoi, northern Kyushu Yayoi, and Okhotsk samples compared to Jomon and three Ainu groups (see Table 5). |
Figure 5 compares the eastern Asian and circum-Pacific samples with the Jomon and Ainu samples. The distances shown in this figure are based on MMDs calculated from 18 nonmetric cranial traits. The morphological differences between the Jomon and other samples are greater than those between Ainu and these same series, reflecting at least in part temporal and spatial differences in the ranges of variation. Except for the Northeast Asian samples, the pattern of dissimilarities of the Jomon and Ainu samples to the Asian and circum-Pacific samples is more or less the same. Close affinities between the Northeast Asian and Ainu samples relative to the Northeast Asian and Jomon samples are evident. Figure 6 is a two-dimensional ordination based on principal coordinate (PC) analysis of the MMD distance matrix of 64 regional groups based on 18 traits (Figure 6a shows the first and second PCs, and Figure 6b shows the first and third PCs). Two major clusters are indicated in these figures, one containing all the East/Southeast Asian and Oceanic cranial series, and a second that includes the series from Northeast Asia, the Arctic, and the New World. The Jomon and Ainu samples occupy a distinct and separate branch. The Jomon sample is the most differentiated. On the other hand, the Sakhalin Ainu, and to a lesser extent the Hokkaido Ainu, samples are more closely associated with the northeast Asian cluster in Figure 6a, and with the Native American groups in Figure 6b.
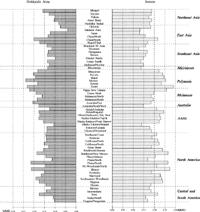 View Details | Figure 5. Biological distances measured by MMDs between Ainu and circum-Pacific population samples (left) and between Jomon and circum-Pacific samples (right). |
 View Details | Figure 6a. Two-dimensional plots of groups on (a) the first and second principal coordinates, and (b) the first and third principal coordinates. |
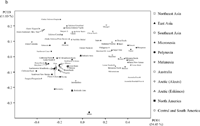 View Details | Figure 6b. Two-dimensional plots of groups on (a) the first and second principal coordinates, and (b) the first and third principal coordinates. |
In studies of population history, interpretation of the variation observed in prehistoric and recent populations depends, in part, on the samples selected for analysis. When the Okhotsk sample was included in previous analyses, Yamaguchi (1981), Ishida (1988a, b, 1996), Hanihara (1998), and Ishida and Kondo (1999) recognized the possible genetic influence of Northeast Asian populations on the Hokkaido Ainu. On the other hand, Dodo and Kawakubo (2002), based on diachronic comparisons among Jomon, Epi-Jomon, and recent Ainu, concluded that the main cause for observed variation between Jomon and Ainu could be attributed to microevolutionary change.
The great morphological differentiation between Jomon and Ainu relative to that between the Yayoi immigrants and modern Japanese, which parallels the findings from other studies of metric and nonmetric cranial variation (Howells, 1966, 1986; Dodo, 1986c; Ossenberg, 1986, 1992; Ishida and Kida, 1991; Dodo et al., 1992; Ishida, 1996; Pietrusewsky, 1999, 2000; Dodo and Kawakubo, 2002), may reflect: (1) higher levels of gene flow from an outside source; (2) a higher mutation rate; (3) genetic drift; (4) a larger effective population size or different timing of population growth; or (5) sampling error (Relethford and Blangero, 1990; Relethford and Harpending, 1994, 1995; Powell and Neves, 1999). Model-free procedures, however, do not provide concrete information on the differences between observed and expected genetic or phenotypic variance related to the effects of differential external gene flow, genetic drift, or population size. One of the approaches commonly used in model-free analyses to elucidate the possible causes of among-group variation is to use samples with greater spatial and temporal control.
The morphological distinctiveness of Jomon and Ainu found here is in agreement with that shown by other researchers (e.g. Howells, 1966, 1986; Brace et al., 1984, 1989; Dodo, 1986c; Ossenberg, 1986, 1992; Turner, 1987, 1990, 1992; Kozintsev, 1990, 1992a, b, 1993). This suggests that the influence of nonrandom sampling effects, or population pooling, that artificially biases between-group variation may be very limited in the present results. In the present study, clinal variation from south to north in the three Ainu groups was detected. Sakhalin Ainu show closer affinities to the Okhotsk people and recent Northeast Asians than to Hokkaido Ainu (Turner, 1990; Ishida, 1994). Within the Hokkaido Ainu groups, moreover, the northeast coast group is more northern-like than is the central/south group. Yamaguchi et al. (1993) reported that the Hokkaido, Sakhalin, and Kurile Ainu groups form a relatively tight cluster and fall between the Jomon and Japanese–Okhotsk cluster. The pattern of the variation which results in the large-scale comparison shown in Figure 6 may allow us to propose gene flow from Northeast Asia before and after the Jomon period or adaptation to local environment. However, studies of nonmetric worldwide cranial variation, including those examined in this research, do not show any identifiable adaptive value related to environmental or subsistence factors, suggesting that a strong genetic component is responsible for the observed frequencies of the nonmetric cranial traits. At the very least, selection pressure seems less likely a cause for the temporal and spatial pattern of nonmetric cranial variation observed in Jomon and Hokkaido Ainu.
The two immigrant Yayoi groups and modern Japanese remain divergent from Hokkaido Ainu, which makes it difficult to hypothesize admixture among these groups. Likewise, Dodo and Kawakubo (2002) have rejected the genetic influence of the immigrant Yayoi population on the formation of physical characteristics of recent Ainu proposed by Matsumura (2001). On the other hand, the present findings shed light on the possibility of a certain degree of admixture of the Ainu with neighboring northern groups such as the Okhotsk people, and modern Japanese as described by Dodo and Kawakubo (2002).
It is a matter of additional interest that the Ainu show some association with Native American groups (Figure 6b). Recently, morphological affinities between Ainu and Palaeoindians in the New World have been suggested (Brace et al., 2001). The present findings, however, do not necessarily support the Ainu–Palaeoindian connection, because an ancestor-descendant relationship between early and late Holocene American series remains tentative (Steele and Powell, 1992; Lahr, 1995; Jantz and Owsley, 2001, 2003; Van Vark et al., 2003). However, if we accept the hypothesis that Native Americans are derived from prehistoric Northeast Asians with more generalized craniofacial features (Howells, 1959; Lahr, 1995), the morphological shift of Ainu to the Native Americans throws light on the relationships between prehistoric Northeast Asia and Hokkaido.
At the simplest level, biological distances between populations can be interpreted as reflecting genetic drift, gene flow, natural selection, or common ancestry (Relethford, 1991, 1996; Lahr, 1995). Relethford (1991) goes further to say that the key problem is determining which combination of these factors is responsible for biological relationships (Relethford and Harpending, 1994, 1995; Relethford, 1996). The present findings show that the distance between Jomon and Ainu is, for example, larger than between immigrant Yayoi and modern Japanese. This suggests that the genetic characteristics of the Ainu do not necessarily provide sufficient information needed to solve the question of the origin of the Jomon population.
We wish to express our sincere gratitude to Dr G. Murakami, Department of Anatomy, Sapporo Medical University; Dr G. Suwa, Department of Anthropology and Prehistory, University Museum, the University of Tokyo; Dr H. Baba and Dr Y. Mizoguchi, Department of Anthropology, National Science Museum, Tokyo; Professor Emeritus, H. Ishida, Department of Zoology, Kyoto University; and Dr T. Nakahashi, Department of Human Societies, Kyushu University. Thanks are extended to Dr T. Molleson, Dr R. Kruszynski, Dr L.T. Humphrey, and Dr C. Stringer of the Natural History Museum, London; Dr R. Foley, Dr M.M. Lahr, and Dr M. Bellatti of the Department of Biological Anthropology, University of Cambridge; Dr A. Langaney and Dr Miya Awazu Pereira da Silva of Laboratoire d’Anthropologie Biologique, Musée de l’Homme, Paris; Dr D. Hunt, Dr S. Ousley, Dr D. Owsley, Dr R. Potts, Dr M. London, and Dr D.H. Ubelaker of the Department of Anthropology, National Museum of Natural History, Smithsonian Institution, Washington DC; Dr I. Tattersall, Dr K. Mowbray, and Dr G. Sawyer of the Department of Anthropology, American Museum of Natural History, New York; Dr J. Specht, Dr P. Gordon, Dr L. Bonshek, and Dr N. Goodsell of the Department of Anthropology, Australian Museum, Sydney; Dr J. Stone and Dr D. Donlon of the Department of Anatomy and Histology, University of Sydney; Mr D. Henley of the New South Wales Aboriginal Land Council, Sydney; Dr M. Chow, a dentist in Sydney; Dr M. Hanihara of the School of Languages, Macquarie University, Sydney; Dr C. Pardoe and Dr G.L. Pretty of the Department of Anthropology, South Australian Museum, Adelaide; Dr Y.H. Sinoto of the Department of Anthropology, B.P. Bishop Museum, Honolulu; the late Dr V.P. Alekseev of the Institution of Archaeology, Moscow; Dr T.I. Alekseeva of the Moscow State University; Dr I.I. Gokhman and Dr A.G. Kozintsev of the Museum of Anthropology and Ethnography, St Petersburg; Dr A.P. Derevyanko and Dr T.A. Chikisheva of the Institution of Ethnography and Archaeology, Novosibirsk; Dr G.I. Medbedev of Irkutsk State University; for their kind permission to examine the skeletal collections under their care.
This study was supported in part by Grants-in-Aid for Scientific Research (Nos. 1440521 and 1454069 to T.H.) and Scientific Research of Priority Areas (No. 15068210 to H.I.) from the Ministry of Education, Culture, Science and Technology of Japan; a Japan Fellowship for Research in the former Soviet Union (H.I.) and United Kingdom (T.H.) from the Japan Society for the Promotion of Science; and the Smithsonian Institution Fellowship Program, Smithsonian Opportunities for Research and Study (Senior Fellowship in 2001–2002 to T.H.).