| T. Yamauchi, corresponding author. e-mail: taro@humeco.m.u-tokyo.ac.jp phone: +81-3-5841-3529; fax: +81-3-5841-3395 Published online 29 June 2004 in J-STAGE (www.jstage.jst.go.jp) DOI: 10.1537/ase.040210 |
Obesity is a global health issue. According to the World Health Organization (WHO), the prevalence of obesity is increasing rapidly in developing countries (WHO, 2000). Obesity is related to several chronic diseases, including diabetes mellitus, hypertension, and other cardiovascular diseases. The body mass index [BMI = body weight/height2 (kg/m2)] is the most widely used measurement of obesity at the individual and population levels. BMI does not measure the amount of body fat, and therefore, is not the best way to assess obesity, because obesity is an excess of body fat, not an excess of body weight. The WHO criterion for obesity is a BMI ≥ 30 kg/m2, based on the relationship between BMI and morbidity and mortality for a Caucasian sample (WHO, 1995, 2000). However, there is increasing evidence suggesting that this cut-off value cannot be applied to non-Caucasian populations, e.g. Asian or Pacific island populations (Swinburn et al., 1999; WHO/IASO/IOTF, 2000; Ko et al., 2001). Conventional BMI cut-offs would underestimate the prevalence of obesity for Asian populations, but overestimate it for Pacific island populations.
Another problem in assessing obesity using BMI is that it does not consider the difference in the body compositions of athlete and non-athlete subjects. Highly trained athletes usually have a larger muscle mass and a relatively smaller fat mass when compared with normal subjects of the same body weight. Athletes can be misclassified as overweight or obese when the BMI cut-offs for normal subjects are used.
The Sumo wrestler is the most remarkable example of this. Sumo wrestlers have attracted the attention of anthropologists, health scientists, and sports medicine scientists for many decades because they have extremely large bodies. Anthropometric dimensions of Sumo wrestlers, such as stature, body weight, and length and circumference of the limbs and trunk, have been reported in several studies (e.g. Hattori, 1995). However, little is known about the body composition of Sumo wrestlers, such as their percentage of body fat (%Fat).
We measured the anthropometric dimensions and the resting metabolic rate (RMR) for college Sumo wresters and non-athlete healthy students. The body composition of the two groups was then determined. The objectives of this study were, first, to evaluate the validity of conventional BMI cut-offs for assessing obesity in Sumo wrestlers by comparing them with the %Fat cut-offs, and second, to describe the unique body composition of Sumo wrestlers comparing present and previously published data. Finally, our objective was to discuss new criteria and methods for documenting obesity in Sumo wrestlers based on energy metabolism that considers physical activity and dietary intake.
Male college Sumo wrestlers (n = 15) and healthy non-athlete students (n = 20) were selected for anthropometry and metabolic measurements. Their ages were 20.5 ± 0.5 (mean ± SD) years in the Sumo wrestler group and 21.9 ± 0.2 years in the non-athlete student group. The college Sumo wrestling club to which the Sumo wrestlers belonged is one of the top college Sumo clubs in Japan, and has produced many professional Sumo wrestlers. The non-athlete students had no indication of health problems. The subjects were fully informed about the procedures, as well as the purpose of the study, and their informed consent was obtained.
Anthropometric dimensions were measured following a standard protocol (Weiner and Lourie, 1981). Stature was measured to the nearest 1 mm using an anthropometer (GPM, Switzerland), and weight was measured to the nearest 0.1 kg using a portable digital scale (THD-652, Tanita, Japan). Bioelectric impedance was measured in the non-athlete students using a body fat analyzer (TBF 310, Tanita, Japan) to estimate the percentage of body fat (%Fat). Upper arm, waist, and hip circumferences were measured with a flexible tape made of glass-fiber. Skinfold thickness was measured in the non-athlete students at the triceps and subscapular sites, to the nearest 0.2 mm, using Holtain skinfold calipers (Holtain, Briberian, UK). For Sumo wrestlers, subcutaneous fat thickness was measured using a B-mode ultrasound apparatus (SSD-500, Aroka, Japan) at the following six sites: forearm lateral, biceps, triceps, abdomen, subscapula, quadriceps, and hamstrings. The %Fat was then determined using body density estimated from the subcutaneous fat measurements (Abe et al., 1994).
The RMR was measured in the sitting position using indirect calorimetry with the Douglas bag technique (Douglas, 1911; Yamauchi and Ohtsuka, 2000). The measurement was made between 10:00 and 11:00 a.m. While the subject was sitting quietly on a chair, a facemask was attached and, after 10 minutes for stabilization, expired air was collected for 5 minutes. An oxygen (O2) and carbon dioxide (CO2) monitor (AE-280s, Minato Medical Science, Japan) was used to determine the O2 and CO2 contents of the expired air. The O2/CO2 monitor was calibrated with precalibrated gas from tanks containing 16% O2 and 5% CO2, and pure nitrogen gas to ensure accurate measurements. The volume of expired air was determined using a dry gas volume meter (DC-5, Shinagawa, Japan) and converted to standard temperature and pressure for dry gas (STPD). The energy values were calculated using the equation of Elia and Livesey (1992):
Energy expenditure (kJ) = 15.82 × O2 (L) + 5.18 × CO2 (L).
Inter-group differences (i.e. Sumo wrestlers vs. non-athlete students) were examined using an unpaired t-test. Correlations between %Fat and body composition measurements (including body weight, BMI, waist-hip ratio, and upper-arm, waist, and hip circumferences), as well as between RMR and body composition indices (including body weight, FFM, BMI, %Fat, and upper-arm, waist, and hip circumferences), and waist–hip ratio were tested using Pearson’s correlation test in Sumo wresters and non-athlete students. Least squares regression lines were calculated between %Fat and BMI for the Sumo wrestlers and non-athlete students. All analyses were conducted using the JMP5.0J statistical package (SAS Institute, Inc., Cary, NC). A value of P < 0.05 denoted the presence of a significant statistical difference.
Table 1 shows the characteristics of the subjects, including anthropometric measurements, and calculated indices of nutritional status (BMI, %Fat, and waist–hip ratio). The Sumo wrestlers have higher values for all of the measurements. Considerable differences existed in both body weight and BMI; the average weight of the Sumo wrestlers was 2.1 times that of the non-athlete students, and Sumo wrestlers had an average BMI 1.9 times that of the non-athlete students. Despite this, the %Fat of the Sumo wrestlers was only 1.6 times that of the non-athlete students. Therefore, the contribution of fat-free mass (FFM) to the difference in body weight between the two groups was larger than that of fat mass (FM). According to the WHO criteria for obesity based on BMI values (WHO, 2000), the Sumo wrestlers were categorized as severely obese, while the non-athlete students were within the normal range.
To illustrate the relationship between BMI and %Fat, data for the Sumo wrestlers and non-athlete students were plotted (Figure 1) on the body composition chart developed by Hattori et al. (1997). The BMI was divided into two indices, the fat-free mass index (FFMI) and the fat mass index (FMI), using %Fat. These two indices are defined as follows:
FMI = FM/height2 (kg/m2)
FFMI = FFM/height 2 (kg/m2).
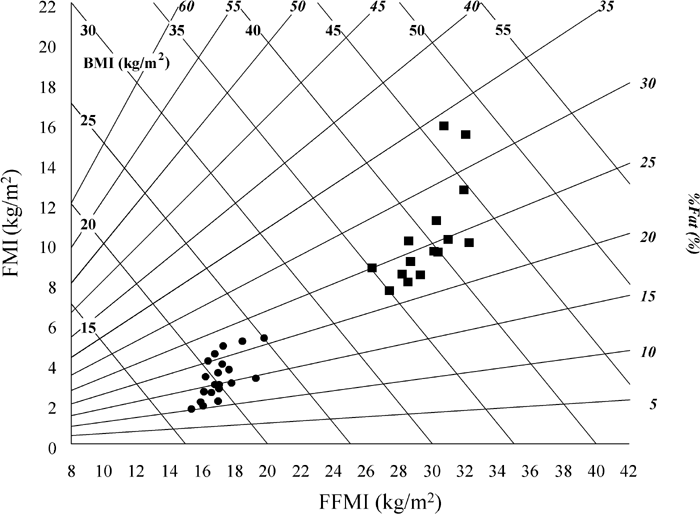 View Details | Figure 1. Body composition chart for Sumo wrestlers and non-athletes. FMI, fat mass index; FFMI, fat-free mass index (see details in text). Oblique lines represent BMI and %Fat. Squares: Sumo wrestlers (n = 15), circles: non-athlete students (n = 20). |
The lowest BMI of the Sumo wrestlers was 35.0, which exceeded the WHO criterion for obesity (BMI ≥ 30.0). Of the 15 Sumo wrestlers, eight were in obese class II (severe, 35.0 ≤ BMI < 40.0) and seven were in obese class III (very severe, BMI ≥ 40.0). By contrast, none of the non-athlete students were obese: 80% (n = 16) were within the normal range (18.5 ≤ BMI < 25), one subject was overweight (25.0 ≤BMI < 30), and three were underweight (BMI < 18.5).
Obesity is also conventionally characterized using %Fat > 25% in males (Deurenberg et al., 1998, 1999; WHO, 2000; Ko et al., 2001), which corresponds to BMI = 30 in young Caucasians (WHO, 1995). The mean %Fat in the Sumo wrestlers was 25.6% (range 22.1–34.1%) and was relatively low compared with the BMI. Indeed, the chart shows that only six of the 15 Sumo wrestlers exceeded the %Fat = 25% line, and should, therefore, be categorized as obese, while the remaining nine wrestlers were below the line and should be considered non-obese (Figure 1).
Pearson’s correlation coefficients were calculated between %Fat and body composition measurements (including body weight, BMI, waist–hip ratio, and upper-arm, waist, and hip circumferences). In the Sumo wrestlers, there was a significant positive correlation between %Fat and the measurements, with the exception of upper-arm circumference, whereas in non-athlete students, a significant positive correlation was observed between %Fat and the measurements. Strong correlations with %Fat were observed for waist circumference (r = 0.86), body weight (r = 0.86), BMI (r = 0.86), and hip circumference (r = 0.83) in the Sumo wrestlers. Similar strong correlations were found for waist (r = 0.84) and BMI (r = 0.81) in the non-athlete students.
The least squares regression lines between BMI and %Fat for the Sumo wrestlers and students were very different (Figure 2, BMI = 0.92 × %Fat + 16.50 for Sumo wrestlers vs. BMI = 0.41 × %Fat + 13.83 for non-athlete students). The slope for the Sumo wrestlers was more than twice as steep as the slope for the students.
 View Details | Figure 2. Relationship between percentage of body fat (%Fat) and BMI in Sumo wrestlers and non-athlete students with least squares regression lines. In Sumo wrestlers (squares), BMI = 0.92 × %Fat + 16.50 (P < 0.01). In non-athlete students (circles), BMI = 0.41 × %Fat + 13.83 (P < 0.01). |
Table 2 shows the absolute RMR, and the RMR adjusted for body weight (RMR/BW) or FFM (RMR/FFM) for the Sumo wrestlers and non-athlete students. RMR was significantly higher in Sumo wrestlers than in non-athlete students (P < 0.01). Conversely, the non-athlete students had significantly higher RMR/BW and RMR/FFM values than the Sumo wrestlers.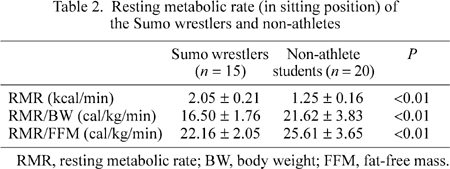
No significant correlations were found between RMR and the body composition indices (including body weight, FFM, BMI, %Fat, and upper-arm, waist, and hip circumferences), and waist-hip ratio in both the Sumo wresters and non-athlete students. Figure 3 shows an example of the relationship between RMR and body weight.
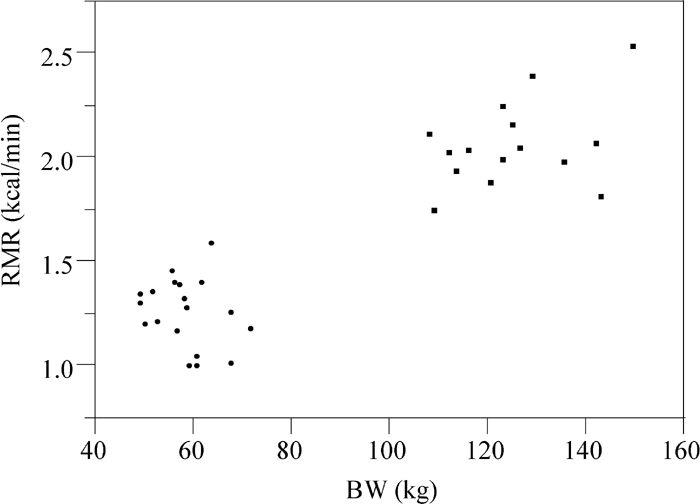 View Details | Figure 3. Relationship between resting metabolic rate (RMR) and body weight (BW) in Sumo wrestlers (squares) and non-athlete students (circles). |
In this study, all the Sumo wrestlers were classified as obese using BMI as the reference, whereas only 40% were judged as obese when %Fat was used. This indicates that BMI is not appropriate for assessing obesity in Sumo wrestlers because they have a large muscle mass and are consequently heavier.
The BMI values corresponding to a %Fat of 25 were estimated from the predictive equations obtained in the regression analysis (Figure 2). A %Fat of 25.0, the cut-off for obesity, corresponded to a BMI of 24.1 kg/m2 in the non-athlete students, although only one of the non-athlete students reached that BMI value. This value was slightly lower than, but comparable to, the BMI of 25.0 kg/m2, which is the cut-off for Asian populations (obese I) proposed by the Regional Office for the Western Pacific of the WHO, the International Association for the Study of Obesity, and the International Obesity Task Force (WHO/IASO/IOTF, 2000), as well as the cut-off for the Japanese population (obese grade I) recommended by the Japan Society for the Study of Obesity (Kanazawa et al., 2002). For Sumo wrestlers, the BMI corresponding to a %Fat value of 25.0 was 39.5 kg/m2, which is classified as ‘severely obese’ (obese II, 35.0 ≤ BMI < 40) using the WHO classification (WHO, 2000). This indicates that the relationship between BMI and %Fat in Sumo wrestlers is very different from that in subjects with a normal body size, supporting the claim that the conventional assessment of obesity based only on BMI is inappropriate for people with excessive muscle mass.
Sumo has a 2000-year history; this history qualifies it as the national sport of Japan (Nishizawa et al., 1976; Hattori, 1995). Sumo became a professional sport almost 300 years ago, but is still practiced today in many amateur clubs. For example, many colleges and universities have Sumo wrestling clubs.
The first scientific report on the physique of Sumo wrestlers was published more than a century ago (Miwa, 1889). Since then, there have been many studies of Sumo wrestlers. However, most of these studies have been written in Japanese (although English abstracts are available for some). In addition, most of these studies focused on physique, i.e. on such things as stature, body weight, and the dimensions of the body. Only a few studies have reported the body composition of Sumo wrestlers. Here, we summarize the results of studies dealing with the body composition (%Fat) of Sumo wrestlers as a representative population having excessive muscle mass and extraordinarily large bodies (Table 3). The major findings can be summarized as follows. First, among professional Sumo wrestlers, wrestlers in the higher leagues have larger bodies than those who belong to the lower leagues (e.g. Nishizawa et al., 1976; Hattori et al., 1999). In addition, apprentice wrestlers (Shindeshi) are generally smaller than other professional wrestlers (i.e. those belonging to leagues). The inter-league difference in body size was especially evident in body weight.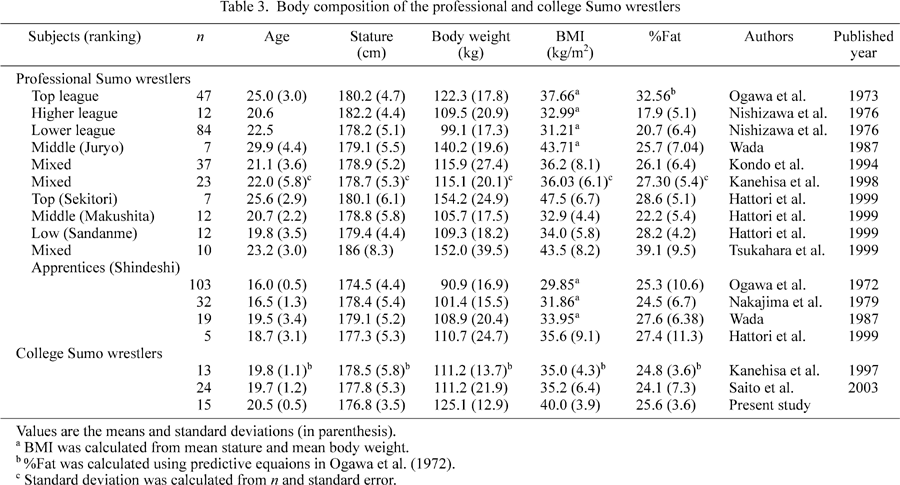
Second, secular trends in body size have been observed in relation to studies of apprentices. The mean body weight and BMI increased from the early 1970s to the late 1990s. In particular, a considerable increase in body weight was detected in the 1970s (Ogawa et al., 1972; Nakajima et al., 1979). By contrast, no clear trend was found for professional Sumo wrestlers other than apprentices. Nakajima et al. (1979) reviewed 18 studies published between 1889 and 1979 and pointed to the enlargement in the physique of professional Sumo wrestlers over a century. Within this period, a rapid increase in body size occurred in the 1970s. In relation to this, Hattori (1995) discussed the secular trends in the body size of Sumo wrestlers from a socioeconomic viewpoint. He suggested that there was a relationship between the increased body size of Sumo wrestlers and Japan’s economic growth, together with the prevalence of television sets in ordinary homes in the 1970s. Therefore, secular trends in the size of Sumo wrestlers have been observed from the late 1890s until the 1970s, although no clear trend has been seen from the 1980s to the present.
Finally, our Sumo subjects were heavier than the subjects of two recent studies of college Sumo wrestlers, although they were not quite as tall (Kanehisa et al., 1997; Saito et al., 2003). Moreover, the bodies of our subjects were larger than those of apprentices and equaled or exceeded those of low–middle rank professional Sumo wrestlers. The college Sumo wrestlers in this study could be considered typical Sumo wrestler subjects, a category that would include both professional and collegiate subjects.
In simple terms, obesity is a consequence of an energy imbalance, i.e. energy intake exceeds energy expenditure over a considerable period. Therefore, in addition to body composition indices such as BMI and %Fat, significant indicators in classifying obesity of Sumo wrestlers might be physical activity (energy expenditure) and energy intake. In other words, a lifestyle approach (or an ecological approach) would appear to be the most effective means for understanding and combating obesity (Egger and Swinburn, 1997; Yamauchi et al., 2001a, b).
In people with extraordinarily large bodies, energy intake and expenditure probably balance at a higher level than in those with a normal body size. Among people with extraordinarily large bodies, Sumo wrestlers have excessive muscle mass, and both their physical activity levels and energy intake are expected to be high. Therefore, it is very important to consider the energy balance when assessing the level of obesity in relation to Sumo wrestlers. Specifically, a desirable level of physical activity and energy intake for Sumo wrestlers should be determined.
To our knowledge, no study on physical activity or total energy expenditure (TEE) is available for Sumo wrestlers. However, there are two possible ways to determine the desirable level of physical activity: one is based on epidemiological analyses of various contemporary populations and the other is an evolutionary perspective based on estimating the physical activity of Paleolithic people (Yamauchi et al., 2004). With respect to the former, the WHO (2000) have suggested that people sustain a physical activity level [PAL = TEE/basal metabolic rate (BMR)] ≥ 1.75 in order to avoid excessive weight gain, based on analyses of over 40 national physical activity studies worldwide (Ferro-Luzzi and Martino, 1996).
The average PAL of paleolithic humans was estimated to be approximately 1.8 (range 1.6–2.0: Leonard and Robertson, 1992; Cordain et al., 1998). Based on these epidemiological and paleolithic data, Yamauchi et al. concluded that it is reasonable to consider a PAL of 1.75–1.80 as the desired level of daily physical activity (Yamauchi et al., 2004). These values correspond to ‘moderate’ for males (PAL = 1.78), according to the WHO criteria (FAO/WHO/UNU, 1985). Here we propose a PAL = 1.75 as the cut-off value of a desirable PAL (i.e. the lowest limit PAL) for Sumo wrestlers.
In contrast, a number of studies have examined the diets of Sumo wrestlers (Nishizawa et al., 1976; Yamada et al., 1991; Tsukahara et al., 1999). However, the estimated daily energy intake for Sumo wrestlers varies in the literature: 3098–4561 kcal/day (Yamada et al., 1991), 3939 kcal/day (Tsukahara et al., 1999), and 5122–5586 kcal/day (Nishizawa et al., 1976). FAO/WHO/UNU (1985) suggested that energy needs are determined by energy expenditure. Therefore, estimates of requirements should be based on measurements of energy expenditure (FAO/WHO/UNU, 1985). Therefore, we propose a cut-off value for the desirable energy intake (i.e. the highest limit energy intake) as the desirable energy expenditure × 1.10, taking into consideration a 10% technical error when estimating energy intake and a possible energy imbalance over a short period.
Based on the results of present study and the above discussion, we propose the following new criteria for documenting obesity in Sumo wrestlers:
1) Body composition: %Fat > 25%.
2) Physical activity: PAL < 1.75. For the Sumo wrestlers in this study (mean RMR 2952 kcal/day), a PAL of 1.75 corresponds to 4305 kcal/day of TEE using the relationship between RMR and BMR [RMR = 1.2 × BMR (FAO/WHO/UNU, 1985)].
3) Dietary intake: daily energy intake > 110% of TEE. For the Sumo subjects, 110% of TEE corresponds to 4785 (= 4305 ×1.1) kcal/day.
In this study, 40% (n = 6) of the college Sumo wrestlers were judged as obese in terms of %Fat, but fewer subjects would be expected to be categorized as ‘obese’ when physical activity and dietary intake are considered simultaneously. The new criteria for obesity might be applicable to the general population of obese subjects. Further studies are needed to examine the validity of these obesity criteria for ‘normal’ (non-athlete) obese people.
We performed anthropometric and RMR measurements on college Sumo wrestlers and healthy male non-athlete students. The level of obesity was assessed using BMI and %Fat as reference indices. All of the Sumo wrestlers were categorized as obese using the conventional WHO criteria based on the BMI, whereas only 40% of the wrestlers were categorized as obese when %Fat was used as the reference. Due to their heavy FFM, Sumo wrestlers can be misclassified as obese. To further understand the differences in the body composition of the two groups, a body composition chart was used. The chart clearly illustrated that the body compositions of the two groups differed qualitatively and that the adiposity of some Sumo wrestlers was no higher than that of non-athlete students. This suggests that it is necessary to consider both BMI and %Fat to assess obesity in excessively muscular people. We proposed new criteria and methods for documenting obesity in Sumo wrestlers based on a lifestyle approach that considers physical activity and dietary intake. Further studies of the physical activity and dietary intake of Sumo wrestlers and the normal non-athlete obese sample are needed to examine the applicability of the new criteria and to provide effective countermeasures for severely obese patients.
We thank the participants in this study, as well as the members of the Departments of Human Ecology (The University of Tokyo) and Exercise and Sport Science (Tokyo Metropolitan University), and the staff of the Sumo club of Nihon University for their cooperation with the measurements. This study was supported in part by a grant from the Meiji Life Foundation for Health and Welfare, Tokyo, Japan.
|