| Roshan Peiris, corresponding author. e-mail: rdpeiris@mascat.nihon-u.ac.jp phone: +81-47-360-9318; fax: +81-47-364-6295 Published online 13 September 2005 in J-STAGE (www.jstage.jst.go.jp) DOI: 10.1537/ase.00056 |
The multi-ethnic population of Sri Lanka (approximately 19 million) consists of 74% Sinhalese, 18% Tamils, 7% Muslims, and 1% other minorities (aboriginal Veddahs, Moors, Malays, Christians, etc.). The Sri Lankan Sinhalese and Tamils are considered to have arrived in Sri Lanka, respectively, in the 5th century BC from northeastern India (present day west Bengal) and in the 1st century BC from southern India (presently Tamilnadu) (Codrington, 1926). Although the Sri Lankan Sinhalese and Tamils are quite distinct in religion, language, and social system, intermarriage between the two groups has been going on for generations. Genetic studies between the two populations have revealed that the present-day Sinhalese of Sri Lanka are genetically more similar to the Tamils of Sri Lanka and south India than the Bengalis of northeast India (Saha, 1988; Kshatriya, 1995; Papiha et al., 1996). However, the two Sri Lankan ethnic groups are not evenly spread throughout the island, but instead live in concentrated areas according to where they settled historically. For example, the Sri Lankan Tamils are heavily concentrated in the northern and eastern dry zone of Sri Lanka while the Sri Lankan Sinhalese occupy the southern, western, and central wet zone of the island. It can be said that their different life styles are in part dependent on their living environmental conditions.
While dental anthropology has contributed major insights into the evolution and formation of many of the world’s human populations, little work in this area has been done on the populations of southern Asia (e.g. Lukacs, 1984). In particular, the odontometrics of Sri Lankan Sinhalese and Tamils have scarcely been discussed. The first report of Sri Lankan odontometric variation seen in the anthropological literature is by de Terra (1905). He included five Sri Lankan Sinhalese and seven Sri Lankan Tamil skulls in his monograph on the odontography of human races, where he reported data on length and breadth of tooth crowns, cusp number, groove pattern of molars, and root form. He recorded maximum and minimum values of crown dimensions, rather than the basic statistics commonly used today. de Terra (1905) found that both Sri Lankan Sinhalese and Tamil teeth were in the mesodont range when evaluated by Flower’s dental index (Flower, 1885). About six decades later, Stoudt (1961) reported on the physical anthropology of Sri Lankan populations, based on data collected by Marett between 1937 and 1939 during a phase of the ethnological survey of Sri Lanka. This report included information on tooth eruption, dental crowding, tooth size and caries, along with standard anthropometric observations. Although this was the earliest thorough analysis of Sri Lankan dental variation, the data were crudely assembled with no quantitative assessment of dental size. For example, tooth eruption was judged as complete or incomplete, while tooth size was reported as large, medium, or small. Chandrasekara and Nanayakkara (1999) were the first to undertake a quantitative investigation of dental size and variation in a modern Sri Lankan population. They reported the basic statistics of crown dimensions (mesiodistal and buccolingual) of the permanent teeth in a sample of Sri Lankan Sinhalese university students, and reported sexual dimorphism in size, with males having larger teeth.
The purpose of the present report is to provide mandibular molar crown dimensions of the two major ethnic groups of Sri Lanka: the Sri Lankan Sinhalese and Tamils. In addition to standard whole crown dimensions (mesiodistal and buccolingual), we report crown component dimensions (trigonid and talonid), which are considered to be potentially informative in quantifying aspects of qualitative morphological variation (e.g. Kondo et al., 1999a, b). We expect such data sets to be of importance in assessing populational differences in the nature and degree of dental size reduction.
We examined 60 dental plaster casts taken from 30 Sri Lankan Sinhalese and 30 Sri Lankan Tamil males who were students at the University of Peradeniya at Kandy in the central province of Sri Lanka. The subjects were 20–25 years old. The ethnicity of each individual was determined from university records and by confirmation from a three-generation pedigree for each individual. Individuals having normal occlusion (anatomical occlusion) were selected as subjects; a normal occlusion is defined as a condition in which each arch is bilaterally symmetrical, the anterior maxillary segment is slightly larger than the corresponding mandibular segment, and each maxillary tooth contacts its corresponding mandibular antagonist and its distal neighbor. Teeth were selected for measurement only if they were morphologically normal, not noticeably affected by attrition, caries, or restoration, and were fully erupted to the occlusal plane. Individuals with a history of orthodontic treatment were excluded. Dental impressions were taken using standard perforated trays and silicon impression material. Measurements were taken on the casts, which were made immediately in order to minimize effects of distortion. Teeth on the right side of the dental arch were measured using a digital caliper (recorded to the nearest 0.01 millimeter by R.P.). When a tooth on the right side could not be measured because of absence, abnormality, attrition, etc., the corresponding tooth on the left side was measured.
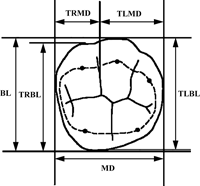
The measurements taken on the mandibular molar crown are shown in Figure 1. The mesiodistal and buccolingual crown diameters were obtained according to Fujita’s method (Fujita, 1949). In addition to these standard measurements, the mesiodistal (Yamada, 1992) and buccolingual (Kondo et al., 1998) crown diameters of the trigonid and talonid were also measured. Crown areas and indices were calculated as follows:
Trigonid area (TRA) TRMD × TRBL
Talonid area (TLA) TLMD × TLBL
Crown area (CrA) TRA + TLA
Talonid area percentage (TLA %) TLA/CrA × 100
Crown index (CrI) BL/MD × 100
Reduction index M2/M1 × 100
 View Details | Figure 1. Measurements of the mandibular molars. Abbreviations: BL, buccolingual diameter; MD, mesiodistal diameter; TLMD, mesiodistal diameter of the talonid; TRMD, mesiodistal diameter of the trigonid; TLBL, buccolingual diameter of the talonid; TRBL, buccolingual diameter of the trigonid. BL may at times coincide with TRBL or TLBL, although this is not always the case. |
The reduction index (Fujita, 1950) represents the size of the reduced tooth (M2) relative to the more stable tooth (M1). Statistical analysis was conducted first by testing for normal distribution of the linear variables and indices. When the distribution was normal, differences between the means were analyzed using the two-tailed Student’s t-test. Computer analysis was performed with the use of JMP statistical software (SAS Institute).
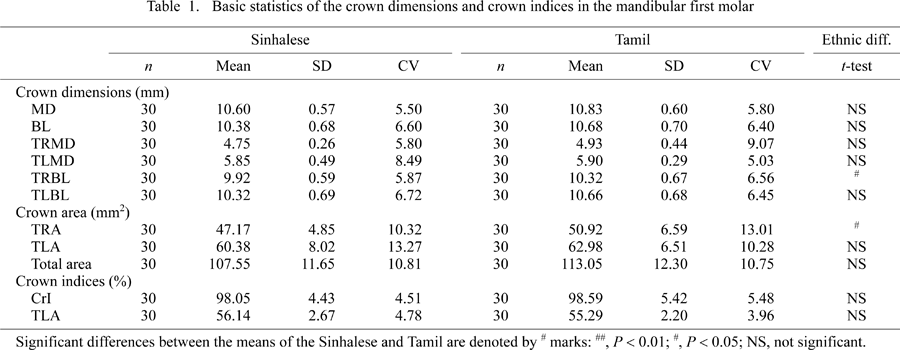
Table 1 and Table 2 show the basic statistics of crown dimensions, areas, and indices of the mandibular molars. Both M1 and M2 crowns were larger in Sri Lankan Tamils than in the Sinhalese in all measured dimensions. In addition, the size difference was more obvious in the M2 than in the M1. In the M1, statistically significant differences were seen between the Sri Lankan Sinhalese and Tamils only in trigonid breadth and area. In the M2, a larger degree of difference was seen in mesiodistal crown diameter and talonid length and area. Table 3 shows the reduction indices of the crown components. It can be seen that in both ethnic groups M2 size reduction is greatest in talonid length, and furthermore that this is exaggerated in the Sri Lankan Sinhalese.


Turning next to differences between M1 and M2, both ethnic groups exhibited a similar pattern. In all measured dimensions, M1 was larger than M2 except in trigonid length and area, which were significantly larger in the M2 (P < 0.01 in Sinhalese). Furthermore, crown dimensions tended to be more variable in the M2 than in the M1, especially talonid length. This finding is in accord with results of previous studies (e.g. Kondo et al., 1999a, 2001; Kondo and Townsend, 2004), and probably relates to the schedule of tooth development; M1 develops earlier than M2 and the trigonid is formed at an earlier stage of tooth crown development than the talonid [both ontogenetically (Kraus and Jordan, 1965) and phylogenetically (Osborn, 1907)].
The above differences in tooth size and proportions between the Sri Lankan Sinhalese and Tamils are likely to stem from the combined effects of genetic differences between the two populations (stemming from ancestral heritage), in spite of intermarriage between populations, and environmental and microevolutionary factors caused by differences in geographical location and cultural life style. In order to discuss the microevolutionary history of Sri Lankan Sinhalese and Tamils over the past 2000 years, a much larger body of data needs to be assembled from both modern and historic/prehistoric contexts.
In summary, the above brief odontometric comparison between the Sri Lankan Sinhalese and Tamils suggests that the Sri Lankan Sinhalese represent a population characterized by smaller mandibular molar crown dimensions and more advanced molar reduction than the Sri Lankan Tamils, and that such size variation and dental reduction are manifested most strongly in the later developing talonid component of the M2.
We are grateful to Professor Eisaku Kanazawa, Department of Anatomy and Physical Anthropology, Nihon University School of Dentistry at Matsudo and Dr Shintaro Kondo, Department of Oral Anatomy, Showa University School of Dentistry for their valuable suggestions on the manuscript. This study was supported by Grant-in-aid for Scientific Research from the University of Peradeniya, Sri Lanka. Finally we thank the editor-in-chief, Dr Gen Suwa, and other reviewers for their critical comments which greatly improved the manuscript.
|