| Hitoshi Fukase, corresponding author. e-mail: ss56419@mail.ecc.u-tokyo.ac.jp phone: +81-3-5841-2843; fax: +81-3-5841-8451 Published online 31 October 2006 in J-STAGE (www.jstage.jst.go.jp) DOI: 10.1537/ase.060329 |
Mandibles with fused symphyses, such as those of anthropoid primates, experience stress patterns different from those of most mammals, including prosimians, whose symphyses are not fused. The magnitude of stress that occurs during mastication tends to be greater in the fused symphysis, which acts as a bridge between the bilateral mandibular corpora, than in the unfused symphysis. A number of studies have addressed the relationship between skeletal shape and mechanical force, and particular attention has been paid to the mandibular symphysis of anthropoids (Beecher, 1977, 1979; Hylander, 1984, 1985, 1988; Ravosa, 1991; Daegling, 1992, 2001a; Ravosa and Hylander, 1994; Vinyard and Ravosa, 1998; Lieberman and Crompton, 2000). However, only a few studies have attempted to interpret the internal structure and bone distribution patterns of the human mandibular symphysis from a morphofunctional perspective (e.g. Daegling, 1993; Kanazawa and Kasai, 1998).
In considering the effects of mechanical load on bone morphology, it is important to acquire knowledge about the behavior of bone under load in the living body (Daegling and Hylander, 1997, 2000; Ravosa, 1999, 2000; Pearson and Lieberman, 2004). Unevenly distributed cortical bone, e.g. in the femoral neck of humans, or the mandibular posterior corpora of anthropoids, has been considered to be associated with unevenly distributed stress (Demes et al., 1984; Ohman et al., 1995, 1997; Lovejoy et al., 2002, 2005b; Daegling and Hotzman, 2003). In the mandibular posterior corpora, cortical bone is thicker buccally than lingually. Demes et al. (1984) explained this as a result of the combined effects of vertical occlusal force and torsion of the mandibular corpora. Recently, from in vitro experiments in human mandibles, Daegling and Hotzman (2003) demonstrated that, under these conditions, cortical strains in the mandibular corpus tend to be distributed as proposed by Demes et al. (1984).
According to Daegling (1993), referring mainly to the in vivo experiments with nonhuman primates performed by Hylander (1984), the primary sources of the stresses that occur at the symphysis during mastication can be summarized as follows: lateral bending in the transverse plane (wishboning), vertical bending in the coronal plane (vertical bending), and dorsoventral shear (Figure 1). Wishboning stresses are tensile on the lingual side and compressive on the labial side. Since anthropoid mandibles with fused symphyses are generally U-shaped, they can be modeled to function as curved beams. The curvature at the symphysis causes the lingual tensile stresses to be greater than labial compressive stresses (Hylander, 1984; Hylander and Johnson, 1994). Vertical bending results in tensile and compressive stresses along the base of the symphysis and in the alveolar process, respectively. The actual magnitude of stresses induced by bending depends on bone distribution patterns, including the external symphyseal contour and internal bone distribution. By contrast, symphyseal shape has little effect on resisting dorsoventral shear, while symphyseal cross-sectional area is important in this respect (Hylander, 1984; Daegling, 1993).
 View Details | Figure 1. Bending stresses in the human mandibular symphysis (after Daegling, 1993). Large arrows indicate the effects of masticatory muscle force. Small arrows indicate the types of stress acting at the symphysis. Tensile stresses are indicated by arrows pointing away from one another, and compressive stresses by arrows pointing towards one another. Top: lateral bending in the transverse plane (wishboning) resulting in compression on the labial and tension (not shown) on the lingual aspect of the symphysis. Bottom: vertical bending in the coronal plane resulting in compression in the alveolar region and tension at the symphyseal base. |
The difficulty of directly examining stress and strain in the living human mandible has resulted in a variety of indirect approaches, such as free-body analysis (Demes et al., 1984; Wolff, 1984), and, more recently, three-dimensional finite element analysis (3D FEA). The latter attempts to model stress under relatively complicated assumptions in order to give a closer approximation to in vivo conditions. In the computed tomography (CT)-derived finite element model of Korioth et al. (1992), material properties were assigned in relation to each tissue type (cortical bone, cancellous bone, enamel, dentin, fibrocartilage, and periodontium). In this analysis, stress distribution in the mandibular symphysis during unilateral biting was shown to be compressive at the labial aspect of the symphysis and tensile at its lingual aspect. The magnitude of tensile stresses was found to be highest along the lower lingual symphyseal surface, while the magnitude of compressive stresses increased superiorly along the labial surface. Such a pattern of stress can be explained from the combined effects of wishboning and vertical bending (Demes et al., 1984; Korioth et al., 1992). Other 3D FEA studies based on less sophisticated models (e.g. Ishida et al., 1988; Hart et al., 1992) also exhibited hypothetical stress patterns in accordance with the above-mentioned results. Thus, the FEAs appear to be largely in agreement with the stress patterns suggested from the in vivo nonhuman primate studies summarized above. However, the robustness of the FEA results is open to question, because of the uncertainty of boundary conditions and their potential effects (Hart et al., 1992; Marinescu et al., 2005).
From the perspective that mechanisms exist to optimize the stiffness of bone while minimizing fracture risk and bone mass, it is of interest to see the degree of correspondence between actual bone distributions and hypothetical stress patterns. If the correspondence is high, this can be considered as corroborative evidence for the hypothesis that human symphyseal bone distribution is functionally related to mechanical stress generated from maximum and/or habitual mechanical loads. The purpose of the present study is to investigate bone distribution patterns in the modern human mandibular symphysis, by use of a high-resolution microfocal CT scanning system, and then to make comparisons with the hypothesized patterns of stress summarized above.
The mandibles used in the present study are housed in the University Museum, The University of Tokyo. A total of 32 male Japanese mandibles were chosen for investigation. Their ages at death, according to the records, were between 20 to 40 years. The average age was 28.0 years old (SD = 5.9). Specimens were chosen to have a full complement of teeth, regardless of eruption of M3, and those with clear signs of disease or broken symphysis were excluded.
The cross-sectional geometry of the symphysis was obtained by use of the microfocal X-ray CT (TXS225-ACTIS, TESCO) system of the University Museum, The University of Tokyo. The CT imaging was performed at 130 kV, 0.2 mA, with a slice thickness of 140 μm. The sagittal and horizontal planes were defined by perpendicular acrylic plates juxtaposed to the mandibular base and posterior surfaces, respectively, of the condyles. The symphyseal midsagittal section was defined as the sagittal plane passing through the midpoint of the infradentale and pogonion (Figure 2). In order to avoid the mental spine on the lingual side, the symphyseal parasagittal section was similarly defined as the sagittal plane passing through the most superior corner of the alveolar process between left I1 and I2. Cross-sectional images were reconstructed in a 512 × 512 matrix with a pixel size of 140 μm.
 View Details | Figure 2. Slice positions of CT image. MS, the midsagittal section that passes through the midpoint of the infradentale and the pogonion; PS, the parasagittal section that passes through the superior-most corner of the alveolar process between left I1 and I2. |
The CT images were initially taken with the mandibular basal plane horizontal. For further analysis, the images were rotated so that the horizontal axis corresponded to the plane of the mandibular alveolar margin. This was done by (1) recording reference points along the alveolar margin at C/P1 and M1/M2 positions using a three-dimensional digitizer (MicroScribe-3D, Immersion Co.); (2) projecting these points onto the sagittal plane (averaging the right and left sides) to define the projected alveolar plane; (3) determining the angular relationship between the alveolar plane and the original horizontal axis of the CT images; and (4) rotating the sagittal CT images so that the alveolar plane became horizontal (Figure 3a, 3b). CT image processing and analysis was carried out using CT-Rugle software (Medic Engineering, Inc.).
 View Details | Figure 3. Raw CT image of the midsagittal section (a) and of the parasagittal section derived from the same specimen (b), and extracted bone area in the midsagittal section (c) of the human mandibular symphysis. The labial aspects are to the right. The symphyseal cross-section was divided into eight parts by nine horizontal lines that were equally placed. The mid-height level separates the symphysis into upper and lower halves. A line was drawn by connecting the two reference points (Id′ and Gn) and seven midpoints, thus dividing the symphyseal cross-section into lingual and labial portions. Overall, the symphyseal cross-section was subdivided into four quadrants: ULa, the upper labial quadrant; ULi, the upper lingual quadrant; LLa, the lower labial quadrant; LLi, the lower lingual quadrant. |
Although bone distribution patterns of the human mandible have been reported previously (Daegling and Grine, 1991; Kanazawa and Kasai, 1998; Masumoto et al., 2001; Schwartz-Dabney and Dechow, 2002, 2003), these were done without a quantitative assessment of cancellous bone. The strength and stiffness of cancellous bone is considered to be proportional to the square and cube, respectively, of its apparent density (Carter and Hayes, 1977; Currey, 1984, 2002). Therefore, small amounts of cancellous bone may contribute little to mechanical strength. However, a large degree of individual variation is known in the amount of cancellous bone in the mandible (Daegling, 1989). Therefore, in the present study, the bone area of the mandibular symphysis was taken to include the cancellous bone.
In the CT images of the symphyseal cross-section, air-bone boundaries were determined by the half-maximum-height method. Threshold values at the mid-CT value of air and bone were determined from arbitrary sampling near the outer cortical bone margin. Since the CT values of thin bone tend to be low due to the characteristics of CT scans, in some of the specimens, alveolar bone was not properly extracted. In such cases, thresholds were recalculated for the superior fourth portion of the symphysis.
The symphyseal cross-section was divided into eight parts by nine horizontal levels that were equally spaced as shown in Figure 3c. The mid-height level separates the symphysis into upper and lower halves. The superior-most point, or the midpoint between the superoanterior and superoposterior corners, of the alveolar process was defined as the upper reference point (Id′). The inferior-most point of the symphyseal contour was defined as the lower reference point (Gn). The midpoints between the labial and lingual outer margins were determined at each of the seven levels. A line was drawn by connecting the two reference points and seven midpoints, dividing the symphysis into lingual and labial halves. Thus, the symphyseal cross-section was subdivided into four quadrants: the upper labial, upper lingual, lower labial, and lower lingual sections (Figure 3c). The bone area and the ratio of bone area to total cross-sectional area (the bone index) were derived for each of the quadrants.
Cortical thickness of the symphysis was measured on the CT images in the following two ways. In method 1, the thickness of the midsagittal and parasagittal sections was measured at Gn and lingually and labially at the bottom six levels (Figure 4a). These positions are referred to as A1–A6, P1–P6, and Gn. Measurements were not taken in the upper quarter of the symphysis, because of considerable variation in alveolar configuration. Thickness was determined as the shortest distance at each level from the outer to inner margins of the cortical bone. Specimens that exhibited ambiguous borders between cortical and cancellous bone were excluded.
 View Details | Figure 4. Positions where symphyseal cortical thicknesses were measured by method 1 (a) and method 2 (b). In method 1, the positions were determined from equal divisions of symphyseal height. In method 2, the positions were determined in relation to anatomical reference points (see details in the text). Id′, the upper reference point; Gn, the lower reference point; Pg, pogonion; Ge, genion. |
In method 2, measurement positions were defined in relation to the anatomical reference points of the symphysis. The anterior-most point at the mental protuberance and the posterior-most point around the mental spine were defined as the pogonion (Pg) and the genion (Ge), respectively. The heights from the two anatomical reference points to the upper and lower reference points (Id′ and Gn) were each divided into three portions (Figure 4b). Cortical thickness was measured at these superoinferior levels. In the case of Ge, when this was located at the local extreme prominence of the mental spine in the midsagittal section, measurements were taken immediately below it.
Differences between the averages of two variables were evaluated by Wilcoxon’s signed rank sum test (two-sided test, significance level 5%).
The bone area and the ratio of bone area to total cross-sectional area (the bone index) are listed in Table 1 and shown as box-plots in Figure 5. The bone area values of the four quadrants of the midsagittal and parasagittal sections were ordered as follows: upper labial quadrant << upper lingual quadrant << lower labial quadrant < lower lingual quadrant. Significant differences were observed between all pairs of quadrants in both sections. The bone index values were ordered as follows: upper labial quadrant << lower labial quadrant < (or ≤) upper lingual quadrant < lower lingual quadrant. Compared with the bone area, the bone index of the upper lingual and lower labial quadrants were in reverse order. In the parasagittal section, significant differences were found between all pairs of quadrants, and this was also the case for the midsagittal section, except between the lower labial and upper lingual quadrants (P = 0.254). In terms of the bone area, the two lower quadrants displayed a distinctly higher value than the two upper quadrants, whereas for the bone index, the upper labial quadrant had a distinctly the low value. For both the both bone area and the bone index, the two lingual quadrants had larger values than the corresponding labial quadrants.
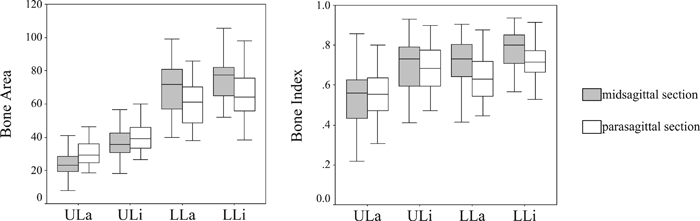 View Details | Figure 5. Bone area (left) and the bone index (right). Upper and lower margins of box plots represent the 75th and 25th percentiles, respectively. The median is the line bisecting the box. ULa, the upper labial quadrant; ULi, the upper lingual quadrant; LLa, the lower labial quadrant; LLi, the lower lingual quadrant. See Figure 3b for positional information on the quadrants. |
The cortical thickness values are listed in Table 1 and exhibited as line plots in Figure 6 and Figure 7. Figure 6 represents the cortical distribution obtained by method 1, where measured positions were chosen by equally subdividing symphyseal height. A peak of cortical thickness is seen at P5 and P6 in the midsagittal and parasagittal sections, respectively. In the midsagittal section, significant differences were observed between all adjacent pairs along the symphyseal contour except between A5 and A6 (P = 0.303), and in the parasagittal section, except between P3 and P4 (P = 0.083). When comparing lingual and labial thicknesses at the same level, e.g. between A1 and P1 or A2 and P2, lingual cortical bone was significantly thicker than the labial cortical bone at all superoinferior levels in both sections.
 View Details | Figure 6. Cortical distribution of the mandibular symphysis obtained by method 1. See Figure 4a for information on the measured positions. |
 View Details | Figure 7. Cortical distribution of the mandibular symphysis obtained by method 2. See Figure 4b for information on the measured positions. |
The results observed in the midsagittal section were substantially influenced by the presence of mental spine or bone substance deposited around the rudimentary symphyseal foramen. This explains why the lower quadrants in the midsagittal section had larger bone area than those in the parasagittal section, and why the peak of cortical thickness appeared around P5 in the midsagittal section.
Figure 7 represents the cortical distribution obtained by method 2, where measured positions were determined in relation to anatomical reference points. The results show that cortical bone was thickest immediately below the mental spine [Ge(3)] in both sections, and that a slight peak of thickness occurred at the mental protuberance (Pg) in the midsagittal section. Significant differences were observed between all adjacent pairs along the symphyseal contour, except between Ge and Ge(3) (P = 0.671) and Pg(3) and Pg(4) (P = 0.754) in the midsagittal section, and except between Ge(3) and Ge(4) (P = 0.329) and Pg and Pg(3) (P = 0.058) in the parasagittal section. The lack of a comparable labial peak in the results from method 1 (Figure 6) is probably due to individual variation in the superioinferior level of the pogonion.
In summary, it was found that bone substance was distributed in greater amounts on the lingual than on the labial side of the symphysis, both absolutely and relatively, and concentrated particularly at the lower lingual portion of the symphysis. In contrast, the upper labial portion of the symphysis had thin cortical bone, and overall a smaller amount of bone substance.
The primary purpose of this study was to quantitatively document the actual bone distribution patterns of the human mandibular symphysis using high-resolution CT scans. Some of the present results are different from those obtained by Schwartz-Dabney and Dechow (2003), who examined the symphyseal cortical thickness of the human mandible at three superoinferior levels (upper, middle, and lower levels). According to these authors, the cortical bone of the symphysis tended to be thicker at the lower levels, which is consistent with the current observation. However, Schwartz-Dabney and Dechow also found that lingual cortical bone was thinner than labial cortical bone at the upper and middle levels, which is opposite to the results of the present study. This discrepancy may be accounted for by differences in the age (and sex) profiles of the samples. Schwartz-Dabney and Dechow’s sample consisted of seven males and three females, with average ages of 64.3 years (SD = 11.7) and 62.0 years (SD = 17.1), respectively, while the present study used 32 adult male mandibles with an average age of 29.0 years (SD = 5.9).
In another comparative study, Kanazawa and Kasai (1998) reported results consistent with those of the present study. They compared the mandibular morphology of modern Japanese with that of the prehistoric Jomon. They showed that the lingual cortical bone was thicker than the labial cortical bone in both populations, although this was measured only at the mid-level of symphyseal height.
Wishboning of the mandible results in higher mechanical stresses at the symphysis lingually than labially (Ichim et al., 2006). A potentially effective way to counter this type of bending is to increase the labiolingual thickness of the symphysis, e.g. by an obliquely inclined symphysis or a developed superior transverse torus in nonhuman primates (Hylander, 1984; Ravosa, 1991; Daegling, 1992, 2001a). In contrast, the human mandibular symphysis is positioned approximately perpendicular to the long axis of the mandible, and lacks external structures such as those seen in the lingual aspect of nonhuman primates. It is thus thought to be structurally weak against wishboning loads. Daegling (1993) demonstrated that, compared with the mandible of apes and early hominids, the human mandible is short, but its width is not reduced. Such changes in mandibular shape should have resulted in a reduction of the wishboning stresses that occur at the symphysis, because of the shortening of the moment arm and a decrease in the degree of curvature at the symphysis. These factors lead us to regard the morphology of the human mandible as being largely unaffected by wishboning loads (Daegling, 1993; Ichim et al., 2006). However, the present study shows that internal bone substance was distributed unevenly, and was more concentrated on the lingual than on the labial side of the symphysis. This bone distribution is expected to reduce the stress gradients due to wishboning.
Daegling (1993) suggested that, because of the shape of the human mandible, the mechanical effect of vertical bending loads is probably relatively greater than that of wishboning loads in the human symphysis. Effective ways to counter vertical bending are to increase the height of the symphysis and to concentrate cortical bone along the lower border of the symphysis, e.g. to form an inferior transverse torus (simian shelf) (Hylander, 1985; Daegling, 2001a). Daegling hence hypothesized that, in the human mandible, which lacks a simian shelf, the chin structure is likely to represent a structural response to resist vertical bending stresses. The thick cortical bone near the symphyseal base observed in the present study may support his hypothesis. However, further discussion on the significance of the human chin, which has been controversial over many decades (see Schwartz and Tattersall, 2000; Dobson and Trinkaus, 2002), is beyond the scope of this paper.
The combined effects of wishboning and vertical bending should result in the greatest tensile stress along the lower lingual symphysis. This corresponds to the observed bone concentration at the lower lingual region of the symphysis, which indicates a possible relationship between bone distribution and stress gradients. Meanwhile, due to the same combined effects of wishboning and vertical bending, high compressive stresses should occur on the upper labial aspect of the symphysis (Korioth et al., 1992). On the labial aspect of the symphysis, however, cortical bone was found to be thinner at the upper levels and locally thick at the mental protuberance. In this regard, the observed bone distribution appears to contradict the hypothesized stress distributions.
Recently, various authors have warned against uncritically interpreting morphological characteristics of bone as an adaptation to mechanical stress. For instance, Lieberman et al. (2004) investigated the cross-sectional geometry of the limb bones of sheep, and showed that the orientation of the cross-sectional neutral axis differs substantially from the centroidal axis, i.e. the axis around which the bone offers maximum resistance to bending. This confirms the prediction (e.g. Lovejoy et al., 2003) that the neutral axis does not typically run through its cross-sectional centroid, and corroborates the hypothesis that cross-sections of bone do not always exhibit geometry consistent with their habitual loading environment. With the currently expanding knowledge of developmental biology, it has been suggested that it is patterning genes and their cis-regulatory elements, which modulate pattern formation, rather than mechanical loading history, that have the most influence on determining skeletal formation and shape (Lovejoy et al., 1999, 2002, 2003; Lovejoy, 2005a).
The relationship between local stress environments and skeletal formation seems highly complicated in the living body (e.g. Turner, 1998; Ehrlich and Lanyon, 2002; Pearson and Lieberman, 2004; Ruff et al., 2006). Furthermore, symphyseal bone distribution in the mandible might not largely depend on its loading history (Daegling, 2001a, 2001b). Nevertheless, the present results in part support the hypothesis that, in the human mandibular symphysis, there exists a functional linkage between bone formation and stress distribution.
I am grateful to Dr. Gen Suwa for the considerable advice he has given throughout this study and in the preparation of this manuscript, and to all members of the Morphological Anthropology laboratory of the University Museum, The University of Tokyo, for help throughout the various portions of this research. In particular, M. Chubachi assisted in the CT scanning operation, and S. Mizushima in processing of the CT data.