| * Correspondence to: Yuriko Igarashi, Department of Anatomy and Physical Anthropology, Nihon University School of Dentistry at Matsudo, 2-780-1, Sakae-cho Nishi, Matsudo 271-8587, Japan. E-mail: igarashi.yuriko@nihon-u.ac.jp Published online 14 November 2007 in J-STAGE (www.jstage.jst.go.jp) DOI: 10.1537/ase.050613 |
A mandibular torus is a bony protuberance on the lingual surface of the mandible, and is generally found in the premolar region above the linea mylohyoidea (Figure 1). It is an exostosis formed by hypertrophy of the compact bone and sometimes the spongy bone (Thoma and Goldman, 1960). Anthropologists have recognized the condition since the 19th century and have also noted frequency differences by sex and population.
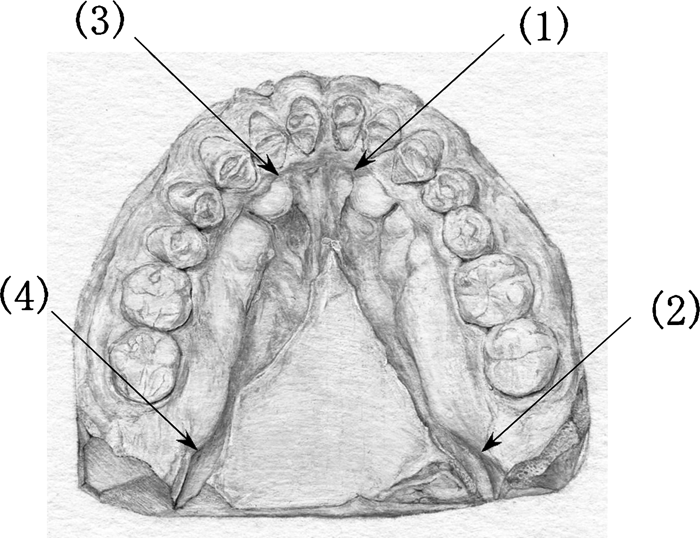 View Details | Figure 1. Mandibular tori. Mandibular tori are formed from a position opposite the second incisor to the retromolar area. (1) and (3) show the mesial end; (2) and (4) show the distal end. |
Previous studies showed that mandibular torus frequencies tend to be high (from 50 to 100%) in the ‘Frigid Zone’ populations, either of Asians (Hrdlicka, 1940; Moorrees, 1957; Ossenberg, 1981; Dodo and Ishida, 1987) or Europeans (Hrdlicka, 1940; Sellevold, 1980) (Appendix 1). However, in some Frigid Zone populations frequencies were not so high (from 3 to 40%), either in Asian (Duckworth and Pain, 1900; Moorrees, 1957; Mayhall, 1968; Mayhall and Mayhall, 1970; Mayhall et al., 1970; Jarvis and Gorlin, 1972) or in European populations (Mellequist and Sandberg, 1939; Axelsson and Hedegard, 1981; Eggen and Natvig, 1991; Haugen, 1992). Indeed, torus frequency tends to be low in European populations (except in the Frigid Zones), Black populations, South American Natives, and South Pacific populations; however, torus frequencies have mainly been examined in North Asian populations, and few studies have investigated other populations.
In order to clarify the geographical distribution of the mandibular torus, we must compare their exact frequencies in different populations across large regions. However, in previous studies, judgment standards for determining presence and degree of expression of tori were either not defined at all, or were based on subjective descriptive standards (Appendix 1). In some studies, tori were measured and classified by size (Hashim et al., 1983; Reihert et al., 1988; Eggen, 1989; Eggen and Navig, 1991; Kerdpon and Sirirungrojying, 1999; Sirirungrojying and Kerdpon, 1999; Sugihara et al., 2003). Even though torus classification by size might be more accurate than other subjective descriptive standards, measuring small tori is difficult unless they are measured in trimmed plaster casts, as done by Reichart et al. (1988). However, this method is rather laborious. Based on these circumstances, in the present study, we established a new descriptive torus classification system that reflects the degree of torus development. We then examined the types and the frequency of mandibular tori in present-day Japanese dental patients and students.
Another unsolved problem about mandibular tori is their causes. Geographical distribution patterns suggest that the occurrence of mandibular tori cannot simply be explained by genetic or environmental factors. Some previous studies emphasized genetic factors as the cause of tori formation, based on comparisons of torus frequencies in genetically different populations living in similar environments (Moorrees, 1957; Sellevold, 1980), or by examining torus incidences in families (Suzuki and Sakai, 1960; Johnson et al., 1963; Alvesalo and Kari, 1972). Ossenberg (1981) reviewed previously published data and concluded that a threshold model could more fully explain the trait’s phenotypic behaviors than a single gene model. Threshold characters were defined as having underlying continuous variables that are both genetic and environmental in origin with a threshold (Falconer and Mackay, 1996). Based on a threshold model, Eggen (1989) estimated the heritability of tori in Norwegians to be 30%.
Other studies have stressed environmental factors as the cause of tori. Some studies compared the prevalence of tori in populations in different environments and concluded that torus percentages were higher in people whose diets included coarser foods than in people with a softer diet (Hooton, 1918; Hrdlicka, 1940; Mayhall, 1970; Eggen and Natvig, 1991). Some studies isolated specific factors that affect the incidence of tori, such as parafunctional activities (clenching and grinding) (Kerdpon and Sirirungrojying, 1999), temporomandibular disorder (Sirirungrjying and Kerdpon, 1999; Sugihara et al., 2003), number of teeth (Ossenberg, 1981; Eggen and Natvig, 1986; Sugihara et al., 2003), presence of dental attrition (Taniguchi et al., 1999), presence of crowding (Takano, 2000), area of occlusion contact (Kamouchi et al., 2000), and bone mineral density (Hosoi et al., 2003).
Correlations between the development of tori and such factors as parafunctional activities and temporomandibular disorder have been epidemiologically examined in large samples. The frequencies of tori were shown to be significantly higher in patients with parafunctional activities (clenching and grinding) or temporomandibular disorder than in control groups (Kerdpon and Sirirungrojying, 1999; Sirirungrjying and Kerdpon, 1999). Correlations between number of teeth and development of tori were also examined in large samples (Ossenberg, 1981; Eggen and Natvig, 1986; Sugihara et al., 2003). However, conclusions differed among studies. Taniguchi et al. (1999) showed that tori were more common in groups with dental attrition than in groups without attrition. However, the correlation between the degree of dental attrition and the development of tori has not been examined. Correlations between the development of tori and such factors as crowding, the area of occlusal contact, and bone mineral density have been examined only in small samples.
Based on the above summarized situation, in the present paper, we selected the number of teeth, the degree of dental attrition, and the degree of crowding as environmental factors that could potentially affect the development of tori. We examined correlations between these environmental factors and torus development in the present-day Japanese.
Dental plaster casts of the mandibles and maxillae of present-day Japanese dental patients and students were used. The casts were collected from individuals who visited a particular dental clinic in Chiba Prefecture from 20 December 2004 to 5 August 2005 and allowed such casts of their mandibles and maxillae to be taken. Dental casts of students from different areas of Japan were collected between 1992 and 1997 from students of the Nihon University School of Dentistry at Matsudo who also allowed plaster casts of their mandibles and maxillae to be taken. This study gained the approval of the ethics committee at the Nihon University School of Dentistry at Matsudo (Certification No. EC02-027).
A total of 224 patient samples (118 males and 106 females) and 113 student samples (60 males and 53 females) were used. Table 1 shows the age distribution of the samples. The age of the male patients ranged from 13 to 77 years (average 50). For female patients, the age ranged from 15 to 81 years (average 49). The age of the male students ranged from 17 to 36 years (average 20). For female students, the age ranged from 18 to 29 years (average 19). These casts are stored at the Nihon University School of Dentistry at Matsudo.
The casts were observed and palpated under illumination from a portable light and without magnification. On every mandible, we counted the number of tori both on the left and right sides, and for each torus, we judged its class and position. We established four classes for grading mandibular tori (Figure 2):
 View Details | Figure 2. Types of mandibular tori. Class 0, no tori; Class 1, tori recognized only by palpation; Class 2, perceptible tori; Class 3, perceptible tori whose contour range is precisely determined. |
Class 0 denotes no tori recognized by palpation or perception.
Class 1 denotes a torus recognized only by palpation. A Class 1 torus is so low that no clear shadow is seen on the mandibular surface under light from any direction. The range contour of a torus was determined by palpation.
Class 2 denotes a perceptible torus high enough that clear shadows of it can be seen on the mandibular surface. However, since the range contour of a torus is not perceptibly determined in some parts, the torus was determined by palpation where it was not perceptible.
Class 3 denotes a perceptible torus whose range contour can be completely perceptibly determined.
An individual’s torus class was determined for both left and right sides. Torus class was scored separately for all tori present, and the maximum of those scores was considered the torus class of that individual. We recorded the position of each torus as follows. We defined the mesial end of a torus by the tooth above the mesial end of the range contour of the torus, and we defined the distal end of a torus by the tooth above the distal end of the range contour of the torus. Torus position was represented by the series of teeth spanning the mesial to distal end of the torus. The length of each torus was defined as the number of teeth from the mesial to distal end of the torus. The size of each torus was defined as the product of the class of torus and its length. The size of an individual’s torus was determined for both left and right sides. Torus size was calculated separately for all tori present, and the sum of those sizes was considered the size of that individual.
The distribution of torus positions in a group (patients or students) was defined for the left and right sides as follows. For every tooth, the percentage of individuals in that group who possessed tori below that tooth was calculated. The distribution of torus positions was defined as the series of percentages from the first incisor to the distal-most molar on that side.
The number of an individual’s teeth was defined as the number of teeth present on the maxilla and mandible. The degree of an individual’s crowding was calculated as follows. First, the number of malpositioned teeth was counted. Malposition includes mesioversion, distoversion, labioversion, buccoversion, linguoversion, torsiversion, axiversion, supraversion, infraversion, and transversion. The degree of crowding of an individual was calculated by dividing the number of malpositioned teeth by the number of observed teeth.
The degree of dental attrition of an individual was defined as follows. Dental attrition was observed at multiple positions (or spots) on each tooth. A total of 106 spots in the maxillary and 118 spots in the mandibular dentition were examined: 5 spots with the incisors and canines, 7 spots with premolars, 8 spots with the maxillary molars, and 10 spots with the mandibular molars (Figure 3). At each spot, the amount of dental attrition was classified into four categories: Class 0 denotes no attrition; Class 1 denotes attrition on enamel; Class 2 denotes attrition exposing dentine; and Class 3 denotes attrition exposing pulp. In incisors, usually, a small spot of Class 1 attrition first appeared on the edge. In other cases, another spot appeared on the labial or lingual surfaces. When attrition areas were small, they were separated from each other (Figure 4a). In that case, the amount of dental attrition between the edge and the labial surface and between the edge and the lingual surface was judged to be Class 0. When attrition progressed, attrition areas widened and often joined each other. In such cases, the amount of attrition between the edge and the labial or lingual surfaces was judged to be Class 1, 2, or 3 (Figure 4b). In premolars, usually, small spots of Class 1 attrition first appeared on the apices of cusps. In that case, the amount of dental attrition between the buccal cusp and buccal surface, between the lingual cusp and lingual surface, and between the buccal and lingual cusps was judged to be Class 0. When attrition advanced, attrition areas often joined each other. In such cases, the amount of attrition between the buccal cusp and buccal surface, or between the lingual cusp and lingual surface, or between the buccal and lingual cusps was judged to be Class 1, 2, or 3. In molars, usually, small spots of attrition first appeared on the apices of the cusps. In such cases, the amount of dental attrition between cusps was judged to be Class 0. When attrition progressed and attrition areas joined each other, the amount of dental attrition between cusps was judged to be Class 1, 2, or 3 (Figure 4c). The degree of dental attrition of an individual was calculated by dividing the total sum of scores of dental attrition of all observed spots by the number of observed spots. Computer analysis was performed with an SAS Institute Inc. (SAS) statistical package.
 View Details | Figure 3. Positions (spots) where dental attrition was observed. (a) Incisor: 1, labial surface; 2, area between incisal edge and labial surface; 3, incisal edge; 4, area between incisal edge and lingual surface; 5, lingual surface. (b) Canine: 1, labial surface; 2, area between incisal edge and labial surface; 3, incisal edge; 4, area between incisal edge and lingual surface; 5, lingual surface. (c) Premolar: 1, buccal surface; 2, area between buccal cusp and buccal surface; 3, buccal cusp; 4, area between buccal and lingual cusps; 5, lingual cusp; 6, area between lingual cusp and lingual surface; 7, lingual surface. (d) Molar: 1, mesiobuccal cusp; 2, area between mesiobuccal and distobuccal cusps; 3, distobuccal cusp; 4, area between distobuccal and distal cusps; 5, distal cusp; 6, area between distal and distolingual cusps; 7, distolingual cusp; 8, area between mesiolingual and distolingual cusps; 9, mesiolingual cusp; 10, area between mesiolingual and mesiabuccal cusps. |
 View Details | Figure 4. Examples of dental attrition. (a) Dental attrition on the incisal edge and lingual surface was Class 1, that on the other spots was Class 0. (b) Dental attrition on the incisal edge, lingual surface, and area between the incisal edge and the lingual surface was Class 2, that on the other positions was Class 0. (c) Dental attrition on the mesiobuccal cusp to distal cusps was Class 2; attrition on the distolingual and mesiolingual cusps, area between distal and distolingual cusps, and area between mesiolingual and mesiobuccal cusps was Class 1; and attrition at the area between the mesiolingual and distolingual cusps was Class 0. |
In patients and students, there were no statistically significant differences in the distribution of torus classes between the left and right sides or between males and females (Table 2). Therefore, in students and patients, sexes were combined, and we used the right side data in the following analyses.
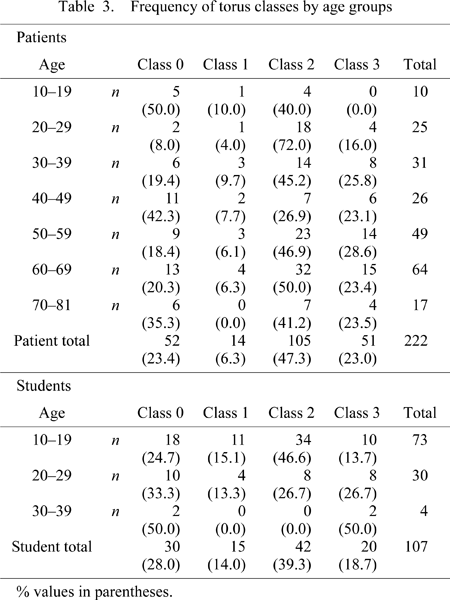
Table 3 shows the frequencies of tori class by age groups. In all the age groups of patients, Class 2 had the highest percentage (47.3%). Palpable tori (Classes 1, 2, and 3) were found in 76.6% and perceptible tori (Classes 2 and 3) in 70.3% of the patients. In all the age groups of students, Class 2 had the highest percentage (39.3%). Palpable and perceptible tori were observed in 72.0% and 58% of students, respectively. The frequencies of perceptible tori (Classes 2 and 3) were significantly higher in the patients than in the students (Table 3, Table 4). The frequencies of palpable tori (Classes 1, 2, and 3) were higher in the patients than in the students, but this difference was not statistically significant (Table 3, Table 4). The distribution of torus classes was not significantly different between patients and students (Table 4).
 View Details | Table3 |

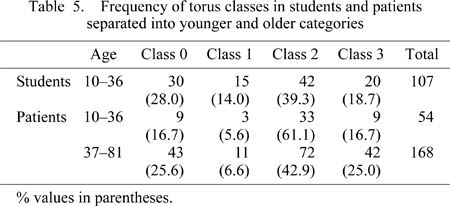
Since the age range of patients was wider than students, the patient population was divided into two groups: young (13–36 years old) and old (37–81 years old) (Table 5, Figure 5). The younger group’s age range resembled that of the students. The frequencies of perceptible tori (Classes 2 and 3) were significantly higher in the young patients than in the students (Table 4, Table 5, Figure 5). The frequencies of palpable tori (Classes 1, 2, and 3) were also higher in the young patients than in the students, but this difference was not statistically significant (Table 4, Table 5, Figure 5). There were statistically significant differences in the distribution of torus classes between students and young patients (Table 4, Table 5, Figure 5).
 View Details | Figure 5. Distribution of torus classes in the student and patient groups. |
In the patient population, the frequencies of palpable and perceptible tori were significantly higher in people in their twenties than in their teens (palpable tori, Fisher’s exact test: P = 0.012; perceptible tori, Fisher’s exact test: P = 0.0074) (Table 3, Figure 6). In the age range from 30 to 81, however, there was no clear age-related change of frequencies of palpable or perceptible tori. Class 3 tori appeared in subjects in their twenties and increased with age to their fifties. Overall, Table 3 and Figure 6 show that the frequencies of palpable, perceptible, and Class 3 tori increased in people from their teens to their twenties, and the frequency of Class 3 tori kept increasing with age to their fifties.
 View Details | Figure 6. Distribution of torus classes in patients by age groups. |
Only four students were in their thirties, so torus frequencies were compared between the younger student (teens) and older student age groups (twenties and thirties). In the younger student age group, Classes 0, 1, 2, and 3 were 24.7%, 15.1%, 46.6%, and 13.7%, respectively. In the older student age group, Classes 0, 1, 2, and 3 were 35.3%, 11.8%, 23.5%, and 29.4%, respectively. Differences in the distributions of torus classes between student age groups were not significant (χ2 = 7.3193, df = 3, P = 0.0624).
In patients and students, there were no significant differences in the distribution of torus positions between the left and right sides and between males and females (Table 2). Therefore, in patients and students, the sexes were combined, and we used the right side data in the following analyses.
Table 6 and Figure 7 show the position distributions of tori. In patients, tori were most frequently found below the first premolar, next most frequently below the second premolar, and then below the canine. In students, tori were most frequently found below the second premolar, next most frequently below the first premolar, and then below the canine. The difference in the distribution of torus positions between patients and students was not significant (Table 4). In young patients, tori were most frequently found below the second premolar, next most frequently below the first premolar, and then below the canine. The difference in the distribution of torus positions between young patients and students was not significant (Table 4).
 View Details | Figure 7. Distribution of torus position in the student and patient groups. |

In both the patient and student populations, there were no significant differences in the size of an individual’s torus between males and females (Table 2). In the student population and male patients, there were no significant differences in torus size between the left and right sides (Table 2). However, in female patients, there was a statistically significant difference in the values between the left and right sides. Therefore, in the following analyses, the sexes were combined in patients and students, but not the right and left sides.
Torus size was larger in the patients than in the students (Table 7); however, the differences between patients and students, and between young patients and students, were not significant (Table 4).
The average numbers of teeth of an individual were higher in students than in patients (Table 7), and the differences between patients and students, and between young patients and students, were significant (Table 4). The average degree of crowding was highest in the young patients and lowest in the entire patient population (Table 7); however, the differences between patients and students, and between young patients and students, were not significant (Table 4). The average degree of dental attrition was similar in the patients and the students, and lower in the young patients (Table 7). The difference between the young patients and students were significant (Table 4).
Correlation coefficients were calculated between two items among the following: class and size of tori, number of teeth, degree of crowding, dental attrition, and age. In students, patients, and young patients, there were significant correlations between torus class of right and left sides, between torus size of right and left sides, and between torus class and size (Table 8, Table 9, Table 10). In students (Table 8), torus class and size of the right side exhibited a significant negative correlation with the degree of crowding, and torus size showed a significant positive correlation with degree of dental attrition. In patients (Table 9), no environmental factors showed a significant correlation with torus class or size. In young patients (Table 10), torus class and size of the right side exhibited significant positive correlations with age.
 View Details | Table8 |
 View Details | Table9 |

The age range of patients was wide, so we calculated correlations between torus class and size and environmental factors in several age groups, in age ranges in multiples of 10 (10, 20, 80, etc.). As a result, in some age groups, age, number of teeth, degree of crowding, and degree of dental attrition showed significant correlations with torus class or size. The degree of crowding was negatively correlated to the size of left tori only in the age range from 70 to 81 (Spearman’s rank correlation coefficient = −0.50964, n = 16, P = 0.0437).
Age correlated positively with torus class in the age ranges 10–29, 40–59, and 50–59 (Appendix 2a). From 20 to 49, age showed a negative correlation with torus class (Appendix 2a). It is obvious that torus class correlated positively with age in the ranges 10–29 and 40–59, because in these age ranges, the frequencies of palpable, perceptible, and Class 3 tori increased with age (Figure 6).
Age correlated positively with torus size in the age ranges 10–29, 10–59, and 40–59 (Appendix 2a). In these ranges, the frequencies of Class 3 tori increased with age (Figure 6), suggesting that the increase of torus size was accompanied by an increase in the torus class. In the subjects in their sixties and seventies, age did not correlate with torus class or size (Appendix 2a).
The results in Appendix 2a, which support the results in Figure 6, also show that the frequencies of palpable, perceptible, and Class 3 tori increased in people in their teens and twenties, and torus size continued to develop from their teens to the fifties; further development was not seen in their sixties and seventies.
The degree of dental attrition correlated positively with torus class and size in the age ranges 30–59 and 40–69 (Appendix 2b). In these age ranges, there were no significant correlations between degree of dental attrition and age. Thus, the degree of dental attrition correlated positively with torus class and size independently of age. In the age range 50–69, the degree of dental attrition correlated positively with torus class, and there was no significant correlation between degree of dental attrition and age, i.e. the degree of dental attrition correlated positively with torus class independently of age. In the age range 40–59, the degree of dental attrition correlated positively with torus size, and there was no significant correlation between degree of dental attrition and age, i.e. the degree of dental attrition correlated positively with torus size independently of age. In the age ranges 10–59, 10–69, 20–69, and 30–69, dental attrition correlated positively with torus class or size, and in these age ranges, age also correlated positively with dental attrition. In summary, Appendix 2b shows that degree of dental attrition correlated positively to torus class and size independently of age mainly in individuals under the age of 70.
The number of teeth correlated positively with torus class or size in the age ranges 20–49, 20–79, 20–81, 30–49, 30–69, 30–79, and 30–81 (Appendix 2c). In these age ranges, the number of teeth correlated negatively with age. Considering that tori develop with age, these results (Appendix 2a, Appendix 2c) indicate that number of teeth correlated positively with torus class and size.
Since torus frequency might be affected by judgment standards and the nature of the samples, the torus frequencies calculated in the present study is tentatively compared with those of the other studies.
In the present study, 76.6% of patients and 72.0% of students had palpable tori. In previous studies, palpable torus frequencies in Japanese ranged from 38% to 52% (Sakai, 1954; Suzuki and Sakai, 1960); these values were derived from examinations of living populations. One possible explanation for this discrepancy could be that the incidence of palpable tori has increased in the present-day Japanese. At the same time, differences might also result from the different materials that were examined. Since we used plaster casts, we could take more time to examine the materials than researchers who examined the mandibles of living people. Perhaps we were able to discover small protuberances overlooked in the examinations of living people.
In the present study, 70.3% of patients and 58.0% of students had perceptible tori. In previous studies, frequencies of a perceptible torus in Japanese ranged from 14% to 34% (Hrdlicka, 1940; Dodo, 1974; Mouri, 1976; Dodo and Ishida, 1987), from examinations of skeletal materials. Taniguchi et al. (1999) using the plaster casts of Japanese dental students, showed that the frequency of a perceptible torus was 49%. Sugihara et al. (2003) showed that 56% of Japanese had perceptible tori based on examination of a company’s employees. The frequencies were highest in the present study, and the more recent the study, the higher are the values. There is a possibility that perceptible torus prevalence has increased in the present-day Japanese. At the same time, difference in judgment standards must also have influenced the results. Based on our standards, we judged tori as perceptible if only clear shadows could be seen on the mandibular surface.
We detected no statistically significant differences in the distribution of torus classes and positions by sex. These results resemble those of Muller and Mayhall (1970), Schaumann et al. (1970), Mouri (1976), Sellevold (1980), and King and King (1981). Some studies showed that frequencies were significantly higher in males than in females (Alvesalo and Kari, 1972; Volchansky, 1986; Reichert et al., 1988; Eggen and Navig, 1991; Haugen, 1992; Sugihara et al., 2003). Other studies showed that frequencies were significantly higher in females than in males (Austin et al., 1965).
In the present study, tori were seen in teenagers in both patient and student groups. In most populations, tori have been recorded in teenagers (Kolas et al., 1953; Moorrees, 1957; Austin et al., 1965; Levesque, 1965; Mayhall and Mayhall, 1970; Mayhall et al., 1970; Bernaba, 1976; Reichart et al., 1988; Eggen and Natvig, 1991; Haugen, 1992; Kerdpon and Sirirungrojying, 1999), but not in the Schaumann et al. (1970) study.
The mode of age change varies according to study. In our study, in the patient group, torus frequencies increased in the subjects’ teens and twenties, and torus size kept increasing from their teens to their fifties; further development was not seen in their sixties and seventies. Other studies showed a pattern for prevalence to be highest in the medium age groups, mainly from their thirties to the fifties (Austin et al., 1965; Kerdpon and Sirirungrojying, 1999). In the present study, samples were also divided into three age groups: 10–29, 30–59, and 60–81. However, there was no clear tendency in the age change of torus frequencies; the distributions of torus classes were not significantly different among age groups (χ2 = 5.8892, df = 6, P = 0.4357). The results of the present study resemble those of the former studies where general prevalence was highest in the middle age group. In other populations, frequencies kept increasing with age until an age of over 60 years old (Moorrees, 1957; Mayhall and Mayhall, 1970; Mayhall et al., 1970).
Miyashita (1935) showed that in the Chinese, the highest point of the torus was most frequently placed between the first and second premolars. In the present study, in the patients, tori were most frequently found below the first premolar and next most frequently below the second premolar. In the students, tori were most frequently found below the second premolar and next most frequently below the first premolar. These results do not contradict Miyashita’s results (1935).
Taniguchi et al. (1999) examined dental attrition on molars and defined a flat area on a cusp as dental attrition. They found that tori were more common in groups with, than without, dental attrition. In the present study, in the students, torus size showed a statistically significant positive correlation with degree of dental attrition. In the patients, torus class and size correlated positively with the degree of dental attrition indpendently of age, mainly under 70 years old. Thus, the results of the present study support the findings of Taniguchi et al. (1999). A high degree of dental attrition is an indication that the teeth and mandible had suffered considerable masticatory stress. Therefore, these results suggest that masticatory stress is a cause of torus development.
Ossenberg (1981) found that torus frequencies were correlated with the frequencies of adults whose anterior teeth were lost antemortem. On the other hand, Eggen and Natvig (1986) found that dental patients with tori had more teeth than those without tori. Sugihara et al. (2003) found that the frequency of tori was higher in groups with more healthy teeth than in those with fewer teeth. Teeth could transmit masticatory stress from the tooth crowns to the mandibular bone. If masticatory stress promotes torus development, the number of teeth might be positively correlated to torus development. In the present study, the number of teeth exhibited a statistically significant correlation with torus class and size. Therefore, the results of the present study suggest that masticatory stress promotes torus development.
Takano (2000) suggested that crowding in canines and premolars was related to the occurrence of tori. In the present study, however, in the students and patients in the age range 70–81, torus class and size exhibited a statistically significant negative correlation with degree of crowding. Our results might be statistically more accurate than those of Takano (2000) because the sample sizes were 106 in the present study versus only 13 in Takano (2000). Masticatory force acting on teeth might be more dispersed on a dental arch with crowding rather than without crowding. In other words, masticatory stress transmitted to the mandible per unit area might be weakened by crowding. If true, the present study’s result that crowding arrests torus development suggests that masticatory stress promotes torus development.
The present study’s results that torus class and size are correlated positively with degree of dental attrition and number of teeth, and negatively with degree of crowding, support the hypothesis that torus development is accelerated by masticatory stress. Other studies also support this hypothesis. Based on the deformation of teeth by weighting, Nakazawa (1997) concluded that tori were formed by compressive stress on the lingual surface of the mandible in mastication. Kamouchi et al. (2000) showed that the area of occlusal contact was larger in the group with tori than without. Since a large area of occlusal contact might indicate that large masticatory stresses can be exerted on the teeth, this result also supports the proposition that masticatory stress could be a cause of torus development.
Needless to say, masticatory stress cannot be the only cause of tori. In the patients of the present study, tori developed with age until their fifties, perhaps on account of other age-related factors. The frequency of perceptible tori was significantly higher in the patients than in the students (Table 3, Table 4, Table 5); however, the degree of dental attrition was significantly lower in young patients than in the students (Table 4, Table 7), implying that factors other than masticatory stress are also related to torus development. By examining the bone mineral density of Japanese female patients, Hosoi et al. (2003) found that individuals with mandibular tori had higher femoral bone mineral density than individuals without tori.
To clarify the influences of environmental factors on torus development, it is necessary to consider some other environmental factors that we did not examine in this study, such as the area of occlusion contact, bone mineral density, and histological and biomechanical structure of the mandible. At the same time, we have to examine the heritability of tori in recent Japanese.
We would like to thank the patients and students who allowed plaster casts to be made, and T. Ebihara of the Nihon University School of Dentistry at Matsudo for drawing the schematic mandibular tori shown in Figure 1. This work was supported by a grant-in-aid for scientific research from Japan Society for the Promotion of Science (No. 15570198).
|