| Tomohito Nagaoka, corresponding author. e-mail: nagaoka@marianna-u.ac.jp phone: +81-44-977-8111; fax: +81-44-976-3740 Published online 14 November 2007 in J-STAGE (www.jstage.jst.go.jp) DOI: 10.1537/ase.070605 |
Determining the sex of human skeletal remains using the skull is important to the disciplines of human osteology, forensic anthropology, paleopathology, and paleodemography, because the pelvis is not always available for examination and diagnosis. However, it is more difficult to sex a skeleton with the skull than with the pelvis. The accuracy of sex classification is more than 95% using the adult pelvis (e.g. Phenice, 1969; White and Folkens, 2000; Bruzek, 2002), but about 80% with the adult skull (e.g. Stewart, 1948).
Determination of sex using adult skulls depends on the large size and robustness of male skulls relative to those of females. For example, male crania have better developed supraorbital ridges, broader palates, and thicker zygomatic and larger mastoid processes than those of females (e.g. Ubelaker, 1989; Brothwell, 1981; Krogman and Iscan, 1986; Mays, 1998; White and Folkens, 2000). Numerous previous studies have pointed out that the mastoid process is a useful cranial region for diagnosing sex (e.g. Hoshi, 1962; Krogman and Iscan, 1986; Demoulin, 1972; Ubelaker, 1989; Stewart, 1979; Workshop of European Anthropologists, 1980; Brothwell, 1981; Krogman and Iscan, 1986; Nakahashi and Nagai, 1986; Mays, 1998; White and Folkens, 2000; Nagaoka and Hirata, 2005; Rogers, 2005). Hoshi (1962) showed that the direction of the tip of the mastoid process is sexually dimorphic; that is, it tends to be vertical in the male and pointed inward in the female. Demoulin (1972), who examined sexual dimorphism in cranial measurements, demonstrated that the mastoid region is one of the most dimorphic traits. Therefore, the mastoid region can be considered important in the diagnosis of sex from both macroscopic observational and osteometric perspectives.
The osteometrics of the mastoid process have been employed by Keen (1950), and developed by Giles and Elliot (1963), Vallois (1969), Demoulin (1972), Howells (1973), Nakahashi and Nagai (1986), and Nagaoka and Hirata (2005). Discriminant function analysis allows us to provide a new criterion for sex assessment of human skeletal remains because of its objectivity and simplicity. However, few criteria have been outlined for the determination of sex of ancient Japanese skeletons using the mastoid process (Nakahashi and Nagai, 1986; Nagaoka and Hirata, 2005), and no prior attempts have been made to examine measurement errors.
The purpose of this study is to develop new standards for the determination of the sex of fragmentary human skeletal remains using the mastoid process. First, we measured the mastoid processes of ancient Japanese skeletons from the medieval to early modern periods; second, we constructed a metric basis for the diagnosis of the sex of these skeletons; third, we examined intra- and interobserver errors in the mastoid process measurements; finally, we assessed whether or not the osteometric approach provides a useful criterion for sex assessment of fragmentary human skeletal remains.
The materials are comprised of human skeletal remains from the Yuigahama-minami and Hitotsubashi sites (Figure 1).
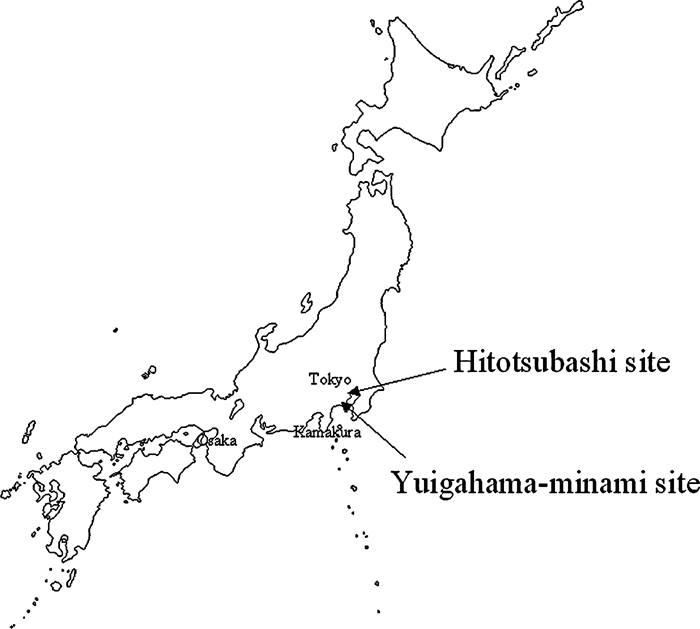 View Details | Figure 1. Map of Japan. |
The Yuigahama-minami site is located along the seashore of the southern end of Kamakura city. Kamakura is an ancient capital where a military government, the Kamakura Shogunate, was established in the 12th century. The excavation of the Yuigahama-minami site was undertaken between 1995 and 1997, and yielded skeletons from the late 14th century layer. The sample size of the site is 22 males and 26 females. The specimens belong to the Department of Anatomy, St. Marianna University School of Medicine.
Excavation of the Hitotsubashi site, undertaken in 1975, yielded graves dating from 1657 to 1683. The Hitotsubashi site is located in Edo city (now Tokyo), where a military government, the Edo Shogunate, was established at the beginning of the 17th century. They represented townsmen, known from the fact that the largest proportion of the graves contained wooden coffins (hayaoke) that were often used for the lower social classes. During the early modern period, the social structure was stratified with samurai at the top, then farmers, and finally townsmen (artisans and merchants) at the bottom. The sample size of the site is 28 males and 11 females. These specimens also belong to the Department of Anatomy, St. Marianna University School of Medicine.
This study used adult individuals about 18 years of age and older. The age at death was estimated using chronological metamorphosis of the auricular surface of the ilium (Lovejoy et al., 1985), tooth eruption and development (Ubelaker, 1989), and the degree of ossification and epiphyseal union of the pelvis and long bones (Brothwell, 1981).
The sexes of the samples were determined based on macroscopic assessment of the pelvis and long bones. Dimorphic criteria of the pelvis include the greater sciatic notch, preauricular sulcus, ventral arc, subpubic concavity, and medial aspect of the ischiopubic ramus (Genovés, 1959; Phenice, 1969; Houghton, 1974; Workshop of European Anthropologists, 1980; Bruzek, 2002). Sexual dimorphism of long bones includes their robustness, which provides clues for sex determination (Workshop of European Anthropologists, 1980). These methods provide a sex diagnosis with more than 95% accuracy. This study analyzed the differences between sexes.
This study measured six items including two newly employed ones. The left side of each skeleton was chosen. If the left side could not be used, then the right side was examined. Specimens with abnormalities and pathological changes were excluded. Measurements were taken twice by the first author (T.N.) using a digital caliper (Mitutoyo NTD12P-15C) and averages were used for analyses. The definitions of the items are as follows.
Mastoid height 1 (MH1)
The height of the mastoid process measured from its tip to the midpoint between the porion and the posterior end of the incisura mastoidea (this study) (Figure 2).
 View Details | Figure 2. Measurement of mastoid height 1. |
Mastoid height 2 (MH2)
The height of the mastoid process from its tip to the Frankfort plane. The measurement is perpendicular to the Frankfort plane (Keen, 1950; Giles and Elliot, 1963; Vallois, 1969; Demoulin, 1972; Howells, 1973) (Figure 3).
 View Details | Figure 3. Measurement of mastoid height 2. |
Mastoid height 3 (MH3)
The height of the mastoid process measured along the process itself. The axis of the mastoid process is determined as follows. First, a line, AB in Figure 4, is drawn from the posterior end of the incisura mastoidea to the nearest point on the posterior border of the external auditory meatus, then the axis of the mastoid process is determined as a line which passes through the midpoint of line AB and reaches the tip of the mastoid process (Nakahashi and Nagai, 1986) (Figure 4).
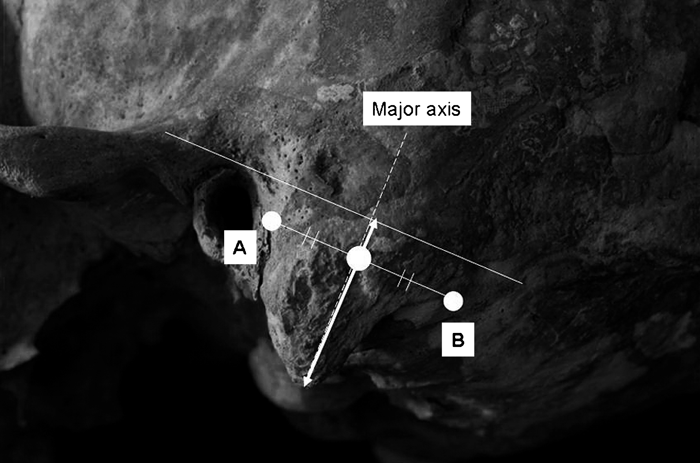 View Details | Figure 4. Measurement of mastoid height 3. |
Mastoid width (MW)
The width of the mastoid at its base from the incisura mastoidea to a corresponding level on the external surface of the process, transversely with reference to the process itself and perpendicular to the incisura mastoidea (Howells, 1973; Nakahashi and Nagai, 1986) (Figure 5).
 View Details | Figure 5. Measurement of mastoid width. |
Mastoid length 1 (ML1)
The length of the mastoid process measured from the porion to the posterior end of the incisura mastoidea (this study) (Figure 6).
 View Details | Figure 6. Measurement of mastoid length 1. |
Mastoid length 2 (ML2)
The length of the mastoid process measured from the porion to the asterion (Demoulin, 1972) (Figure 7).
 View Details | Figure 7. Measurement of mastoid length 2. |
After using Student’s t-test to distinguish between the male and female mean values for each variable, direct discriminant function analysis was performed. In the discriminant function analysis, Wilks’ lambda, eigenvalue, canonical correlation, and percentage of correct classification were quoted in assessing the relative validity of discriminant functions. Low values of Wilks’ lambda, high values of eigenvalue, canonical correlation, and percentage of correct classification are associated with excellent discriminant functions. Discriminant functions were calculated with each single variable, and also with two variables that show low Wilks’ lambda, high eigenvalue, high canonical correlation, and high percentage of correct classification. The combination of two variables does not include the same dimensions of variables: that is, MH1 and MH2, MH1 and MH3, MH2 and MH3, or ML1 and ML2. Here, multivariate functions with more than three variables are not used, because they usually require well-preserved skeletons and lack simplicity. The statistical procedures were computed with the statistical package SPSS for Windows 13.0J (SPSS Inc., 2005).
This study examined intra- and interobserver errors in mastoid process measurements. The materials for the analysis consisted of ten adult skulls from the Hitotsubashi site. This analysis included both sexes (five individuals for each sex) in the materials, as the sexes of the excavated skulls were unknown before the measurements were taken.
Six observers independently measured the mastoid processes twice within four months using the same digital calipers (Mitutoyo NTD12P-15C). Four of the six observers are skillful physical anthropologists and two are anatomists with no craniometric experience. All the observers were instructed on the definition of the measurement before starting. Two-way analysis of variance (ANOVA) with replication was used and the variance components were expressed as percentages of the sum of the variances (Sokal and Rohlf, 1995). We regard skulls or observers as random samples drawn from a larger size of samples. Therefore, a random effect model is the most appropriate model in this analysis. The nested ANOVA is an inappropriate method in this study, because the method does not describe the interaction between observers and skulls. The interaction between skulls and observers addresses whether the variation of the skulls has an effect on the measurement errors of each observer. The error analyses were performed for four skillful anthropologists, and also for six observers including both anthropologists and non-anthropologists. The statistical procedures were computed with the statistical package SPSS for Windows 13.0J (SPSS Inc., 2005).
Table 1 shows the basic statistics and the discriminant functions calculated with each single variable for Yuigahama-minami, Hitotsubashi, and the total of them together. The male variables for Yuigahama-minami, Hitotsubashi, and the total of them are larger than the female ones. All the variables, with the exception of Hitotsubashi’s ML1 and ML2, show significant differences between sexes at the 1% level. The most sexually significant variable is MW; ML2 a less dimorphic variable. The width and height of the variables tend to be more sexually dimorphic than the length.
The best function of Yuigahama-minami is obtained by MW, which shows the lowest Wilks’ lambda (0.492), the highest eigenvalue (1.032), the highest canonical correlation (0.713), and the highest percentage of correct classification (87.5%). The second best function is obtained by MH1. On the other hand, the function produced by ML2 shows far less classification capacity, as the function includes the highest Wilks’ lambda (0.847), the lowest eigenvalue (0.180), the lowest canonical correlation (0.391), and the lowest percentage of correct classification (66.7%). In Hitotsubashi, the lowest Wilks’ lambda is observed in the function of MW (0.556), which is followed by MH2 (0.659), MH1 (0.663), and MH3 (0.667) in descending order, whereas ML2 (0.950) and ML1 (0.835) show far less classification capacity. The eigenvalue, the canonical correlation, and the percentage of correct classification also demonstrate more validity of the discriminant functions produced by the width (MW) and the height (MH1–3) than by the length (ML1–2). The accuracy of classification is highest for MW, with a percentage of 84.6%. Overall, for Yuigahama-minami and Hitotsubashi the best function is produced by MW, which shows the lowest Wilks’ lambda (0.562), the highest eigenvalue (0.780), the highest canonical correlation (0.662), and the highest percentage of correct classification (85.1%). The Wilks’ lambda, the eigenvalue, the canonical correlation, and the percentage of correct classification also show more validity of the discriminant functions produced by the width (MW) and the height (MH1–3) than by the length (ML1–2).
Table 2 indicates the discriminant functions calculated by two variables that show reliable results of sex classification. The two variables combine the dimensions of height and width (i.e. MH1 and MW, MH2 and MW, and MH3 and MW). All the discriminant functions by these combinations for Yuigahama-minami, Hitotsubashi, and the total of them demonstrate equivalent or better statistical values than the functions with one variable, as shown by lower Wilks’ lambda, higher eigenvalue, higher canonical correlation, and higher percentage of classification. The accuracy of classification ranges from 82.1 to 91.7%, thereby indicating that the two-variable combinations of width and height provide reliable criteria of sex diagnosis.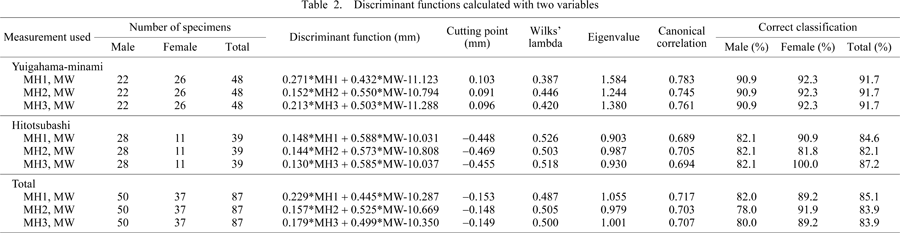
Table 3 and Table 4 show the results of the two-way ANOVA. The intraobserver mean squares are regarded as the average variance between the two measurements for each observer. The among-skull mean squares are significantly greater than the interaction ones in all measurement items (P < 0.01). The interobserver mean squares are also significantly greater than the interaction ones in all items, with the exception of MH3 of the four-observer analysis (P < 0.05). The interaction between skulls and observers represents the difficulty in locating the landmarks for the measurement. The interaction mean squares over the intraobserver ones show significant differences in the MH1, MH2, MH3, MW, ML1 of the four-observer analysis, and the ML2 (P < 0.05) of the six-observer analysis. For the skillful anthropologists, the effects of measurement errors are associated with the difference in skulls.

Table 5 shows the variance components and their percentage expressions. The total variances were partitioned into four categories: among-skull variance, interobserver error variance, intraobserver error variance, and interaction variance. The latter three variances represent the total error variances. The intraobserver variance components are greater than the interobserver ones, with the exception of MW of the four-observer analysis and the ML2 of the six-observer analysis. All among-skull variance components were greater than any other variance components. The percentage expressions of the among-skull variances of the MH2, MH3, and ML2 of the four-observer analysis, and the MH2 and ML2 of the six-observer analysis amounts to more than 80% of the total variances, whereas the percentage expressions of the among-skull variances of the MW of the four-observer analysis, and the MW and ML1 of the six-observer analysis are less than 70% of the total variances. The percentage expression of the total error variances is the smallest in MH2, but the greatest in ML1. Most importantly, the percentages of the total error variances of five items for four skillful observers are smaller than those for six observers including two anatomists with no craniometric experience.
The results of this study show the usefulness of the mastoid region for sex assessment. The accuracy of sex classification is more than 80% with only one variable, and reaches 82–92% with the combination of height and width. The accuracy obtained by the mastoid process measurements is equal to or better than some of the previous studies: 77% by Stewart (1948); 85% by Keen (1950); 90% by Hanihara (1959); 82–89% by Giles and Elliot (1963), 80% by Kajanoja (1966); 80–95% by Tanaka et al. (1979). This study distinguishes itself from previous studies by focusing on sex determination using the mastoid processes which are often well-preserved parts of fragmentary crania, and then suggests that the measurements provide a potentially useful tool for sex diagnosis even in poorly preserved crania.
Another finding obtained by this study is that the height and the width are far more useful for sex determination than the length represented by ML2. The asterion, which is the landmark of ML2, is possibly variable among individuals; therefore, it is not an appropriate landmark for sex determination. This explanation is supported by the fact that the lambdoid suture is more complex than the coronal and sagittal sutures, and that the wormian bones are more frequently present on the lambdoid suture than the coronal and sagittal sutures (Bennett, 1965). If we use the mastoid process measurements for sex determination, we should choose appropriate variables of the height and width. Furthermore, if we combine two variables for calculating discriminant functions, we will obtain a more reliable statistical basis for sex determination.
The percentages of the total error variances in the mastoid process measurements ranged from 10 to 35%, depending on the measurement items. Higher ratios of total error variances were observed in MH1, MW, and ML1, which are all items defined by the mastoid notch. The landmarks defined by the mastoid notch might be delicate in terms of determining the measurement points. The two items newly employed in this study also lack intraobserver repeatability and interobserver reproducibility. On the other hand, the percentages of total error variances are the smallest in MH2; therefore, MH2 can be judged to be more reliable than MH1, MW, and ML1. However, MH2, which has the lowest ratio of total error variance, cannot be measured without the Frankfort plane, especially in the case of fragmentary states of facial bones. It is obvious that the measurement of MH2 is not practical in archeological and forensic contexts.
Sakura and Mizoguchi (1983) and Kouchi and Koizumi (1985) analyzed intra- and interobserver errors in craniometry, and reported that some cranial measurement items, including minimum frontal breadth, biauricular breadth, sagittal parietal chord, sagittal occipital chord, orbital breadth, and orbital height have total error variances of more than 10%. Hanihara et al. (1999), who examined intra- and interobserver errors in the facial flatness measurement, have demonstrated that the simotic subtense has total error variances of more than 10% and that it shows the least reliability among the three sets of facial flatness measurements. Following the criterion of Kouchi and Koizumi (1985), if a total error variance of more than 10% is regarded to be unreliable, these items can be judged to be unreliable in craniometric studies. In this study, on average, the percentages of total error variances in the mastoid process measurements are very great (from 10 to 35%). If we also follow the criterion by Kouchi and Koizumi (1985), all measurement items employed in this study can be judged to be unreliable. The results of this study strongly suggest that it would not be safe to use mastoid process measurements for sex determination. This study alerts us to the lack of intraobserver repeatability and interobserver reproducibility. Anthropologists using mastoid process measurements should pay more attention to measurement errors. If an anthropologist uses mastoid process measurements for sex assessment, he alone should measure a sample a few times. Then, discriminant function analysis, based on averaged measurements, may provide a little more reliable insight for sex diagnosis.
This study indicates that mastoid process measurements should be conducted carefully due to the lack of intraobserver repeatability and interobserver reproducibility. In particular, the running of the mastoid notch should be carefully tracked. If the mastoid notch is not clear, the observation from the posterior view makes it easy to catch the configuration of the notch. However, the results are not necessarily pessimistic. This is because the measurement errors can be reduced by the observers themselves. The percentages of the total error variances for four skillful observers are smaller than those for six observers. Here, we examined the effects of measurement errors on the results of sex determination using the discriminant functions of Table 1 and Table 2. Table 6 suggests the number of misclassified individuals in ten individuals of Hitotsubashi assessed by each observer. Mean misclassified individuals by skillful anthropologists are 1.5–1.7 using functions with single variables and 0.3–2.2 using functions with two variables; while for non-anthropologists they are 2.0–2.5 using functions with single variables and 1.3–2.3 using functions with two variables. This also implies that skillful anthropologists can make more accurate classification of sex than non-anthropologists. Carefulness by and training of the observers are needed, which will reduce measurement errors. Furthermore, if the measurements of the mastoid processes are taken by as few observers as possible, the measurement errors have fewer effects on the interpretations of the measurements. Although the mastoid process measurements include many measurement errors, the discriminant functions produced by the measurements provide us with a useful tool for sex diagnosis in poorly preserved crania because of their methodological objectivity and simplicity.
These facts imply that if we choose the measurement items and carefully measure the skeletons, we will achieve reliable results of sex determination by mastoid process measurements. Despite the limitations, it is safe to say that the mastoid process measurements are good discriminators of sex. This study is the first step in establishing an osteological criterion for sex assessment based on the mastoid process. The results of this study will provide new perspectives on human osteology, forensic anthropology, paleopathology, and paleodemography.
We would like to thank Dr. Yuji Mizoguchi of the Department of Anthropology, National Science Museum, Tokyo, for helpful comments. This study is supported by a Grant-in-Aid for Scientific Research for Young Scientists (B) (No. 17770212) of the Ministry of Education, Culture, Sports, Science, and Technology of Japan.
|