| Correspondence to: Basak Koca Özer, Department of Anthropology, Faculty of Letters, Ankara University, Sihhiye, Ankara 06100, Turkey. E-mail: koca@humanity.ankara.edu.tr Published online 21 May 2008 in J-STAGE (www.jstage.jst.go.jp) DOI: 10.1537/ase.061213 |
The term secular change is used to define marked changes in adult body size and growth processes of successive generations in a given population (Malina, 1990; Ulijaszek, 1998; Dittmar, 1998; Bogin, 1999). It is a good determinator of public health and indicates how environmental conditions affect human body size over a long period of time (Tanner, 1992; Cole, 2003).
The body size and growth characteristics of a population can change across generations either positively or negatively (Ulijaszek, 1998; Roche and Sun, 2003). It has been reported that human biological characteristics are influenced not only by genetic factors, but also by the natural and socio-economic environment (Komlos, 1999). Since human growth and body size respond with considerable sensitivity to environment, the positive secular trend in populations within the developing world has largely been attributed to improved nutrition and health conditions (Ulijaszek, 1998; Komlos, 1999). This phenomenon has been well documented during the last two centuries in many industrialized countries (Eveleth and Tanner, 1990; Kouchi, 1996; Susanne and Bodzsar, 1998; Bogin, 1999; Arcaleni, 2006). Negative secular change in a population’s height is taken to be a response to environmental deterioration and has been observed in historical sequences as well as in contemporary populations (Ulijaszek, 1998).
Initial determinants of secular increase are generally accepted to be increased availability of public health services and improved nutrition, while other factors have been proposed by various authors (Ulijaszek, 1998; Bogin, 1999; Komlos, 1999). These include cumulative socio-economic circumstances such as migration, improved hygiene, reduction in child labor, access to education, and higher income (Ulijaszek, 1998; Komlos, 1999).
While secular changes in height and weight have been a focus of attention in an anthropological context in various populations, little attention has been devoted to Turkish populations. Anthropometric data on Turkish adults are relatively limited, and there is little information available regarding the occurrence of secular change. The first anthropometric data related to adult height for this population was reported by Weisbach in 1884 (as cited by Inan, 1947), followed by pioneering studies which focused mainly on adult male height. Concerning historical anthropometry in Turkey, two nationwide anthropometry data sets referred to the whole country. The first nationwide survey on both male and female adults which focused on various anthropometric traits was conducted in 1937 (Istatistik Umum Müdürlügü, 1937). The second nationwide survey was conducted by Çiner (1960) only on female subjects. In addition to these nationwide surveys, anthropometric studies on conscripts may represent national means as well as the country’s regional averages. In Turkey, military service is compulsory for all males when they reach the age of 19 years. Therefore, a random sample of military conscripts can be considered as a true national representation of males from all regions and all social strata. Hertzberg et al. (1963) were the first to collect data from Turkish conscripts, as a part of the North Atlantic Treaty Organization (NATO) anthropometric survey which was conducted in 1960–1961. Data on the Turkish conscripts were also collected and published in 1971 (Emekli, 1971), 1989 (Kayis and Özok, 1989), and 1997 (Kir, 1997).
As Turkey is a developing country, an analysis of height and weight data will provide important information about the impact of socio-economic fluctuations on long-term changes in nutritional and other public health conditions. The aim of this study is to present anthropometric data on the contemporary adult Turkish population and to focus on the secular changes since 1884.
The present study is based on two data sets: contemporary data and comparative former data. To determine the contemporary anthropometric measurements, a cross-sectional survey was conducted in Ankara, Turkey. The survey was performed between January 2004 and December 2006. The subjects of the contemporary data set are 1215 healthy adults (703 males and 512 females) aged between 18 and 59 years. Dates of birth (day–month–year) were recorded, and ages were calculated based upon the recorded date. A questionnaire was completed to assess socioeconomic status (SES) indicators: education level, occupation, place of birth, and number of children (Table 1).
Height (cm) and weight (kg) were measured by the author and three trained technicians according to the methods specified by the International Biological Programme (Weiner and Lourie, 1969), while the participants were in light clothes and without shoes. Height was measured to the nearest millimeter by a Martin-type anthropometer, and weight was measured to the nearest 100 g using a digital scale.
A t-test was used to evaluate the sex differences for each age group using SPSS 13.0 software. Selected percentiles (3rd, 10th, 25th, 50th, 75th, 90th, and 97th) for males and females were constructed using the LMS method (Cole and Green, 1992; Cole, 2002) by the LMS Chartmaker program (Medical Research Council, UK) (www.health-for-all-children.co.uk). The LMS method summarizes age-related data distribution by using a power transformation, which normalizes data distribution and takes into account the skewness present in anthropometric measurements. The three letters L, M and S represent the Box–Cox power which transforms the data distribution to the normal (L), the median (M), and the coefficient of variation (S). Each quantity has corresponding smooth curves plotted against age by natural cubic splines which were estimated using maximum likelihoods. By using the LMS method one can construct any required percentile using the following formula: percentile = M(1 + LSZα)(1/L), where Zα is the normal equivalent deviate of the required centile and calculated as Z = [(measurement/M)(L) − 1]/LS (Cole and Green, 1992; Cole et al., 1998; Cole, 2000; Cole, 2002). The goodness-of-fit was estimated by means of quantile–quantile (QQ) tests (Pan and Cole, 2004). The QQ plot is often used to assess whether the data follow a particular distribution, e.g. for the normality of the data after conversion to z–scores (SDS). Graphs were plotted using KaleidaGraph 3.5 software.
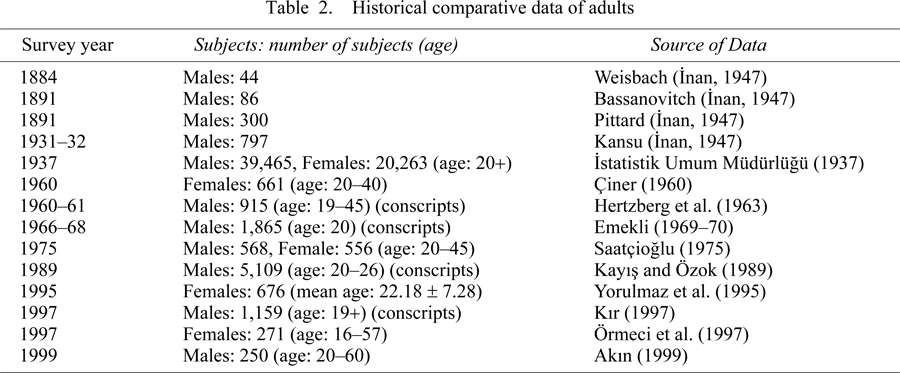
The second data set consists of historical data obtained from former survey reports (Table 2). Secular change was expressed as increase per decade obtained by multiplying the average annual increase of each measurement by 10.
The body mass index (BMI), weight/height2 (kg/m2), and the prevalence of overweight and obesity were calculated. International Obesity Task Force (IOTF) BMI cut-off criteria were used to define overweight (25 kg/m2) and obesity (30 kg/m2) (Cole and Rolland-Cachera, 2002; Lobstein et al., 2004).
Contemporary mean height was found to be 174.0 cm (SD 6.9) for males and 158.9 cm (SD 6.4) for females. Contemporary mean weight was found to be 77.8 kg (SD 10.8) for males and 67.0 kg (SD 11.9) for females. Table 3 reports the sample size and mean values of height, weight and BMI by age group for both sexes. In every age group, height and weight exhibited statistically significant (P < 0.001) sex differences. Tables 4 and 5 present height and weight percentile values by sex and age group, respectively. QQ tests revealed overall satisfactory goodness-of-fit for both parameters by sex and age groups (95% confidence interval).


Table 6 demonstrates the prevalence of overweight and obesity for both sexes. Based on IOTF 8.8% of males and 21.5% of females were obese. The prevalence of overweight was found to be higher in males (47.5%) than in females (35.5%).
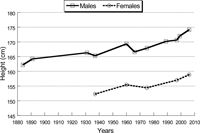
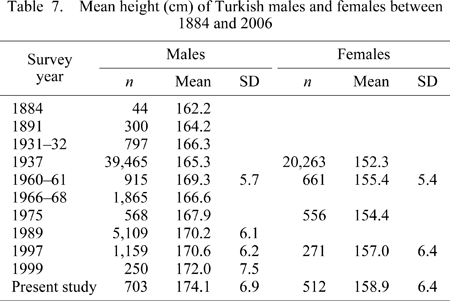
Figure 1 presents data on the mean height of adult males and females during the past 122 years as reported in several studies (Table 7). Comparative data from Turkey demonstrate a general increase in male height between 1884 and 2006. Overall, male height increased from 162.2 cm to 174.0 cm, a rate of increase of 0.98 cm/decade (Figure 1). The mean height of females increased from 152.3 cm to 158.9 cm, and the rate of secular increase was 0.96 cm/decade between 1937 and 2006. The observed rate of secular increase in height between 1937 and 2006 was greater in males (1.19 cm/decade) than in females (0.96 cm/decade). The sex difference in mean height was 13.0 cm in 1937, 13.9 cm in 1960–1961 (t = 48.90, P < 0.001), 13.5 cm in 1975, and 15.3 cm today (t = 39.66, P < 0.001).
 View Details | Figure 1. Secular change in the mean height (cm) of Turkish males and females between 1884 and 2006. |

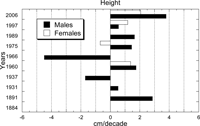
The secular trend is not completely linear. Figure 2 presents the differences in mean height between survey years. Periods of steady increase are followed by sudden decreases and subsequent recoveries. In the mid-1930s there was a slight decrease in mean male height. Anthropological studies performed after World War I (WWI) and the Independence War (1918–1923) showed a decrease in mean male height, while studies in the 1950s and 1960s indicate that mean height increased again. Survey results from the mid-1960s once again indicate a decrease in the mean height for males who were born during World War II (WWII) and the post-war depression. Increases in male height have been observed since the 1970s up to the present. The same pattern is evident for females, although both increases and decreases were smaller than those for males.
 View Details | Figure 2. Secular increment in the mean height (cm/decade) for Turkish males and females between 1884 and 2006. |
Table 8 presents the increase in height between 1937 and 2006 for males and females according to different age groups. The rate of secular increase varied with age and the increment was greatest in the 20–29 year age group for both sexes.
Figure 3 presents the changes in the mean weight of the Turkish population during the 69-year period from 1937 to 2006 (Table 9). Comparative data demonstrate that the mean weight of both sexes increased during this period. Overall, mean weight increased from 62.0 kg to 77.8 kg in males and from 52.9 kg to 67.0 kg in females. The rate of the secular increase was 2.29 kg/decade and 2.05 kg/decade for males and females, respectively (also see Figure 4). The secular gain in height showed a similar pattern in both sexes for this time period.
 View Details | Figure 3. Secular change in the mean weight (kg) of Turkish males and females between 1884 and 2006. |

 View Details | Figure 4. Secular increment in the mean weight (kg/decade) for Turkish males and females between 1937 to 2006. |
The increments in mean weight by age group for males and females are presented in Table 10. The overall trends are similar to those of height: the increments are positive and the amount varies with age group. However, in contrast to the patterns of height increments, weight increments were greater later in life. For weight, the increment was greatest in the 50–59 year age group.
Comparison of data on Turkish adults since 1884 demonstrated a prominent secular increase in height and weight. The rate of secular change in the mean height (1884–2006) and mean weight (1937–2006) of males was 0.98 cm/decade and 2.29 kg/decade, respectively. The rate of the secular change in the mean height and mean weight (1937–2006) of females was 0.96 cm/decade and 2.05 kg/decade, respectively. Moreover, the trend is not always linear and not even unidirectional for height. Besides the steady increase, decreases and subsequent recoveries also occurred. In the mid-1930s and in the period between the 1960s and 1970s, negative secular change was prominent.
Since the 18th century, data on the height and nutritional status in European nations have been based mainly on studies of military recruits (Floud et al., 1990). In 1761, Norwegian recruits aged 18.5 had an average height of 159.5 cm, and the Historical Statistics of Italy (1861–1975) showed that the mean height of 20-year-old recruits born in 1854 was 162.4 cm. The mean height of Spanish recruits was 163.4 cm in 1913 (Floud et al., 1990). The mean height of Turkish males during the Ottoman Empire was similar to that of their European counterparts. According to Inan (1947), the reported mean height for Ottoman Turkish males varied from Weisbach’s 162.2 cm in 1884, to Bassanovitch’s 164.2 cm or Pittard’s 167.9 cm (both in 1891).
Since 1860s, mean adult height in Western European countries has increased at a rate of 1 cm/decade, reaching 175 cm by the time baby–boomers reached adulthood. In the Netherlands, the rate was greater, i.e. about 1.6 cm/decade. Consequently, the Dutch, along with the Scandinavians, became the tallest people in the world. In 1860 they were approximately equal to the European norm, which is 7 cm shorter than that of Americans (European descendants living in the United States), but today their mean height is around 180–183 cm, about 3–5 cm taller than the average American (Komlos, 1999). The most pronounced secular increase reported so far is the increase observed in the whole population of Japan which occurred after WWII (Kouchi, 1986, 1996). In 1960, the height of Japanese young adult males was about 162 cm, while it was about 172 cm in 1995. The most rapid change, about 7 cm was observed between 1960 and 1980. On the other hand, the rate of secular increase in Sweden and Norway between 1952 and 1985 was only 0.3 cm/decade (Bogin, 1999).
During the WWI and WWII, a negative secular trend or lack of a positive secular trend was observed in developed countries. Europe during WWI and WWII and Japan during WWII experienced this situation (Malina, 1990). Furthermore, people living under deteriorating conditions demonstrate negative secular trends in height and weight (Bogin, 1999; Cole, 2003). In India and other non-industrialized countries, a secular decrease has been documented in height (Jurgens, 1990; Pheasant, 2002). These trends are similar to those that occurred in Europe in former times (Cole, 2000).
Anthropological studies on Turkish adults performed after WWI and the Independence War (1918–1923), showed a decrease in mean male height. Between the survey years 1931–1932 and 1937, male height decreased by 1 cm (Istatistik Umum Müdürlügü, 1937; Inan, 1947). Between the 1937 nationwide survey (Istatistik Umum Müdürlügü, 1937) and the 1960–1961 NATO anthropometric survey (Hertzberg et al., 1963), a positive increase (1.74 cm/decade) is evident. However, studies in 1966 (Emekli, 1971) and in 1975 (Saatçioglu, 1975) indicate that mean male height had decreased since the 1960–1961 NATO survey. This trend may be linked with the WWII and post-war depression. Neyzi et al. (1996) pointed out a negative secular trend in the growth of Turkish children during the same period. Thus, the secular trends in the mean height of children are similar to those of adults, though vary somewhat according to the age of the children. It has been reported that this negative trend in the growth of Turkish children is possibly due to the conditions created by WWII. Although Turkey did not take part in this war, socioeconomic conditions were considerably affected by the war (Neyzi et al., 1996). A similar pattern is evident for the secular change in the height of Turkish females. Between survey years 1937 (Istatistik Umum Müdürlügü, 1937) and 1960 (Çiner, 1960), a positive secular change was evident, indicating a rate of 1.37 cm/decade. However, according to a survey conducted in 1975 (Saatçioglu, 1975), a negative change was observed (−0.69 cm/decade).
Since the 1970s, mean height has been increasing in both sexes. Compared to the CDC 2000 US reference, the median of Turkish contemporary data falls between the 25th and 50th percentile of the US data (50th percentile of height data for 20-year-old males and females were 177 cm and 164 cm, respectively) (Kuczmarski et al., 2002; Cole, 2003). It must be noted that the US height data currently lags behind that of the Northern Europe (e.g. almost 7 cm smaller than the Netherlands) (Cole, 2003).
According to the IOTF, an epidemic of obesity has been affecting both developed and developing countries (IOTF, 2003). The present data demonstrate that the secular increase in adult weight for the Turkish population brings the overweight (47.5% of males and 35.5% of females) and obesity (8.8% of males and 21.5% of females) epidemic together. Results from the 1990 and 2000 Turkish Adult Risk Factor Study (TEKHARF) (Sansoy, 2003) showed that the prevalence of obesity increased in males and females from 9% and 28.5% to 11.4% and 32.6%, respectively. It must be noted that age is strongly associated with obesity, and that both TEKHARF surveys were carried out on adults over 30 years of age. In the present day among Turkish adults aged 30 years or older, the prevalence of overweight is alarming for males and obesity for females, but the prevelance of obesity is still lower than that in Western and Middle Eastern countries. Today, women’s obesity prevalence rates are over 20% in countries such as the UK, Germany, Finland and Greece. The United States has been facing extreme obesity rates since the 1980s (IOTF, 2003). In the Middle East high levels of obesity exist, particularly in females, though also in males as well in Egypt and Saudi Arabia. In Kuwait, the United Arab Emirates, and Bahrain, obesity rates for females are 20–30%. In Iran the obesity rate varies between rural and urban populations; among females in Tehran it is 30% (IOTF, 2003). The observed sex difference in the obesity rate is probably related to the fact that a large proportion of the women in Middle Eastern countries are sedentary, particularly in the cities (Bahrami et al., 2006). There are physical and cultural barriers against the physical activity of women such as a lack of physical education in schools and an absence of women’s participation in sports in general (Galal, 2002).
There is a debate over the relative importance of different environmental factors that have influenced the final adult size at different periods of time. In this context, the present findings raise questions about the factors that might be responsible for the observed negative and positive secular changes in Turkish adults’ height and weight during the survey years. When compared with developed countries that have experienced a high degree of secular increase, Turkish adults exhibit a slower rate of secular increase.
(1) Nutrition and public health
National nutrition surveys conducted during the last four decades indicate that the average diet has been adequate to meet the recommended daily intake of calories and most of the required nutrients. However, intakes of animal protein, calcium, vitamin A, and riboflavin are lower than recommended (Pekcan and Karaagaoglu, 2000; FAOSTAT, 2001). The proportions of protein, fat, and carbohydrates in the dietary energy supplies (DES) have changed between 1965 and 1997 by −0.9%, +3.2%, and −2.2%, respectively. The proportions of protein, fat and carbohydrates in the Turkish diet are approximately 12%, 25%, and 63%, respectively (FAOSTAT, 2001). No significant change was observed in average per capita food consumption within the last four decades. However, there are differences among families and sub-groups in terms of energy and nutrient intakes. The most important factors affecting food consumption patterns are income level and lack of knowledge. Low–income families consume more bread, while high–income families consume more meat, meat products, fresh fruits, and vegetables (Pekcan and Karaagaoglu, 2000; HUIPS, 2004; Pekcan, 2006; Akbay et al., 2007).
On the other hand, Turkey has achieved progress in controlling major infectious diseases, and thus the occurrence of these declined dramatically between the late 1960s and 1990s (MoH, 2004). Infant mortality rate was considerably reduced from 120 per 1,000 live births in 1980, through 55 per 1,000 live births in 1992 and to 23.6 per 1,000 live births in 2005 (TURKSTAT, 2004, 2005) though it is still higher than the European Union average (8 per 1,000 live births) (MoH, 2004). Infant mortality rate is strongly associated with overall living conditions and it is one of the single most meaningful indicators of socioeconomic improvement (Bogin, 1999).
Although inequality in the amount and quality of food between different socio-economic groups still exists, improvements in public hygiene, and access to improved water supplies and medical care, as indicated by the reduced infant motality rate, may have played a part in the secular change in adult height seen in the last decades.
(2) Socioeconomic environment
Concerning socioeconomic status, Turkey has experienced gradual changes in respect to community size, scale of urbanization, education level, and income. According to the 1927 census, the population was 13 million, whereas the 2000 census recorded a population of 67 million. The high population growth rate now stands at over 12.6‰ for 2005 (TURKSTAT, 2004, 2005). The illiteracy rate within the adult population was 81.3% in 1935, 61.9% in 1960, 34.4% in 1980, and 13.5% in 2000 (5.6% among males and 21.5% among females) (TURKSTAT, 2004).
After WWI and the Independence War (1918–1923), the Turkish economy recovered remarkably. Between 1923 and 1930, industrial and service sectors grew by more than 9% per year and agricultural output rose by 87%. Between 1930 and 1950, influenced by worldwide depression, the Turkish economy sharply declined. In the late 1950s, the country experienced economic disruptions, and again during the 1970s. After 1980, development continued and Turkey exhibited a markedly improved economic performance, although some crises and deficits did occur. Furthermore, the gross domestic product (GDP) and other growth and industrial production indices have been rising while real wages remain low (Metz, 1996).
Increasing urbanization and urban–rural disparity have become top-priority issues in Turkey (SPO, 2006). Urbanization represents the overall trend in social changes and acts through biological factors (Kouchi, 1996). In Turkey the urban population has increased sharply since the 1950s: the population living in cities was around 25% in 1950 and 65% in 2000 (HUIPS, 2004).
Consequently, economic growth and urbanization of the Turkish population over the last decades have had a major impact on the health status and disease patterns throughout the country. Investments in health and education, as well as in poverty alleviation, have led to an improvement in overall health in Turkey, and these phenomena could be linked to the positive secular increase. On the other hand, at the end of the 20th century, income inequality and regional differences in Turkey were still greater than those in Western Europe (Komlos and Baur, 2004), and this could explain the slower rate of secular increase in Turkey.
The secular trends of height and weight seem to reflect the impact of long-term changes in nutrition and health conditions related to economic, social, and demographic changes. In Turkey, the direction of secular changes has been similar to that in other European countries, but on a smaller scale. With regards to its socioeconomic status, Turkey has experienced gradual changes in community size, sanitation, urbanization, as well as education and income level, although regional and urban–rural disparities still exist. During the 122-year study period, remarkable secular increases in height and weight were observed in Turkish adults, especially during the last three decades, although negative secular changes were also observed during the periods of hardship.
Secular change in adult height has ceased in several European countries, but it is still continuing in others (Kouchi, 1996). It is difficult to predict future trends concerning secular changes in Turkish adult anthropometric characteristics. However, the secular increase in adult height and weight seem to be due to the increase in growth rates in early childhood, and in Turkish children this trend is still continuing (Özer, 2007). It is therefore expected that the secular increase in height and weight will continue in the near future.
This study has been undertaken at Kyoto University, under the Japanese Government Ministry of Education, Culture, Sports, Science and Technology (Monbukagakusho) Scholarship. The author wishes to thank the individuals who participated in this study for their patience and friendly cooperation. The author would like to thank Professor Kazumichi Katayama (Kyoto University), Professor Makiko Kouchi (National Institute of Advanced Industrial Science and Technology), Professor Erksin Güleç (Ankara University) and Professor Galip Akin (Ankara University), and the reviewers for their constructive comments during the preparation of this manuscript. Thanks are also due to Lee Ai Ling for language support, and Dr. Timur Gültekin and Yener Bektas for their contribution during the data collection.
|