| Correspondence to: Tsunehiko Hanihara, Department of Anatomy and Biological Anthropology, Saga Medical School, 5-1-1 Nabeshima, Saga 849-8501, Japan. E-mail: hanihara@cc.saga-u.ac.jp Published online 25 October 2008 in J-STAGE (www.jstage.jst.go.jp) DOI: 10.1537/ase.080609 |
The intensely studied population history of Japan has elucidated the origin and the process of differentiation of the present inhabitants of the Japanese archipelago (Yamaguchi, 1982, 1992; Turner, 1987, 1990; Mizoguchi, 1988; Brace et al., 1989; Hanihara, 1991; Dodo and Ishida, 1992; Ossenberg, 1992; Ossenberg et al., 2006). Modern Japan has two related but morphologically and genetically distinguishable ancestral populations: the Jomon people, Neolithic hunter-gatherers; and migrants from eastern Asia to the southwestern part of Japan via the Korean Peninsula, who brought rice agriculture and metal-tool technologies (outlined by Hanihara, 1991; Dodo and Ishida, 1992; Yamaguchi, 1992). After the end of the Jomon period, during the subsequent Aeneolithic Yayoi and protohistoric Kofun periods, admixture between the indigenous people and the incoming populations blurred the distinction between the two populations (Turner, 1987, 1990; Brace et al., 1989; Brace and Hunt, 1990; Dodo and Ishida, 1990; Kozintsev, 1990, 1992; Hanihara, 1991; Lahr, 1996; Ossenberg et al., 2006).
The impact of the post-Jomon migrants was not, however, uniform throughout the Japanese archipelago (Hanihara, 1985, 1991; Ossenberg, 1986; Horai and Omoto, 1998; Ossenberg et al., 2006). The available skeletal and genetic data have suggested a stepwise process of differentiation and diversification of the physical traits, without complete disappearance of the Jomon characteristics (Yamaguchi, 1982, 1992; Horai and Matsunaga, 1986; Hanihara, 1991; Brace and Hunt, 1990; Turner, 1990; Dodo and Ishida, 1992; Tajima et al., 2004). Today, moreover, varying degrees of clinal variation from southwest to northeast are recognized not only in several physical characteristics of modern Japanese but also in cultural and ethnic aspects (Hanihara, 1985, 1991; Ossenberg, 1986; Pearson, 1986). In geographically isolated Hokkaido, on the other hand, overall post-Neolithic population continuity, from the Jomon people to the recent indigenous inhabitants, the Ainu, is evident (Yamaguchi, 1974; Turner, 1987; Brace and Hunt, 1990; Hanihara, 1991; Dodo and Ishida, 1992; Dodo and Kawakubo, 2002).
Geographic variation is often regarded as a sign of ancient difference in population size, bottlenecks, isolation, or admixture (Relethford, 1991, 1994, 2001; Manica et al., 2005, 2007; Prugnolle et al., 2005; Ramachandran et al., 2005; Liu et al., 2006). If morphological differentiation is assumed to have occurred clinally over space and time, moreover, we should consider the gene flow and/or genetic drift. Such arguments may allow us to suppose that the populations around the region where the migrants initially colonized, southwestern Japan, carry a large amount of migrant characteristics (Hanihara, 1991; Ossenberg et al., 2006). On the other hand, the varying degrees of admixture would determine the maintenance of distinctive morphologies in the remote margins of expanded population range, the Tohoku region, in the northeastern part of the Japanese archipelago (Yamaguchi, 1988).
The patterns of phenotypic variation obtained by classic multivariate analyses, such as Mahalanobis’ generalized distance analysis, discriminant function analysis, principal component analysis, etc., can be interpreted in light of both population history (branching pattern) and structure (genetic drift and gene flow). According to Relethford and Harpending (1994) and Relethford (1996), however, it is often difficult to distinguish between patterns reflecting population structure and population history, because the latter is concerned with the level of affinities between populations resulting from gene flow, common ancestry, or both (Relethford, 1996). Today, we have two approaches to deal with this problem. One approach is to include the samples covering the greater temporal and regional scale for understanding the process of differentiation of the population groups. An alternative approach is to use models that test various assumptions such as population size, isolation, migration, or a combination of these factors (Relethford and Blangero, 1990; Relethford and Harpending, 1994; Relethford, 1994, 1996, 2001; Haneji et al., 2007; Toma et al., 2007).
Given this background, the purpose of the present study is to examine spatial and temporal population growth and expansion during the last 2000 years, focusing on the timing and level of population movement to the Tohoku region, in the northeastern part of the main island Japan. Moreover, by exploring the process of the formation of phenotypic diversity based on the synchronic and diachronic comparisons, this paper addresses the question of how the observed variation among population groups should be interpreted in the context of human microevolution in the Japanese archipelago.
Phenotypic variation and differentiation was evaluated using craniometric data recorded in 12 regional samples. Except for the prehistoric Jomon and recent Ainu samples, three regions were considered: Tohoku (northeastern part of the Japanese archipelago), Kanto (central Japan), and northern Kyushu (southern Japan). Each region is, moreover, represented by two archaeological samples from protohistoric Kofun period (c. 300–900 AD) and early modern Edo period (c. 1600–1900 AD), and the modern samples (Table 1). Most specimens of the Kofun samples belong to the final Kofun or early Nara, and some belong to early Heian period. The Aeneolithic Yayoi group, representing migrants with rice agriculture and bronze/iron tools from eastern Asia during the Yayoi period (c. 300 (900?—recent archaeological view) BC–300 AD), are additionally included in the samples from the northern Kyushu region.
Brief information on the samples is given in Table 1. The approximate locations of the archaeological sites for the Tohoku Kofun and Edo samples together with the locations of northern Kyushu, Kanto, and Hokkaido regions are given in Figure 1.
 View Details | Figure 1. Map showing the approximate locations for the Tohoku cranial samples. Closed triangle, Kofun samples (c. 300–900 AD); closed diamond, Edo samples (c. 1600–1900 AD). |
In the present study, 12 standard cranial measurements and 6 facial flatness measurements (Yamaguchi, 1973; Bräuer, 1988) were used for analyses (Table 2). Except for a few samples, the data were collected by Y.K. to avoid potential interobserver errors. Cranial measurements are recorded in adult male specimens. In this study, C-score based Mahalanobis’ generalized distance and principal component analysis (PCA) were employed. Raw measurements were first converted into Z-scores, which in turn were used to generate C-scores (Howells, 1989). After the two-step procedure, a double centering method, the effects of cranial size factor could be removed from the data (Howells, 1989; Brace and Hunt, 1990). Z-scores were calculated for all individuals using the mean of the sample means compared, to avoid weighting by different sample numbers, and standard deviations based on the mean of intra-group variance of the same samples. Although some researchers have criticized the application of C-score data to multivariate analyses (e.g. Jungers et al., 1995), Pietrusewsky (1994, 1997) demonstrated that the transformation to C-scores has little effect on the reliability of the patterns of craniometric variation.
To visualize the patterning of intergroup relationships and the level of craniometric diversity among regional samples, a multidimensional scaling method was used (Torgerson, 1952).
Table 2 gives the results of basic statistics for three samples from the Tohoku region. The results of Mahalanobis’ generalized distance based on the C-scores of 12 samples are set out in Table 3. Figure 2 shows the distance between the Jomon sample and the other samples. As expected, the recent Ainu sample shows the closest affinities to the Jomon sample. Except for the Ainu sample, the biological distance from the Jomon increases essentially with chronological differences. Indeed, the phenotypic difference from the Jomon cranial series increases smoothly with increasing temporal difference from the Jomon period in the Tohoku region.
 View Details | Figure 2. Distance between the Jomon sample and other samples measured by Mahalanobis’generalized distance based on C-scores. |
The intergroup relationships included in the distance matrix in Table 3 are visualized with minimum loss of information. The two-dimensional expression of multidimensional scaling, presenting 92.93% of the total variance (Table 4), is shown in Figure 3. Two major constellations are evident in this diagram. The Jomon and Ainu samples form a loose cluster on one corner of the diagram. The samples of the Yayoi and the subsequent periods form a second constellation. In the second cluster, the samples show an arrangement that is more dispersed temporally than spatially. The sample of the Tohoku Kofun is closer to the Jomon–Ainu cluster than other samples. On the other hand, the modern samples together with the Kyushu Edo samples form a subgroup, more or less removed from the remaining samples.
 View Details | Figure 3. Two–dimensional display of the sample affinities using the first two coordinates of multidimensional scaling based on the distance matrix given in Table 4. |
Given estimates of the regional and temporal patterns of phenotypic differentiation, PCA was applied to the same data used in the Mahalanobis’ generalized distance analysis based on the pooled within-group variance–covariance matrix. Table 5 gives the information of the first five principal components (PCs) with eigenvalues greater than 1.0, accounting for over half of the total variance. The first PC represents the simotic subtense and chord as well as frontal and zygomaxillary subtenses against the relative size of orbits and facial breadth; the second PC defines polarity between the cranial length and cranial breadth with the height of facial part such as upper facial, nasal, and orbital height; the third PC presents the relative sizes of cranial and facial length vs. those of breadth and facial projection; the fourth PC can be interpreted as representing the relative size of orbital and inner biorbital breadth vs. those of cranial breadth as well as nasal and mid-facial breadth; and the fifth PC defines the overall cranial vault size represented by cranial length, breadth, height, and cranial base length against the flat and narrow faces.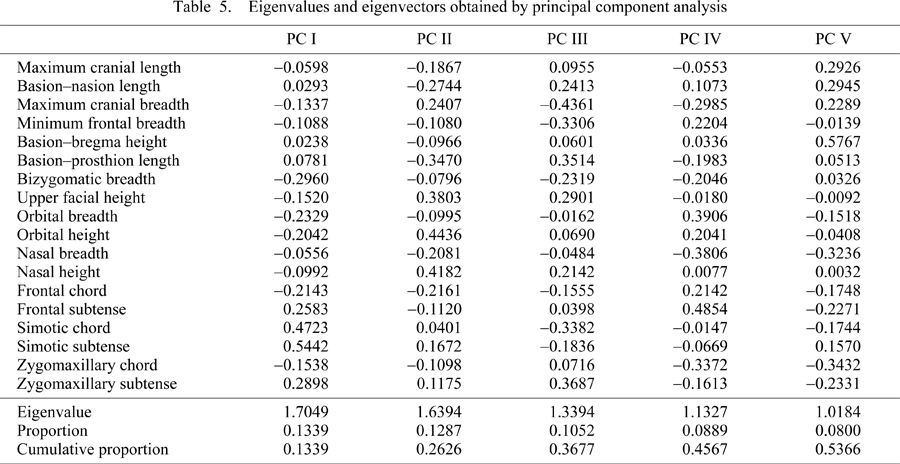
Figure 4 provides the plots of the samples on the first to fifth PCs, based on the PC scores in each sample (Table 6). The first PC opposes the Jomon/Ainu samples to the Yayoi/Kofun series. The modern samples are plotted on the positive side. In the second and third PC, the samples are roughly arranged in chronological order except for the Ainu and Yayoi samples. The fourth PC shows that the modern samples, including the Ainu sample, have positive scores. The Jomon, Yayoi, and Kofun samples are scattered on the opposite side. In the fifth PC, the Jomon, Ainu, and modern Japanese samples are plotted on the positive side, opposing the Yayoi, Kofun, and to a lesser extent, Edo samples.
 View Details | Figure 4. Plot of the first five principal component scores for each sample based on the information shown in Table 6. The measurement items with absolute values of eigenvectors greater than 0.15, and the interpretation of craniofacial characteristics based on the items are given. |

Spatial and temporal variation is an important factor to consider when examining population history and structure on both the global and local level (Lahr, 1996; Relethford, 1996).
The present findings re-confirm that the growth and expansion of the incoming Yayoi rice agriculturalists and the subsequent Kofun tomb builders, the immediate predecessors of the emergence of the ancient Yamato state in Japan, gradually covered the geographic range of the previous Jomon lineages (Figure 2).
Although it is evident that the immigrant Yayoi and the subsequent Kofun populations are the main ancestors of current Japanese except for the Ainu in Hokkaido (Turner, 1987; Brace et al., 1989; Hanihara, 1991; Dodo and Ishida, 1992), the results obtained in the present study indicate that the modern craniofacial pattern gradually appeared in and after the Kofun period (Figure 3). As shown by the PCA, moreover, modern craniofacial features have not uniformly emerged temporally and/or spatially.
The temporal change concerns the observed trend for reductions in cranial length, facial breadth, and prognathism (represented by facial length/cranial base length), facial flatness, and orbital volume, and increases in cranial breadth and facial and orbital height, as indicated by the first to fourth and, to a lesser extent, the fifth PCs. The brachycephaliztion in recent and modern Japanese (Mizoguchi, 2007a, b) and the craniofacial modernization as represented at the simplest level by gracilization (size and volume reduction) in facial dimensions, with the possible exception of the orbital height, has often been pointed out (Carlson and Van Gerven, 1977; Howells, 1983; Lahr and Wright, 1996; Kaifu, 1997; Brown and Maeda, 2004; Kawakubo, 2007). It is generally assumed that shifts in economy and food processing in conjunction with the introduction of agriculture together with physical activities played an important role in these processes (Brace et al., 1991; Brown and Maeda, 2004). This trend undoubtedly contributes to the fact that patterns of modern craniofacial features become visible from post-Neolithic times onwards in Japan (but in general worldwide from the Neolithic transition (Brace et al., 1991; Brown and Maeda, 2004)). Another interesting observation, seemingly connected with the spatial change, is that there are different levels of diversification of craniofacial morphology in different regional populations in the Japanese archipelago as shown in Figure 4. These patterns and diversity of the craniofacial features of modern Japanese may be interpreted as the differential retention, loss, and/or intensification of certain phenotypic characteristics depending on the local adaptation and differential admixture between indigenous lineage and new arrivals as suggested by Lahr (1996) and Relethford (1996).
According to a general population expansion model (Thorne and Wolpoff, 1981; Lahr and Foley, 1994), it would be expected to observe at the peripheries of the range of expansion (the Tohoku region in the present case) populations that relate to the previous inhabitants over which the present one has been superimposed. These peripheral groups probably maintained more or less their distinctive characteristics which may be traced back to those of the indigenous population groups (the Jomon people) because of the limited gene flow (Ossenberg, 1986). As such, northeastern Japan, the Tohoku district is a region likely to present such population heterogeneity, or ‘dual structure’, even to the present day.
In stark contrast to the great migrant (genetic) influence in the physical characteristics of main-island Japanese, little genetic contribution of the incoming Yayoi and Kofun people to the indigenous inhabitants in Hokkaido, the lineage leading to the recent Ainu, has been indicated (Dodo and Ishida, 1992; Brace and Hunt, 1990; Dodo and Kawakubo, 2002). Recent genetic and morphological studies suggest, on the other hand, the possible effect of northeast Asian admixture on the formation of physical characteristics of the Ainu (Ishida, 1996; Shigematsu et al., 2004; Tajima et al., 2004; Kondo, 2005; Sato et al., 2007; Komesu et al., 2008; Hanihara et al., 2008).
These recent findings indicate that the observed difference between the Ainu and Honshu Japanese from protohistoric to recent times is attributed to several different evolutionary sources such as subsistence pattern, selection and isolation, and gene flow from different sources. Depending on population size, population distribution, genetic drift, and the different levels and kinds of gene flow that reflected the division between the recent Ainu and Japanese as well as subdivision among regional groups of the Ainu and Japanese themselves, the interpretation of the distance (or similarity) between local population groups may be confounded and varied (Hanihara et al., 2008). Van Vark et al. (2003) emphasize that phenotypic affinity may sometimes be a poor indicator for the determination of direct relationships between populations (ancestral–descendant relationships). Rather, morphological similarity is often explained by a relatively strong retention of plesiomorphic characters especially in peripheral populations.
Given such microevolutionary background, the question of whether we can detect the physical characteristics of the Ainu in some local groups of past and modern Japanese, especially in the inhabitants of the Tohoku region, is inappropriate. At the very least, the long-observed relationships between Ainu and past as well as modern populations in the Tohoku region (Yamaguchi, 1975; Takahashi, 1978; Hanihara, 1985, 1990; Kudo, 1992) should be interpreted in terms of differential retention of generalized or ancestral (Jomon) traits rather than in terms of ancestral–descendant relationships.
We would like to thank B. Yamaguchi for providing the individual data of the Ainu sample.
We wish to express our sincere thanks to K. Kumaki of the Department of Anatomy and Ogata Collection Committee, Faculty of Medicine, Niigata University, Niigata; G. Suwa of the Department of Anthropology, University Museum, The University of Tokyo, Tokyo; H. Baba and Y. Mizoguchi of the Department of Anthropology, National Museum of Nature and Science, Tokyo; K. Hirata of the Department of Anatomy, St. Marianna University School of Medicine, Kawasaki; T. Nakahashi of Department of Anthropology, Kyushu University, Fukuoka; S. Iwanaga of Kyushu University Museum, Fukuoka; for their kind permission to study the materials under their care.
This study is financially supported by Grant-in-Aid for Scientific Research No. 17370089 from Japan Society for the Promotion of Science.