| Correspondence to: Ravindra S. Goonetilleke, Human Performance Laboratory, Department of Industrial Engineering and Logistics Management, Hong Kong University of Science and Technology, Clear Water Bay, Kowloon, Hong Kong, China. E-mail: ravindra@ust.hk Published online 5 February 2009 in J-STAGE (www.jstage.jst.go.jp)DOI: 10.1537/ase.070915 |
In the last few decades, research related to feet and shoes has gained prominence due to consumers’ requirements for better–fitting and more comfortable shoes. Fit is a primary determinant in the purchase of footwear (Chong and Chan, 1992; McEvoy, 1996; Au and Goonetilleke, 2007). Misfits between the foot and the footwear impair foot function and can result in undue pressure on the foot from tightly fitting footwear or unwanted friction from loosely fitting footwear (Chen et al., 1994; Goonetilleke and Eng, 1994; Luximon, 2001a). In specialized applications such as ski boots, the most important characteristics of the boots are the safety, shape, and ease of walking and standing (Heller and Godlington, 1988). Consequently, footwear fit is important for comfort as well as for the general well-being of a person (Cavanagh, 1980; Luximon and Goonetilleke, 2003a).
Footwear fit is generally achieved by matching the foot to the shoe in terms of length, width, and height (Clarks, 1976; Kouchi and Mochimaru, 2001; Wunderlich and Cavanagh, 2001; Mochimaru and Kouchi, 2003; Witana et al., 2006). It is known that a foot changes shape depending on the load imposed on it. Just like ski boots, most shoes used for casual wear need to fit the foot in a standing as well as in a walking posture. Hence, the no-load-foot-shoe-fit of a shoe, especially when sitting, as well as the loaded-foot-shoe-fit when standing or walking are quite important (Carlsöö and Wetzenstein, 1968; Rossi, 1983; Cheng et al., 1997; Tsung et al., 2003). Even though changes in foot shape with increased foot loads can be accommodated with the use of flexible shoe materials (Bradley, 1951; Allwood, 1974; Rossi, 1983; Cheng et al., 1997), shoe designers need a good understanding of foot deformation in order to minimize undue stress on the foot or the human body.
Previous studies of the dimensional changes of the foot with weight bearing present limited information (Carlsöö and Wetzenstein, 1968; Rossi, 1983; Cheng et al., 1997; Tsung et al., 2003). Most of these studies quantified dimensional changes to the foot length and width, whereas changes to other critical foot dimensions, such as arch length, ball girth and height, have not been described. The small number of dimensions investigated limits the ability of these studies fully to characterize shape changes in a foot to improve footwear fit as many previous studies have shown that foot length and foot width are not sufficient to characterize the foot (Goonetilleke et al., 1997a; Xing et al., 2000; Hong Kong Productivity Council, 2001; Leng and Du, 2006). Using a factor analysis, Goonetilleke et al. (1997a) showed that, apart from foot length, at least two dimensions in each of the three regions of the forefoot, midfoot and rearfoot are required to understand foot shape. Thus the primary objective of this study is to use a set of foot dimensions to quantify changes in foot shape with weight bearing. Since no two feet are exactly alike (Rossi, 1983), the dimensional differences between the left and right feet are also investigated. As inversion (or supination where the foot is turned medially resulting in the sole moving inward) and eversion (or pronation where the foot is turned laterally, resulting in the sole moving outward) can lead to injuries (Howard, 2006), the natural tendency for the foot to evert or invert when bearing weight is investigated as well.
A second objective of this study is to investigate the relationship between foot size and demographics, such as stature and weight, so that foot impressions can provide anthropologists with useful information for the study of human evolution. Such information can also be quite useful for forensic investigations (Ashizawa et al., 1997; Fessler et al., 2005). Foot length is commonly said to be equal to 15% of body stature. This value is used in forensic practice to estimate stature from available footprints (Topinard, 1877). The foot length to stature ratio actually varies from around 14.3% to 15.89% for males and from 13.5% to 16.11% for females in different populations (Fessler et al., 2005). In this study, we compared the two primary dimensions of foot length and foot width to the stature and weight of the participants, who were all Hong Kong Chinese.
Thirty Hong Kong Chinese adults (15 males and 15 females) participated in this study. None of the participants had any foot or other physical defects. Twenty-eight participants were right-foot dominant. Foot dominance was determined by asking each participant which foot they prefer to use to kick a ball and which one had more power. Descriptive statistics of their age, stature and body weight are given in Table 1. This study was approved by the university’s research ethics committee on human subjects.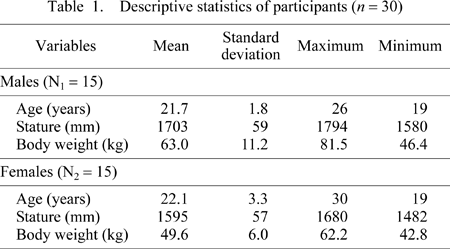
A Vorum YETITM I laser scanner (Vorum Research Corporation, 2000) was used to obtain the three-dimensional (3-D) surface shape of the foot. The scanner system is designed such that the coordinates of 360 points in each vertical cross-section spaced 1 mm apart are collected. Each scan takes less than 10 seconds. Laser scanning is ideal for this type of study due to the relatively short scanning time and the relatively good accuracy (±0.5 mm, according to Vorum Research Corporation, 2000). In addition, it is a non-contact method that does not distort the surface as point-by-point digitization techniques do. Luximon (2001b) performed extensive investigations on the accuracy and repeatability of the YETI scanner. One such test used a cylindrical bar 15 mm in diameter. The error in diameter within the scanner volume was reported to be less than 0.3962 mm. Another test of the scanner was conducted using a high-precision machined steel cylinder (100 mm diameter), adopting a procedure similar to that in Kouchi and Mochimaru (2001). The cylinder was scanned 10 times with the YETI scanner. The 3-D point cloud was then used to calculate the diameter of the cylinder. The diameter is calculated from the mean circumference of 10 randomly selected cross sections of each scan. The root mean square error for the diameter was 0.28 mm (0.28%). Witana et al. (2006) reported the length differences between manual measurements and scanned measurements to be less than 0.5 mm. The manufacturer’s specification of the scanner’s accuracy is actually quite conservative.
(a) Foot landmarking:
After both feet of each participant had been cleaned with warm water (25 ± 1°C) using a foot bubble roller massager (Evertop model ET-4085), nine anatomical landmarks were located on each foot (Figure 1) and 5 mm diameter black stickers were placed at these locations. They were placed at the most medial prominence of the first metatarsal–phalangeal joint (MPJ), on top of the first, second, third, fourth, and fifth MPJs, on the most lateral prominence of the fifth MPJ, on the most protruding point of the medial malleolus, and on the most protruding point of the lateral malleolus.
 View Details | Figure 1. Locations of nine anatomical landmarks on the right foot. Landmark 1: the most medial prominence of the first metatarsal–phalangeal joint (MPJ); landmarks 2–6: the top of the first, second, third, fourth, and fifth MPJs; landmark 7: the most lateral prominence of the fifth MPJ; landmark 8: the most protruding point of the medial malleolus; landmark 9: the most protruding point of the lateral malleolus. |
(b) Foot alignment and scanning:
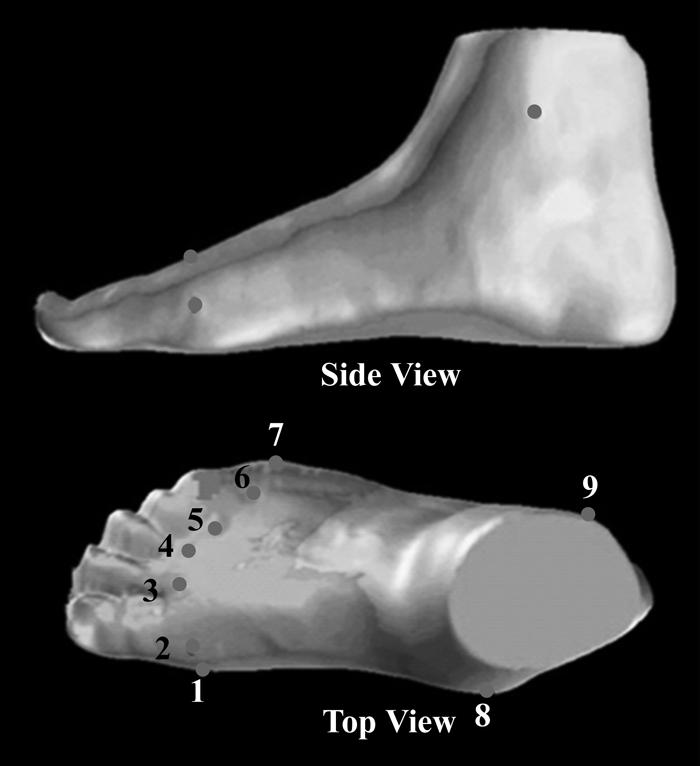
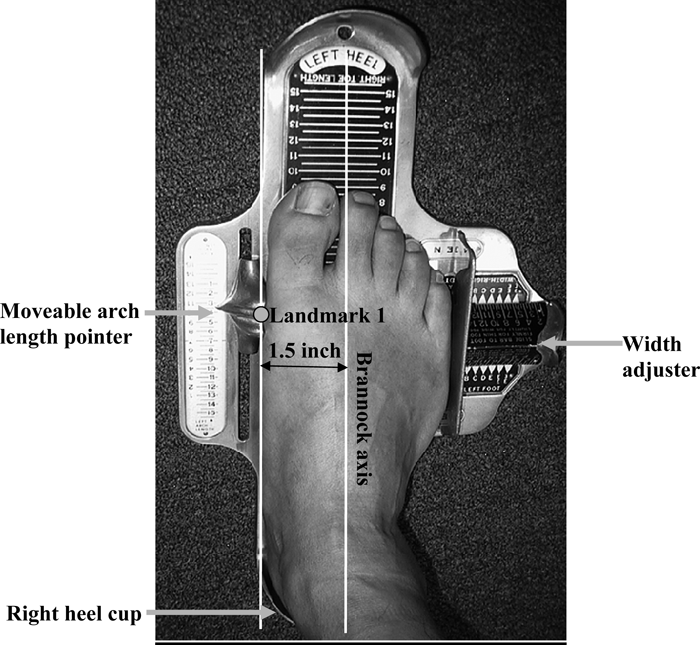
With the help of a series of symmetrical heel curves drawn on an alignment transparency, each participant’s foot was manually aligned so that the heel centerline was along the longitudinal axis of the scanner. Thereafter, the participant’s foot was rotated around the pternion region so that the distance between the most medial prominence of the first MPJ (landmark 1) and the centerline of the transparency was 38.1 mm (1.5 inches) so that the alignment simulated that of the Brannock device (Figure 2; Brannock, 2008), which is commonly used in shoe stores in the US and some other countries to measure feet. Prior to measuring the foot, the participant’s heel was located against the back of the symmetric heel cup and then the experimenter slid the moveable arch length pointer so that the inside curve of the pointer matched the most medial prominence of the first MPJ (landmark 1) of the foot. The distance from the inside curve of the pointer to the centerline of the symmetric heel cup was 1.5 inches (38.1 mm). This alignment was different from that commonly reported in the literature, which is a heel to second toe tip alignment, which we feel is not ideal as the axis of a foot is altered by the presence of bunions. After alignment, the participant’s foot was laser scanned under the three weight-bearing conditions of no body-weight (NWB), half body-weight (HWB), and full body-weight (FWB). In the NWB condition, the participant was seated with his/her foot just touching the scanner bed. In this condition, there is a very small load on the foot that cannot be measured. In the HWB condition, the participant stood on both feet with equal loads on each foot (monitored with a weighing scale under the non-scanned foot) and in the FWB condition, the participant stood on the foot being scanned with his/her hands resting on a support bar with hardly any force, as a stabilizer. Ankle posture is critical in this type of investigation and hence a specially designed jig (Figure 3) was used to help control the ankle posture in the medial–lateral and anterior–posterior directions under the three weight-bearing conditions. The lower L-shape plates were positioned against the foot with one touching the most medial side of the foot and the other the pternion as shown in Figure 3a and Figure 3b. The upper L-shape helps determine and fix the angle of the ankle by locking the connecting arm using the two screws. The same setting of this jig was used when scanning the foot in each of the three loading conditions (Figure 3c). To minimize any order effects, the scanning sequences of the three weight-bearing conditions and the side of the foot were randomized.
 View Details | Figure 2. Foot alignment on the Brannock device prior to measuring the foot. |
 View Details | Figure 3. Special jig designed for controlling ankle and lower leg posture. (a) The lower L-shape touches the medial side and the pternion; (b) the upper L-shape secures the ankle angle; (c) locking the connecting arm fixes the ankle angle. |
Nine foot dimensions were determined in each of the three weight-bearing conditions: foot length (FL), arch length (AL), foot width (FW), midfoot width (MFW), heel width (HW), midfoot height (MFH), medial malleolus height (MMH) of the most protruding point, lateral malleolus height (LMH) of the most protruding point, and ball girth (BG). The definitions of the dimensions are given in Table 2. These foot dimensions were chosen as they are known to be critical to foot–shoe fit and they also allow the foot shape to be characterized with at least two dimensions in each of the three regions of the forefoot, midfoot and rearfoot (Goonetilleke et al., 1997a). The nine foot dimensions were automatically determined from the foot scans with a C++ program (Witana et al., 2006; Zhao and Goonetilleke, 2006).
To evaluate foot rotation, the midfoot region was first determined. It was defined as the region between point P1 (the most medial prominence of the first MPJ) and P3 (Figure 4a). Point P3 is the intersection point of the sagittal plane foot outline with the XY plane, which is 20 mm above point P2 (the most protruding point of the medial malleolus). The midfoot was then subdivided into 10 equidistant parts (along the X axis; Figure 4a). Foot rotation was determined from the direction of the major principal axis, L1 (Daffertshofer et al., 2004), of each midfoot cross section (angle θ, Figure 4b), as proposed by Kouchi and Tsutsumi (2000). Angle θ was defined as the angle between the major principal axis of each 2-D midfoot cross section and the XY plane or the floor (Figure 4b) The mean angle, θ, of all cross sections within a part was used to represent the direction of the major principal axis.
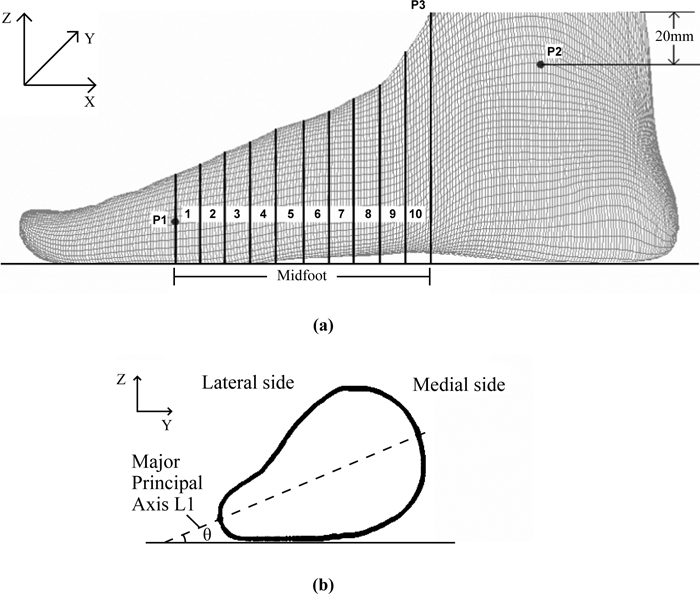 View Details | Figure 4. (a) Subdivision of right midfoot into 10 parts of equal length and (b) a cross section in the midfoot and the corresponding angle, θ. P1: the most medial prominence of the first metatarsal–phalangeal joint (landmark 1); P2: the most protruding point of the medial malleolus (landmark 8); P3: the intersection point of the sagittal plane foot outline with the XY plane and 20 mm above point P2; θ: the angle between the major principal axis (L1) of one 2-D midfoot cross section and the XY plane (floor). |
The SAS statistical package was used for all statistical analyses and the significance level was set at 0.05. The statistical analyses were performed for both males and females as there are significant gender differences in the size and shape of an adult foot (Wunderlich and Cavanagh, 1999, 2001).
The normality of the nine foot measurements under each of the three loading conditions (NWB, HWB and FWB) was tested for each gender using the Shapiro–Wilk test. The results showed that all foot measurements except for one were normally distributed (P > 0.05). The exception was the lateral malleolus height (statistic W = 0.874, P = 0.0392) of males under FWB. The homogeneity of the variance was checked using the Bartlett test (Bartlett, 1937), which showed no significant differences (at P = 0.05) among the three loading conditions in both the male and female data sets.
Thereafter, a two-way (weightbearing, participant) analysis of variance (ANOVA) with the post-hoc Student–Newman–Keuls (SNK) test was performed on the different dependent variables. The model (Montgomery, 2001) used for the tests was as follows:
Yij = μ + αi + βj + εij i = 1, ..., 3 and j = 1, ..., 15,
for both males and females, where Yij is the magnitude of foot deformation variable for the jth subject under the ith weight-bearing condition; αi is the effect of the ith weight-bearing condition and assumed to be a fixed factor; βj is the effect associated with the jth subject (a random factor); and εij is the random error.
Instead of pooling the left and right foot data together, only the data from the right foot of each participant were used in the above tests to minimize any dependent effects (Menz, 2004). The differences between the left and right feet were evaluated with paired t-tests using the HWB data. A two-sample t-test has one basic assumption in that the two tested samples should be drawn from independent populations (Montgomery, 2001). This assumption is not true in our study as both left and right feet belong to the same person. If a two-sample t-test were used, the lack of homogeneity between different persons would contribute to the variability of the foot measurements and would tend to inflate the experimental error, thus making the differences between the left and right feet more difficult to detect. A paired t-test can overcome this limitation by blocking or pairing and thus eliminating an additional source of variability between different persons. In addition, the paired t-test allows us to the check the range of the left-right differences among different people as well. A correlation analysis was performed to investigate the relationship between foot size, stature, and weight followed by a two-sample t-test to investigate the differences related to gender.
The descriptive statistics (mean, standard deviation, maximum and minimum) of the various foot dimensions under each weight-bearing condition are given in Table 3. The ANOVA revealed significant (P < 0.05) differences among the weight-bearing conditions of males and females in all dimensions except for the medial malleolus height dimension in females (Table 4).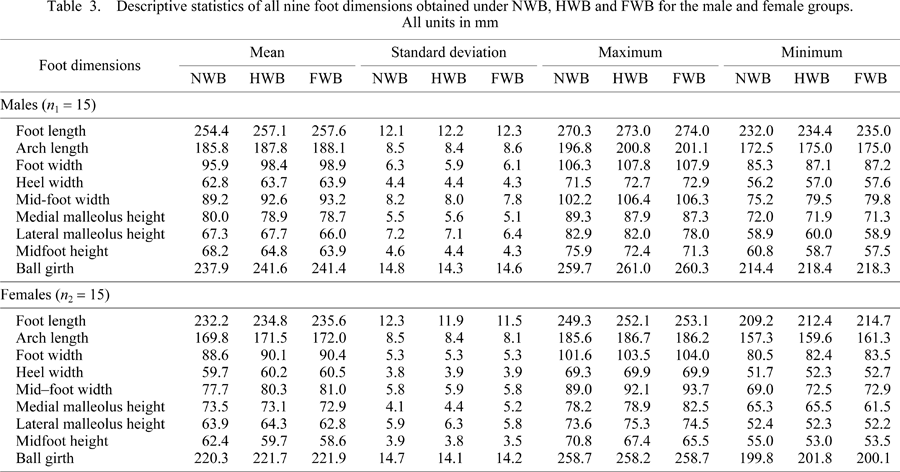
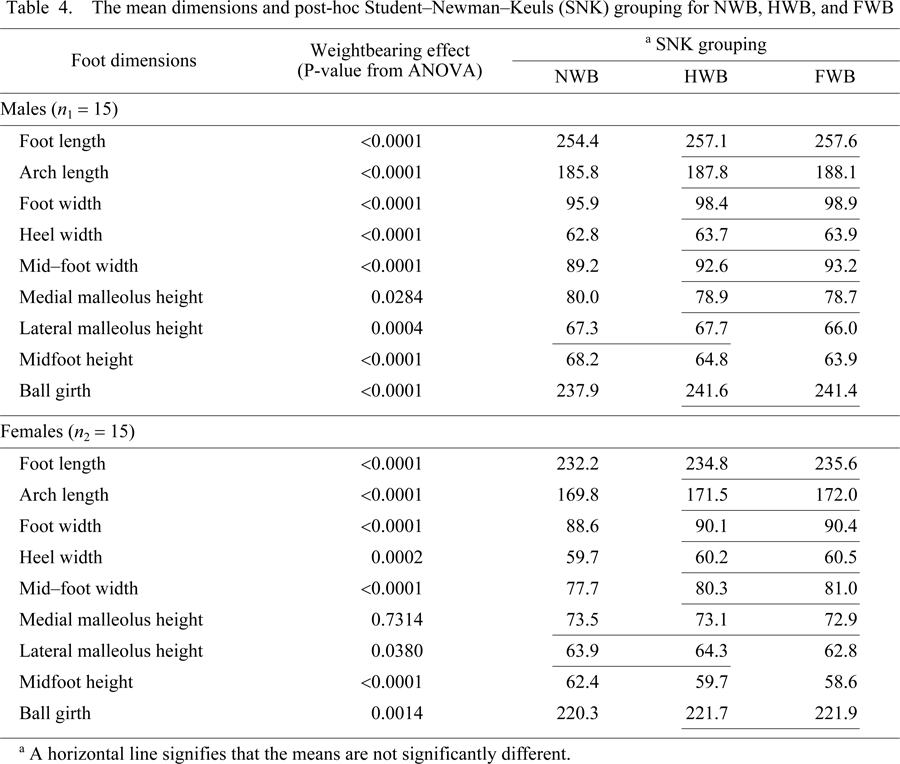
Figure 5 shows the percentage of changes of each foot dimension from NWB to HWB (Figure 5a) and from NWB to FWB (Figure 5b). It is clear that, with increased load on the foot, the length dimensions, FL and AL, the width dimensions, FW, MFW, and HW, and the ball girth dimension, BG, significantly increased. As a result, the height dimensions, MFH and LMH, showed significant decreases from NWB to FWB in males as well as females (Figure 5b). The reduction in the MMH dimension was not significant. The percentage changes of seven of the dimensions were less than 3.0%, while the two midfoot dimensions of MFW and MFH experienced larger percentage changes.
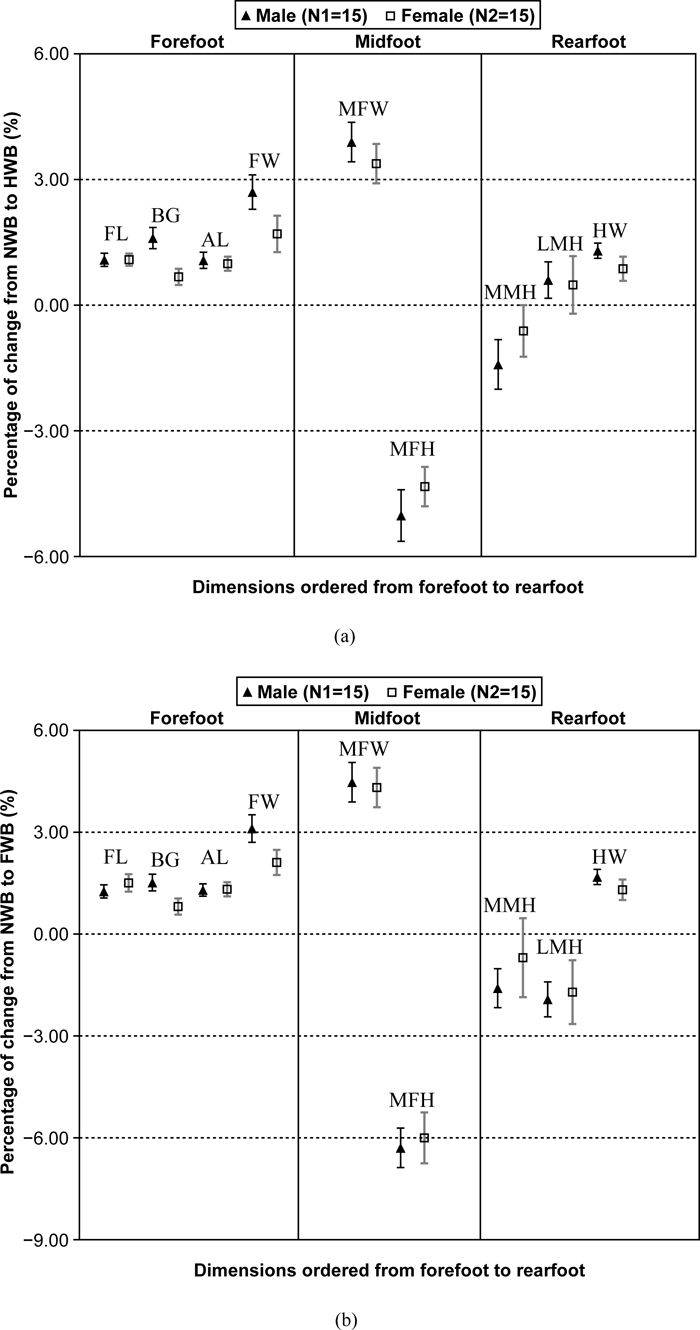 View Details | Figure 5. Mean percentage changes and standard errors of foot dimensions (see Table 2 for abbreviations) from (a) NWB to HWB and (b) NWB to FWB. |
From NWB to FWB, the males’ feet increased in length by 3.2 mm (1.3%) and the females’ feet increased by 3.4 mm (1.5%); the arch length increases were 2.3 mm (1.3%) and 2.2 mm (1.3%) for the males and females, respectively. The increases in width were also statistically significant for males as well as for females. The width increases for the male participants were: foot width 3.0 mm (3.0%), midfoot width 4.0 mm (4.5%), and heel width 1.1 mm (1.7%). The changes in the widths of female feet were 1.8 mm (2.1%) in foot width, 3.3 mm (4.3%) in midfoot width, and 0.8 mm (1.3%) in heel width. The three height dimensions decreased in both males and females except for the medial malleolus height in females. The height changes for the males were: midfoot height, −4.3 mm (−6.3%); medial malleolus height, −1.3 mm (−1.6%); lateral malleolus height, −1.3 mm (−1.9%); whereas the changes in the female feet were: midfoot height, −3.8 mm (−6.0%); lateral malleolus height, −1.1 mm (−1.7%). The mean ball girth increase was 3.5 mm (1.5%) in males and 1.6 mm (0.8%) in females.
The paired t-tests (Table 5) showed that there were no significant (P > 0.05) differences in the foot dimensions between the left and right feet except for the ball girth of the males and the heel width of the females. The ball girth of the right foot of the males was 2 mm larger than the left foot girth of the males. The right foot of the females had a significantly wider heel width than the left foot, with a mean difference of 0.6 mm. The lack of significant differences between the left and right feet is possibly due to the large variations between them. For example, in some participants, the differences between the left and right in the foot length, arch length, foot width, ball girth, medial malleolus height, lateral malleolus height dimensions were as much 4.6 mm (2.0%), 9.5 mm (5.5%), 3.6 mm (3.4%), 8.3 mm (3.9%), 7.1 mm (9.2%), 10.9 mm (15.4%), respectively (Table 5).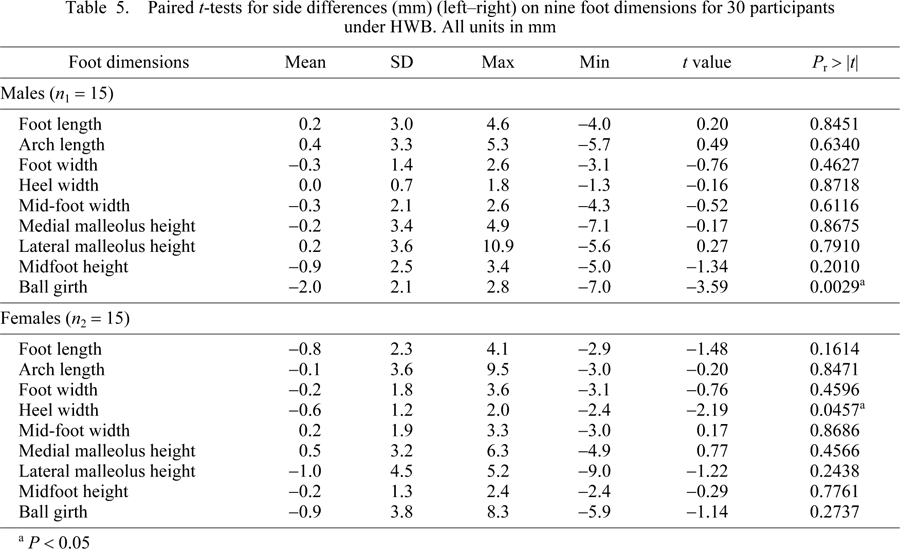
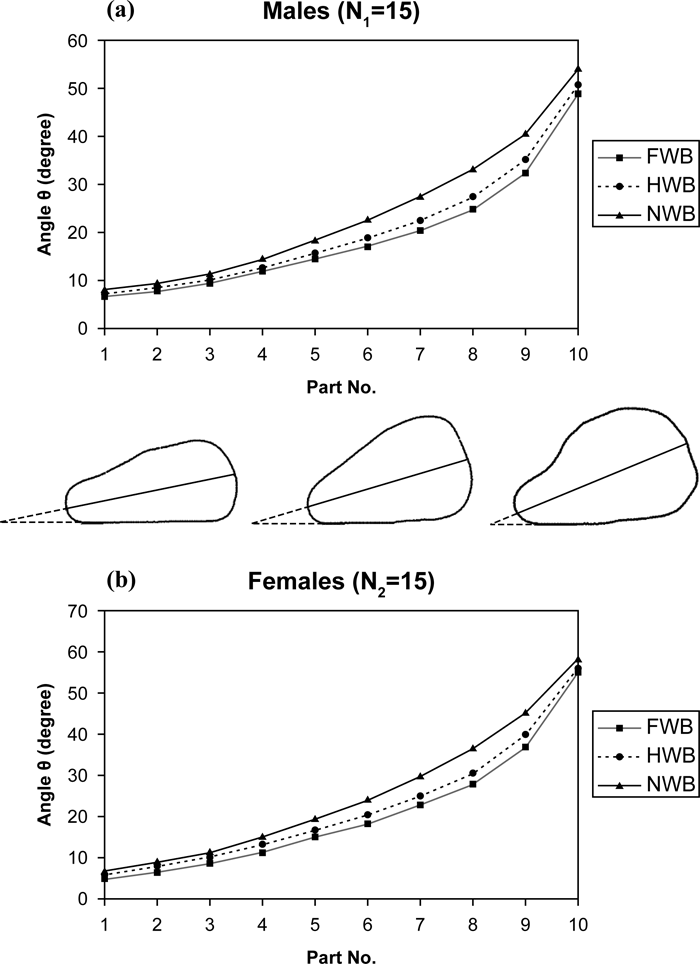
Figure 6 clearly shows that the angle, θ, indicating the direction of the major principal axis, reduces from NWB to HWB to FWB in each of the 10 parts of the midfoot, and these changes were significant (P < 0.0001) except for the last part (10th part) for the females (P = 0.0831). From NWB to FWB, the angle, θ, reduced by 1.7–8.4° (9.6–21.9%) in males and 2.0–8.3° (5.5–28.3%) in females. This reduction in θ indicates that the foot rotates towards the medial side (rolling-in) with increasing load (Figure 7).
 View Details | Figure 6. Mean angle, θ (i.e. the direction of the major principal axis) of cross sections in 10 midfoot parts in (a) males and (b) females. |
 View Details | Figure 7. Illustration of the rotation of the right foot to the medial side (eversion) in a cross section at the center of the fifth midfoot part of a participant. |
A correlation analysis (Table 6) was performed to identify the relationships between foot length and stature and between foot width and weight. The analysis showed that at each of the loading conditions, there exists a significant (P < 0.05) and a relatively strong correlation (r > 0.65) between foot length and stature for both males and females. It is interesting to note that there exists a strong (r > 0.70) and significant correlation between foot width and the weight of males but the same is not true for females. In other words, there is no relation between the foot width and the weight of females. Further study is needed to evaluate the exact reason for this observation. One hypothesis is that a threshold weight may be necessary for any relationship between foot width and weight as an increase of foot width is one of the means to increase surface area and thereby reduce pressure on the foot.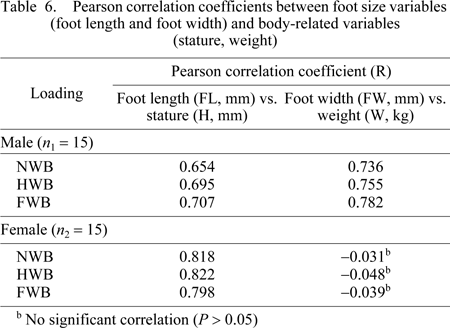
As the foot length increases with loading, the foot length as a percentage of stature increases as well as the stature is a constant (Table 7). The percentage for Hong Kong males is 14.94% (SD = 0.54) at NWB, 15.10% (SD = 0.51) at HWB and 15.13% (SD = 0.51) at FWB. These values are significantly higher (two-sample t-test with P ≤ 0.05) than the corresponding values for the females (14.56% with SD of 0.45 at NWB, 14.72% with SD of 0.43 at HWB and 14.77% with SD of 0.44 at FWB). The males however, have significantly smaller (P < 0.05) foot width to body weight ratios than the females (Table 7). An allometric analysis showed that foot width is proportional to the fourth root (~1/0.26) of weight for the males. The ratio of foot width to the fourth root of weight showed no gender differences (P > 0.05) (Table 7).
This study quantified foot deformations under different weight-bearing conditions. The results show that when the load on the foot increased from no body-weight to half-body-weight to full-body-weight (Table 4), the foot increased in length, became wider and reduced in height and rotated to the medial side (everted). The midfoot had relatively larger percentage changes in the width and height dimensions when compared to the forefoot and rearfoot. The changes with increased load can be attributed to structural deformation from weight bearing on the foot skeleton. The body weight passes from the talus to the other bones, with the calcaneus acting as a support strut, flattening both the medial longitudinal arch and the transverse arch (Levangie and Norkin, 2001). This mechanism results in a reduction in the height of the medial longitudinal arch with a related increase in the length, while the transverse arch becomes lower and wider. These structural changes result in an increase in foot length and arch length, an increase in foot width, midfoot width, and heel width, but a decrease in midfoot height, medial malleolus height, and lateral malleolus height. The talus is generally more to the medial side of the foot (Figure 8) and hence the load passing through the talonavicular joint tends to be about double the load passing through the calcaneocuboid joint (Levangie and Norkin, 2001). Consequently, the medial side of the foot is loaded more than the lateral side, thus causing a rotation towards the medial side (smaller angle θ). The relatively larger changes seen in the midfoot can be attributed to the presence of the medial longitudinal arch and the transverse arch in this region.
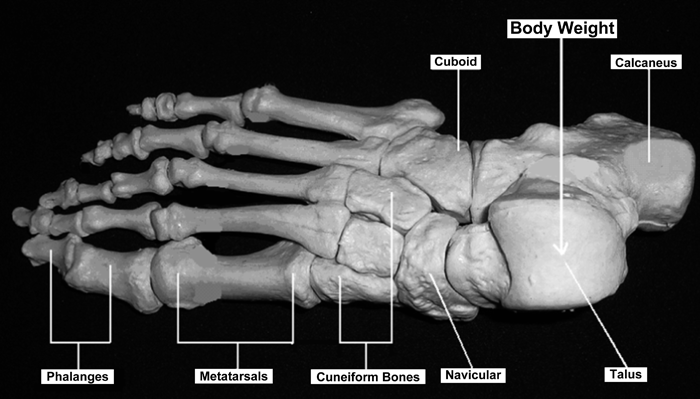 View Details | Figure 8. Top view of the foot skeleton. |
Foot orthotics are generally used for a number of reasons such as relieving high pressure on the foot and for preventing over-eversion and over-inversion (Reiber et al., 1997; Huppin and Hale, 2008). The foot mold of an orthotic is generally made without any load on the foot. This study has shown that when the foot is loaded from NWB to FWB, the foot tends to evert by an angle of 8.3° in females and 8.4° in males within the midfoot parts 7–9. How such a change should be designed into orthotics requires further study. In this study, we did not categorize the participants as pronators or supinators and as a result we are unable to quantify the amounts of foot rotation in these groups, which may be quite different to what we have seen in this study. Given the amounts of foot rotation upon weight bearing, it may be more appropriate to fabricate foot molds in a HWB condition to reduce the stress on the foot and to alleviate peak pressure as well (Tsung et al., 2004).
The literature on foot deformations with weight bearing has been somewhat inconsistent and even contradictory. For example, when adult (age ≥ 18) feet were loaded from NWB to HWB, Carlsöö and Wetzenstein (1968) found no change, while Rossi (1983) reported a 4.2 mm (1.7% if the mean of the participants’ foot length was assumed as US women’s size 7, which corresponds to approximately 241 mm) increase in foot length in 85% of American women. Cheng et al. (1997) observed a 3.14 mm (1.2%) increase in foot length for males and a 3.26 mm (1.4%) increase for females, but Tsung et al. (2003) reported a 6.3 mm (2.7%) increase in foot length. In this study, we found the increase in foot length was significant at 2.7 mm (1.1%) for males and 2.6 mm (1.3%) for females when the load on the foot increased from NWB to HWB. The amounts of foot length change found in this study are somewhat smaller but comparable to those reported by Cheng et al. (1997). The difference between our results and those reported by Rossi (1983) can be attributed to the participants, who were white Americans in Rossi’s study and Hong Kong Chinese in our study, and to the flat ruler used in Rossi’s study, which had markings spaced at 1/8 inch (around 3.2 mm). The reported change by Tsung et al. (2003) is relatively large as well: 6.3 mm (2.7%) in foot length. Six of the eight participants in Tsung et al.’s study were over 40 years old, while those in our study were much younger (21.7 ± 1.8 for males and 22.1 ± 3.3 for females). Muscle strength and functionality deteriorate after the fourth decade (Abdulwahab, 1999) and these changes, in addition to the measurement techniques used, may have led to the larger changes of foot length in the participants in the Tsung et al. (2003) study.
All the deformations on the feet found with loading imply that footwear has to accommodate these changes for the foot to function well. This could be done by incorporating sufficient allowances for the foot to expand or by selecting material that has sufficient flexibility to accommodate these foot deformations. Most leather upper materials have sufficient adaptability and stretchability and are suitable for footwear especially since dimensional changes are relatively small and within 3.0%, except for the midfoot height and the midfoot width, when the forces on the foot increase from no load (NWB) to full weight bearing (FWB) (Figure 5). If materials such as polyvinyl chloride (PVC), urethane, poromeric and others, which have poor stretchability, are used to make low-cost footwear, then the shoe design should incorporate sufficient tolerances to allow the foot to expand under weight-bearing conditions (Kouchi, 1995).
Even though both the arch length and foot length change with weight bearing, the arch-length-to-foot-length ratio appears to remain relatively constant: 73.0%, 73.1%, 73.0% under NWB, HWB, FWB, respectively, for males, and 73.1%, 73.0%, 73.0%, respectively, for females. Reanalysis of available data reported in previous foot anthropometry studies (US Armored Medical Research Laboratory, 1946; Goonetilleke et al., 1997b; Kouchi, 1998; Xing et al., 2000; Luximon and Goonetilleke, 2003b) shows an almost identical result (Table 8). Hong Kong Chinese appear to have a 73.0% ratio while the variation among different ethnic groups seems to range from 71.8% to 73.1% in both male and female adults. Thus, the flex line of a shoe corresponding to that of the ball line of a foot can be placed quite easily relative to this mean value once the foot size or foot length of a person is known (Mochimaru and Kouchi, 2003).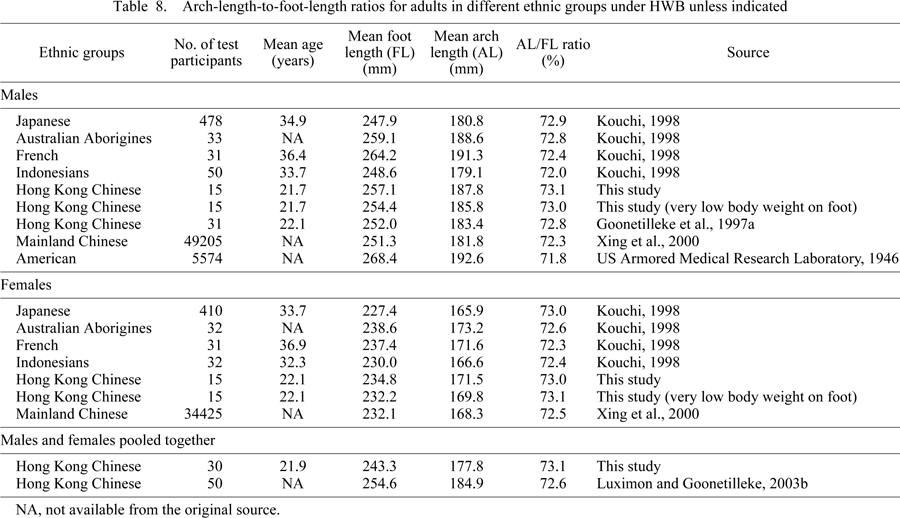
Other consistencies between our results and those of Cheng et al. (1997) include the lack of any significant difference between the left and right feet of a person. However, some participants exhibited considerable differences in foot length, arch length, foot width, ball girth, medial malleolus height, and lateral malleolus height between the left and right feet (see the maximum and minimum values of the differences in Table 5). Hence, it is always good practice to check the fit of both shoes prior to purchasing footwear.
The foot length changes during loading can be characterized relative to the stature of a person. They were 14.94% (14.56%), 15.10% (14.72%), and 15.13% (14.77%) with no load, half-body-weight, and full-body-weight on each foot for males (females). Robbins (1986) derived foot size variables from footprints and found that the foot-length-to-stature percentages were 15.128% and 14.726%, respectively, for males and females over 14 years old. All of these values are comparable to the 15% suggested by Topinard (1877) and between those reported in Fessler et al. (2005). No data seems to be available on relationship between foot width and body weight. However, this relationship may also have potential for use in forensic practice, such as estimating a suspect’s weight based on the footprint left on a site (Robbins, 1986). We found that the foot-width-to-body-weight ratios for Hong Kong Chinese are around 160% for males and 184% for females. Even though foot width was correlated with the weight of the male participants, no such correlation was observed in the female participants. We hypothesize that there may be a threshold weight above which the foot width becomes proportional to body weight. More studies across different populations are warranted to establish ‘standard’ values.
This study is not without its limitations. The changes reported were determined when the person was standing and the changes may be different during activity as the loads on the foot can be higher than the body weight during activity (walking, running, jumping, etc.). Further investigation may be required to identify foot deformations under high load conditions.
The authors would like to thank the Research Grants Council of Hong Kong for funding this study under grant HKUST 613406.
|