| * Correspondence to: Hajime Ishida, Department of Anatomy, Faculty of Medicine, University of the Ryukyus, Uehara 207, Nishihara, Okinawa 903-0215, Japan. E-mail: ishidaha@med.u-ryukyu.ac.jp Published online 30 April 2009 in J-STAGE (www.jstage.jst.go.jp) DOI: 10.1537/ase.081219 |
The Japan Islands, Sakhalin, and the Kurile Islands are situated east of the Asian continent on the western rim of the circum-Pacific region. This geographic location caused the Jomon, the prehistoric hunter-gather inhabitants of the Japan Islands during the period 12000–2300 BP, to retain archaic morphology even in the Neolithic Age (Kamminga, 1992), whereas the neolithic inhabitants of the East Asian continent already showed the distinct modern East Asian morphology, e.g. a high and flat face (Yamaguchi, 1982; Brown, 1999). Cultural connections between the Japanese Islanders and Northeast Asians are recorded in archeological materials, such as the Paleolithic microblade industries (15000–12000 BP) and Mesolithic blade arrowhead cultures (10000 BP), thus suggesting a northern origin of the Jomon people (Kikuchi, 1999; Omoto and Saitou, 1997); however, there are conflicting views on the origin of the Jomon, such as hypotheses postulating a southern root (Turner, 1987, 1990).
Hanihara K. (1991) proposed the “dual structure model” for Japanese population history, namely that the rice-farming Yayoi people migrated to the Japan Islands from the East Asia continent, possibly via the Korean peninsula, during the period 2300–1500 BP, establishing the genetic and physical bases of the modern main-island Japanese, and that the Ainu, living on the Hokkaido Island, retained relatively more Jomon traits. The Yayoi immigrants showed clear modern East Asian features (Nakahashi and Li, 2002). Although the basic approach of this model is quite valid, the dual-structure hypothesis is too simple to explain the population history for all of the Japan Islands (Haneji et al., 2007; Toma et al., 2007); in particular, after the Yayoi immigration to the Japanese main islands, the people of the Okhotsk culture came from northeastern Asia to the Sakhalin and Hokkaido Islands during the 5th–12th centuries AD (Kikuchi, 1999; Amano, 2003). Archeological evidence and isotopic analysis show that the Okhotsk culture had developed a considerable maritime infrastructure (Yoneda, 2002). The Okhotsk people possessed the features typical of the northeastern Asian population series, e.g. metrically expressed by a large, high face, flat nasal bones, and large maxillary and zygomatic bones (Kodama, 1948; Yamaguchi, 1974; Ishida, 1988), and nonmetrically by a high frequency of the supraorbital foramen, hypoglossal canal bridging, transverse zygomatic-suture vestige, and mylohyoid bridging (Kozintsev, 1990, 1992; Ishida, 1996; Komesu et al., 2008). Recent analyses of mitochondrial DNA (Sato et al., 2007) and nonmetric cranial traits by application of the R-matrix method (Komesu et al., 2008) reconfirmed the close relationships of the Okhotsk prehistoric series with those of the lower Amur River basin, and furthermore suggested possible relationships to more northern Asians, including the Koryak (north of Kamchatka). Additionally, considerable genetic and phenotypic contributions to the recent Ainu were also revealed.
These repeated cultural contacts and possible human migrations from the north may have had a significant influence on Japanese population history, although no apparent cultural expansions from the south, such as from island and mainland southeastern Asia, are currently documented. However, not only the relationships between the Okhotsk, Ainu and neighboring peoples but overall relationships between the northeastern Asian and Japan Islands populations must be analyzed using both recent and prehistoric samples to explain Japanese population diversity. Debets (1951) divided the recent northeastern Asians into three major groups: the Arctic group (Asian Eskimo, Chukchi, Aleut), the Baikal group (Ulch, Nanay, Negidal, Evenki, Yukagir), and the Inland Asian group (Mongolian, Buryat, Yakut). The validity of this grouping was confirmed by other Russian researchers (Alekseev, 1979; Kozintsev, 1988) and the first author (Ishida, 1997). In addition, many human skeletal remains of the Neolithic age (5000–3000 BP) have been recovered in the Lake Baikal region (Debets, 1951; Ishida, 1995). Arctic samples from the Iron Age (2000 BP) were excavated at the Ekven site in the Chukotka peninsula (northeastern-most Far East) (Debets, 1975). Cranial series from the Troitskoe site (the Mo-ho culture, 1500 BP) were recovered from the middle Amur River Basin (Alekseev, 1980).
The first author and co-workers have investigated the migration and differentiation patterns of the northeast Asian populations from analyses of craniometric and nonmetric traits (Ishida, 1990, 1992, 1993, 1994, 1995, 1996, 1997; Ishida and Dodo, 1996; Hanihara et al., 2003; Komesu et al., 2008); however, most of these phenotypic variations were analyzed by classical multivariate methods such as the Mahalanobis’ generalized distance analysis using only male series.
Recently, the standard relationship matrix (R-matrix) analysis was applied to examine relationships within and among populations (Harpending and Ward, 1982; Relethford and Blangero, 1990; Relethford and Harpending, 1994). While the R-matrix method was initially developed for analysis of genetic trait frequencies (Harpending and Ward, 1982), Relethford and Blangero (1990) extended the model to quantitative morphological traits. The results of the R-matrix method should be based on average heritabilities because craniometric traits as well as other phenotypic traits are not completely under genetic control. The effects of differential external genetic contribution can be assessed by comparing observed and expected variances (Relethford and Balngero, 1990). Thus, the R-matrix method may give a more accurate representation of population history than classical methods (Komesu et al., 2008). As a result, many researchers, including us, now use this method to elucidate probable human history and to compare variances within and among geographical groups (Relethford, 1991, 1994; Relethford and Harpending, 1994; Powell and Neves, 1999; Steadman, 2001; González-José et al., 2003; Roseman and Weaver, 2004; Stojanowski, 2004, 2005; Hanihara and Ishida, 2005; Schillaci and Stojanowski, 2005; Komesu et al., 2008; Hanihara, 2008; Hanihara et al., 2008).
In this study, we aimed to elucidate the phylogenetic relationship between the Japan Islanders and northeast Asians by application of the R-matrix method using sufficient female and male craniometric data, including newly acquired Okhotsk series data. We also evaluated phenotypic variations among the prehistoric and historic Japan Islanders.
Table 1 summarizes the sample sizes of each sex, location (islands), and site names of the Okhotsk cranial series (for details, see Komesu et al., 2008). We are fortunate to be able to add significant new data from the cranial series of the Moyoro shell mound, Susuya shell mound, and Hamanaka sites stored in Hokkaido University Museum (Komesu et al., 2008; Hanihara et al., 2008), compared with the previous paper (Ishida, 1996). The Okhotsk cranial samples were divided into two regional sub-cultural groups, the Northern Okhotsk and Eastern Okhotsk, based on ceramics, metal ornaments, and burial patterns (Ono and Amano, 2007).
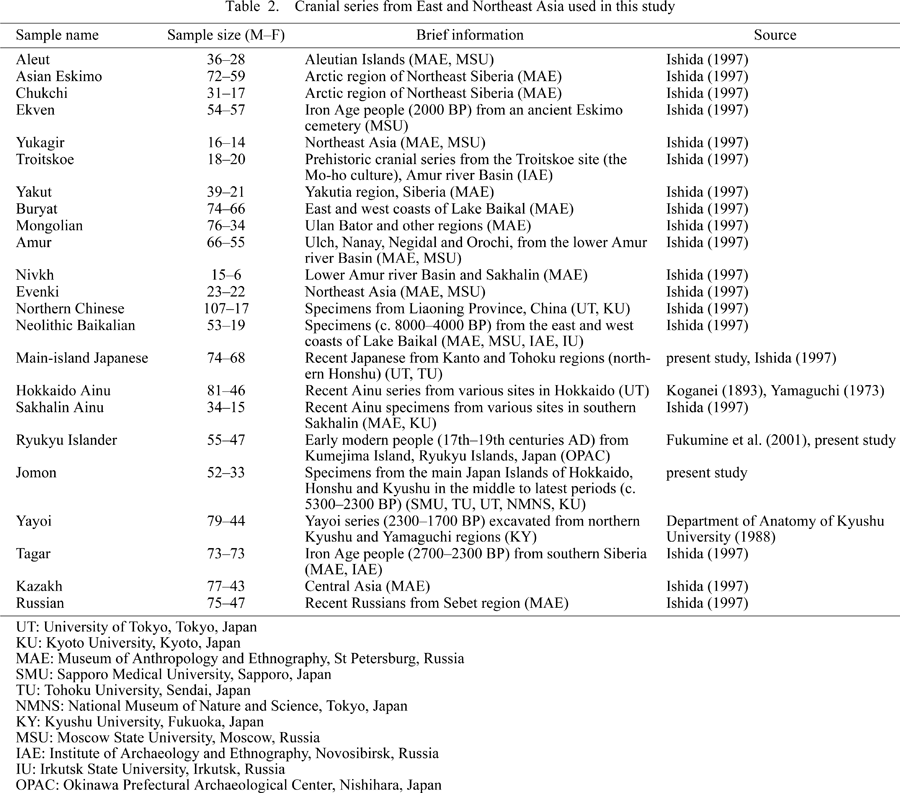
The other samples used in this study consist of the following 23 groups: Aleut, Asian Eskimo, Chukchi, Ekven (Iron Age), Yukagir, Troitskoe (Mo-ho culture), Yakut, Buryat, Mongolian, Amur (Nanay, Negidal, Oroch, and Ulch), Nivkh, Evenki, Northern Chinese, Neolithic Baikalian, modern main-island Japanese, Hokkaido Ainu, Sakhalin Ainu, Ryukyu Islander, Jomon, Yayoi, Tagar (Iron Age), Kazakh, Russia. The sample sizes of each sex and brief information are provided in Table 2 and Figure 1, and in our previous papers (Ishida and Dodo, 1996; Ishida, 1997; Fukumine et al., 2006; Komesu et al., 2008).
 View Details | Figure 1. Location of the northeastern and eastern Asian cranial series used in the present study. Prehistoric cranial series are shown in italics. |
For craniometric analysis, we used 21 measurement items (Table 3). The first author (H.I.) measured almost all cranial samples although a few data were obtained by the second (T.H.), third (O.K.), and fourth (T.F.) authors. T.H., O.K. and T.F. measured the female data of modern main-island Japanese, the Jomon, and the Ryukyu data, respectively. The metric data of the Hokkaido Ainu were quoted from Koganei (1893) and Yamaguchi (1973) and that of the Yayoi from the Department of Anatomy of Kyushu University (1988). Because we followed the method of Braüer (1988), inter-observer errors were minimal and could be ignored.
A modification of Wright’s Fst statistic, or R-matrix method, developed by Relethford and Blangero (1990), Relethford (1994), and Relethford and Harpending (1994), was used for both male and female samples in order to compare variance within and among prehistoric and historic groups. Because computation of the R-matrix method requires census population sizes of samples, it is better to adopt relative population weights (Hanihara et al., 2008). However, in this study we calculated the R-matrix under the assumption of equal effective population size because of lack of adequate information on population sizes. As a result, the distance matrix transformed from the R-matrix is not very different from that of classical multidimensional methods (e.g. Relethford and Harpending, 1994; Komesu et al., 2008). We selected an estimate of average heritability for craniometric traits of 0.55 to compute the R-matrix, as previously described (Hanihara et al., 2008). In order to represent mutual relationships, the multidimensional scaling method was applied to the distance matrix transformed from the R-matrix.
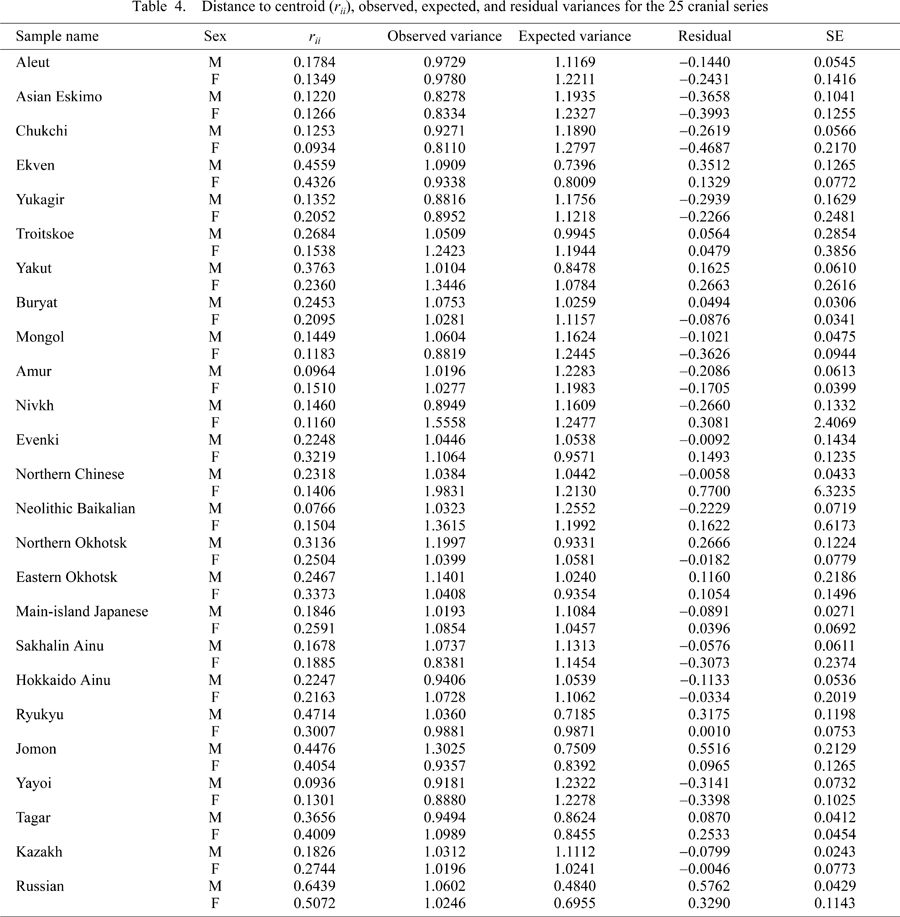
Table 4 gives the results of Relethford and Blangero’s (1990) method, estimating rii values (genetic distance from the centroid) and intra-regional variation under the assumption of equal effective population size based on 21 craniometric traits in 25 male and female samples. Figure 2 shows the relationship between the observed variance and rii values with the expected regression line for males and females based on Table 4. The patterns of the two graphs (males and females) are fairly consistent. The prehistoric series generally show an observed variance greater than the expected variance, suggesting an external genetic contribution. For example, there is greater observed variation than expected in the Okhotsk series, whereas the recent Ainu series showed less than expected variation, or lower genetic variability. Moreover, the greater phenotypic variation of the Iron Age Ekven is in strong contrast to the lower levels of variation seen in the modern Arctic series of the Asian Eskimo, Chukchi, and Aleut in both sexes. Interestingly, the Yayoi, possible immigrants to the Japan Islands from continental Asia, show less phenotypic variability than expected, indicating a founder effect, compared with the greater variation seen in the Japan Islands Jomon.
 View Details | Figure 2. Plot of observed phenptypic variance vs. genetic distance from the centroid (rii) for 25 northeastern and eastern Asian series. The line indicates the expected regression line derived from Relethford and Balngero’s (1990) model. |
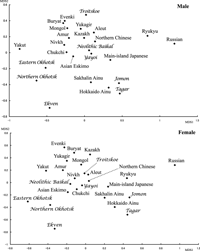
Figure 3 shows the plot on the first and second coordinates of the multidimensional scaling of distances transformed from the R-matrix using the average heritability rate (h2) = 0.55 (data not shown), expressing more than 70% of the total variation. The two graphs showing results of each sex are remarkably consistent. The eastern and northeastern Asian samples of both sexes are situated around the center or in the slightly upper area in the figure. The Iron Age Ekven and Okhotsk series are scattered in the lower left corner. The Okhotsk series are close to the Arctic peoples, and to the Nivkh and Amur. Other samples from the Japan Islands are located in the lower right portion, suggesting considerable cranial diversity, particularly in the male series, because of separation of the Ryukyu Islanders in the southernmost islands of Japan. The Jomon show a close relationship to the Iron Age Tagar from southern Siberia. On the other hand, the Yayoi, included in the eastern Asian cluster, are close to the Northern Chinese and Neolithic Baikalian. The modern main-island Japanese are plotted between the Yayoi and Jomon, supporting the “dual-structure model” for Japanese population history by Hanihara K. (1991). The Ainu series, the Sakhalin Ainu in particular, are shifted towards the prehistoric northeastern groups of the Okhotsk and Ekven, as mentioned previously (Shigematsu et al., 2004; Hanihara et al., 2008; Komesu et al., 2008).
 View Details | Figure 3. Plot of the first and second coordinates of the multidimensional scaling analysis based on the distance matrix transformed from the R-matrix. |
Although the recent northeastern Asians, especially females, are roughly lumped into Arctic, Inland Asian, and Baikalian groups, the Iron Age Ekven is isolated from the others, due to their hyperdolichocrany (Ishida, 1997), being close only to the Okhotsk series. In contrast, inland prehistoric samples of the Neolithic Baikalian and Troitskoe are located in the recent northeastern Asian groups.
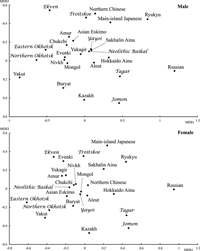
Figure 4 shows the plot on the first and third coordinates of the multidimensional scaling of distances transformed from the R-matrix. The Jomon, closely related to the Tagar especially in females, are more distant from the Hokkaido and Sakhalin Ainu.
 View Details | Figure 4. Plot of the first and third coordinates of the multidimensional scaling analysis based on the distance matrix transformed from the R-matrix. |
Table 5 shows intra-regional variation of the five major regional series in order to compare craniometric diversity in the Japan Islands with that of the other regions. The observed variations are high in the far-eastern or peripheral Japan Islands series of each sex, whereas similarly peripheral Arctic and Coastal northeastern Asian samples have lower levels of observed variation than the Japan Island series.
The multidimensional scaling of distances transformed from the R-matrix shows that the eastern and northeastern Asian samples of both sexes are situated around the center with geographic subdivision (Figure 3), as mentioned previously (Ishida, 1997). Moreover, the R-matrix analyses show that the Japanese series representing a circumscribed geographic area of small islands have greater craniometric diversity than Arctic and Coastal northeastern Asian samples spanning a vast area (Figure 3, Figure 4, and Table 5). We consider several factors to have caused this diversity.
First, we have to consider the Jomon characteristics (Yamaguchi, 1982, 1992; Komesu et al., 2008; Hanihara and Ishida, 2009). Although regional groups of the Jomon show rather low observed variances, except for the Hokkaido area (Hanihara and Ishida, 2009), the Jomon sample, here collected from throughout the Japan Islands, shows greater phenotypic variation (Table 4 and Figure 2). This coincides with the observed heterogeneity of the Jomon people based on the estimated Fst (Hanihara and Ishida, 2009) and from analyses of mitochondrial DNA sequences (Adachi et al., 2009). In addition, as shown in Figure 3 and Figure 4, the Jomon resembles the Iron Age Tagar from southern Siberia, who have European features, although the relationship between the Ainu and Tagar was not clearly demonstrated in the previous analyses which did not include the Jomon series (Ishida, 1996, 1997). Possible relationships among the Jomon (and/or Ainu), prehistoric Europeans, and prehistoric Americans have repeatedly been suggested (Yamaguchi, 1982; Brace et al., 2001; Tokunaga et al., 2001; Jantz and Owsley, 2003; Hanihara and Ishida, 2009) because of lack of craniofacial modernization or gracilization in the Jomon (Suzuki, 1981; Yamaguchi, 1982). This study also supports such an interpretation, although other studies show Jomon affinities with other populations, such as northeastern Asians (Komesu et al., 2008; Matsumura et al., 2009).
The greater than expected variation shown in Jomon is in stark contrast with the lower level of variability seen in the Yayoi in terms of both craniometry (this study, Figure 2) and nonmetric cranial traits (Komesu et al., 2008). Because the Yayoi are regarded as immigrants from the East Asian continent and/or their descendants, it is reasonable that their lower level of phenotypic variation was caused by a founder effect at the time of immigration, stemming from the small population size of the initial immigrants, as Nakahashi and Iizuka (1998) suggested.
We have shown here the first evidence for a low level of phenotypic variation of the Yayoi by means of the R-matrix method; however, the phenotypic contribution of the Yayoi to the main-island Japanese population was greater than that of the Jomon, as judged from the close phenetic relationship between the Yayoi and modern main-island Japanese based on distance matrix (data not shown) and Figure 3. The existence of successive immigrants after the Yayoi period (Hanihara K., 1987) and/or a higher growth rate of the Yayoi immigrant group (Nakahashi and Iizuka, 1998) might have resulted in this phenomenon. When only the Jomon, Yayoi, and modern main-island Japanese are considered, the simple “dual-structure model” (Hanihara K., 1991) adequately explains Japanese population history.
The recent Ainu and Ryukyu Islanders exhibit considerable cranial divergence from the modern main-island Japanese, as shown in Figure 3. Although the two Okhotsk series are far from the other Japanese samples, the Ainu are rather closer to the Okhotsk. The view that the Jomon in Hokkaido were the probable major ancestors of the Ainu has been supported by many researchers (e.g. Turner, 1976; Yamaguchi, 1982; Ishida, 1990, 1992, 1993; Kozintsev, 1992; Ishida and Dodo, 1997; Pietrusewsky, 1999, 2000, 2004; Dodo and Kawakubo, 2002; Shigematsu et al., 2004; Fukumine et al., 2006; Ossenberg et al., 2006). Dodo and Kawakubo (2002), as well as the simple “dual-structure model” (Hanihara K., 1991), hypothesized that the Ainu in Hokkaido are the direct descendants of the Jomon without the effects of admixtures such as from the Yayoi. Unfortunately, they did not include the prehistoric northern series, such as the Okhotsk, in their analyses. On the other hand, previous morphological and genetic studies have also suggested that the Ainu has affinities with northern populations (Cavalli-Sforza et al., 1988; Kozintsev, 1990; Ishida, 1996; Omoto and Saitou, 1997; Bannai et al., 1999; Tokunaga et al., 2001; Shigematsu et al., 2004; Tajima et al., 2004; Tanaka et al., 2004; Hammer et al., 2006; Fukumine et al., 2006). Our present results, as well as other recent studies, reveal that this northern affinity of the Ainu was partly caused by direct genetic contribution through the Ohohsk people (Sato et al., 2007; Hanihara et al., 2008; Komesu et al., 2008).
The Ryukyu Islanders were also considered probable descendants of the Jomon people according to the “dual-structure model”; however, successive Japanese migration and/or genetic contribution from the south probably contributed to phenotypic changes leading to the recent Ryukyu Islanders (Hatta et al., 1999; Fukumine et al., 2006). Because of the northeastern continental scope of the present study, no comparative samples from southeastern Asia were included so that hypotheses of genetic contribution to the Ryukyu Islanders could not be specified; however, the greater phenotypic variance seen in the Ryukyu Islanders in this study (Table 2) and other studies (Haneji et al., 2007; Toma et al., 2007; Komesu et al., 2008) supports a possible external genetic contribution in the Ryukyu Islanders.
In contrast, the Arctic samples show less than expected variation (Table 5), suggesting a founder effect and small population size (Relethford, 1994). When examined closely, the Iron Age Ekven has greater observed variation, whereas the recent Asian Eskimo, Chukchi, and Aleut apparently lost some phenotypic variability (Table 4). Despite the restricted geographic area under consideration, this may be a case of an ancestral population migrating into different areas with reduction of phenotypic variability, as suggested to have occurred on a world-wide scale (Manica et al., 2007).
R-matrix analyses based on male and female craniometric data revealed a high level of phenotypic variation in the inhabitants of the Japan Islands, which strongly contrasts with the lower level of variations seen in the Arctic and Coastal northeastern Asian samples. This Japanese craniometric diversity was probably caused by the following: (1) the outlying Neolithic Jomon retains aspects of an archaic and general morphology of earlier Homo sapiens; (2) continental Yayoi immigrants from eastern Asia mainly contributed to the formation of the modern main-island Japanese phenotype; (3) the northern Okhotsk cultural people influenced the Ainu phenotype to a lesser extent; (4) the Ryukyu Islanders in this study are to be shown distant from the modern main-island Japanese though the reasons for this are not known. In conclusion, successive genetic contribution from northern and eastern continental Asia brought about considerable craniometric diversity seen in the modern inhabitants of the Japan Islands.
We are grateful to T. Amano and H. Ono of Hokkaido University Museum, Sapporo, H. Baba of the National Museum of Nature and Science, Tokyo, G. Suwa of the University Museum, the University of Tokyo, and H. Matsumura of Sapporo Medical University for their kind permission to examine the skeletal collections under their care. In addition, we also thank G. Suwa (the associate editor) and two anonymous reviewers for their very helpful comments.
This study was supported in part by a Grant-in-aid for Scientific Research (Nos. 18370099, 1850220) from the Japan Society for the Promotion of Science.