Abstract
Most studies of dental microevolution have used the standard methodologies employed in dental anthropology: buccolingual/mesiodistal lengths and the frequencies of non-metric dental traits. In this work we use the occlusal polygon method which is based on a polygon created by linking the four molar cusp apices using digital analysis. This method has been used to identify different evolutionary trends in Neandertal and modern humans; our objective was to assess the existence of changes in the occlusal polygon area, and thus the general morphology of first upper molars, between two Portuguese samples from the Late Neolithic (4130 ± 90 BP) and the early 20th century. This method allows us to evaluate both tooth size and relative cusp position in the occlusal plane. Contrary to the accentuated tooth size reduction commonly found from the past 10000 years using buccolingual/mesiodistal measurements, no statistically significant change of the total occlusal area of the crown was observed between these samples. Nevertheless, we report an increase of 7.45% in the size of the occlusal polygon and hence 9.38% in its relative area, from 27.30% of the total crown area to 30.30% over this time span. This result implies that microevolutionary changes among Portuguese populations led to changes in the positions of the cusps relative to one another in the first upper molar, whereas the location of their apices have moved away from the centre of the crown to a more peripheral position. This apparent increasing trend contrasts with the one reported in studies of both Neandertals and modern humans.
Introduction
Microevolution has been described as “small scale, generation by generation change in gene content and frequency within natural populations … where the dynamics of natural selection (and the essentially chance effects of genetic drift) enter in …” (Delson et al., 2000: 534). Microevolutionary studies in dental anthropology have focused mainly on changes over space and time in size of the teeth (crown size, root length) and/or on discrete traits. Among the latter, the Carabelli’s cusp and shovel-shaped incisors have been analysed most frequently, although rarely independently (Turner, 1967; Rothhammer et al., 1968; Haddow, 2001; Mavrodisz et al., 2007). Both inter-population variability in tooth size, and dental reduction trends have been studied in various geographic regions and for a range of time periods. Some of these studies have demonstrated the existence of a reduction trend over relatively short time periods, for example in medieval and modern populations (Pressley, 2008) and during the Late Neolithic (y’Edynak and Fleisch, 1983). Others have extended the time interval documenting crown size reduction during the period spanning from the Neolithic to modern times (Haddow, 2001; Hill, 2004) as well as during the Upper Palaeolithic and Mesolithic (Brace and Mahler, 1971; Brace et al., 1987; Calcagno, 1986, 1989; Chamla, 1980; Pinhasi et al., 2008). While the general reported trend is one of a global diachronic crown size reduction trend, there are exceptions to the rule, where tooth size did not change or even increased over time (e.g. Garn et al., 1969; y’Edynak, 1989; Jacobs, 1994).
Most of the studies of metric variations in the dentition of past populations have utilized standard anthropological methods using sliding or digital callipers and measuring mesiodistal and buccolingual crown dimensions (Morris, 1986; Haddow, 2001; Serafin, 2007; Kimura et al., 2009; Bernal et al., 2010). However, alternative methods can be now used to determine tooth size and morphology by utilizing digital photography and dedicated software. The method of the occlusal polygon was first presented by Morris (1986). Morris defined a polygon on the occlusal face of cusped teeth by linking the apices of their cusps (Figure 1). The area of this polygon can then be assessed, and dividing it by the total occlusal area of the tooth provides a useful ratio for the assessment of the relative polygonal occlusal area. This ratio allows the evaluation of the location of the cusps in a two-dimensional occlusal plane in relation to the centre of the tooth. In recent years this method has been used by Bailey (2004) and Bailey et al. (2008). In a recent study, Bailey et al. (2008) observed an increase in the occlusal polygon areas between the earliest anatomically modern humans and contemporary modern human groups. Although this study was carried out on small samples of hominins, the minor differences observed may indicate a tendency of upper first molar (M1) cusps to move from the centre towards the periphery throughout human evolution. While the causes and mechanisms behind this phenomenon are not well understood, they may be closely related to changes in dietary practices and manners and the use of dentition.

In this paper we evaluate whether the evolutionary trend observed in earlier hominins is also present among modern humans, by focusing on the study of the evolution of the occlusal polygon areas in two Portuguese skeletal samples separated by a time period of circ. 4300 years: a Late Neolithic sample (~4130 ± 90 BP) and a 20th century sample (1915–1938 AD).
Materials and Methods
The tooth analysed in this study is the upper first molar (M1) as it is the least variable of the three maxillary molars (Morris, 1986; Bailey, 2004) and most published studies have used this tooth, and hence provide comparable data (Morris, 1986; Ozaki et al., 1987; Bailey, 2004; Harris and Dinh, 2006; Takahashi et al., 2007; Bailey et al., 2008; Pressley, 2008; Quam et al., 2009). Occlusal wear had to be kept to a minimum in order for the four cusps to be easily and correctly identified. When this is not possible, Bailey (2004) proposes that if dentin is exposed in not more than one cusp, its centre can be used to estimate the location of the cusp apex. In our present study, all teeth had minimal occlusal wear as they were selected from collections with a very large available number of individuals.
The two samples comprise of individuals from central Portugal (Figure 2). Both osteological samples are currently housed at the University of Coimbra, Portugal. The Neolithic teeth (n = 54) came from the Tholos of Paimogo I, dated to 4130 ± 90 BP (2 sigma: 2890–2475 cal BC, UBAR 539) (for details of the osteological sample, see Silva, 2002, 2003). All of these were loose teeth and therefore age-at-death could not be assessed. The modern sample (n = 50) was part of one of the collections of the university’s Museum of Anthropology (nowadays Museu da Ciência), the Colecção de Trocas Internacionais (Collection of International Exchanges), which is composed of skeletons recovered from the cemetery of Conchada in Coimbra (Cunha and Wasterlain, 2007). In this collection individuals with an age-at-death between 6 and 12 years were chosen.
Photographic capture
Occlusal pictures of all teeth were taken using a digital SLR camera (Nikon D40, Nikon Inc.) on a tripod, with a 55 mm focal length lens, to capture the image with as little distortion as possible. A low ISO (200–400) configuration was used in order to avoid grainy pictures and thus to make the apexes easier to identify. All images were captured in small batches and sometimes recaptured due to insufficient quality as assessed during an initial software analysis, mainly due to crown inclination. The images were taken in RAW format, so that there was more room for manipulation in terms of brightness and quality in general. A millimetric scale was placed always at the same level of the top of the crown so that the focal plane in the photograph was the same, avoiding differences in size due to the distance to the lens and/or blur. To avoid the latter, and consequently poor calibration in the software, a small lens aperture between f/9 and f/12 was also used. All teeth were placed carefully so that the cusp tips were horizontally parallel to the table surface and exactly at the centre of the lens and its focal point.
Software analysis
Initially the images were converted into grey scale, allowing a better distinction between the elements and increasing the contrast between white and black shaded areas, thereby highlighting the slopes. The analysis itself was conducted by using image analysis software (Digimizer, version 3.7.1., MedCalc Software) in three main phases. First, each individual image was calibrated, then the apices were identified and linked in order to calculate total occlusal and polygon areas (Figure 1). Statistical analysis (PASW Statistics, version 17.0, SPSS Inc.) was performed using Mann–Whitney U non-parametric tests (α = 0.05). All measurements were taken twice, separated in time by at least one week, and the average values were used for the final analysis. Intra-observer error on the measurements was assessed by comparing all values of the two rounds from all measurements with paired-samples t-tests (α = 0.05).
Results
Intra-observer error
The correlation between the values obtained in the two rounds of measurement was always above 97% for all characteristics. The correlation value for total occlusal area in the Neolithic sample was 98.9% and in the modern sample 97%. For the occlusal polygon area the values from the two rounds showed 97.6% correlation for the Neolithic teeth, and 98.2% for the modern ones. Therefore, the average correlation value for the Neolithic sample was 98.6% and for the modern sample it was 97.6%. Correlation of the relative occlusal polygon area values was not assessed, as it is a result of the two previous measurements and will always follow the same tendency.
Total occlusal area
The values for the occlusal area ranged from 73.54 to 111.05 mm2 in the Neolithic sample and from 77.58 to 105.41 mm2 in the modern sample (Figure 3). The average value for the teeth belonging to the Tholos of Paimogo I was higher (94.50 mm2) than the modern sample average (92.65 mm2). As seen from Table 1, the Mann–Whitney U statistical test revealed, however, that these differences are not statistically significant (P = 0.280), thus implying that no significant changes in tooth size occurred during the time period analysed.
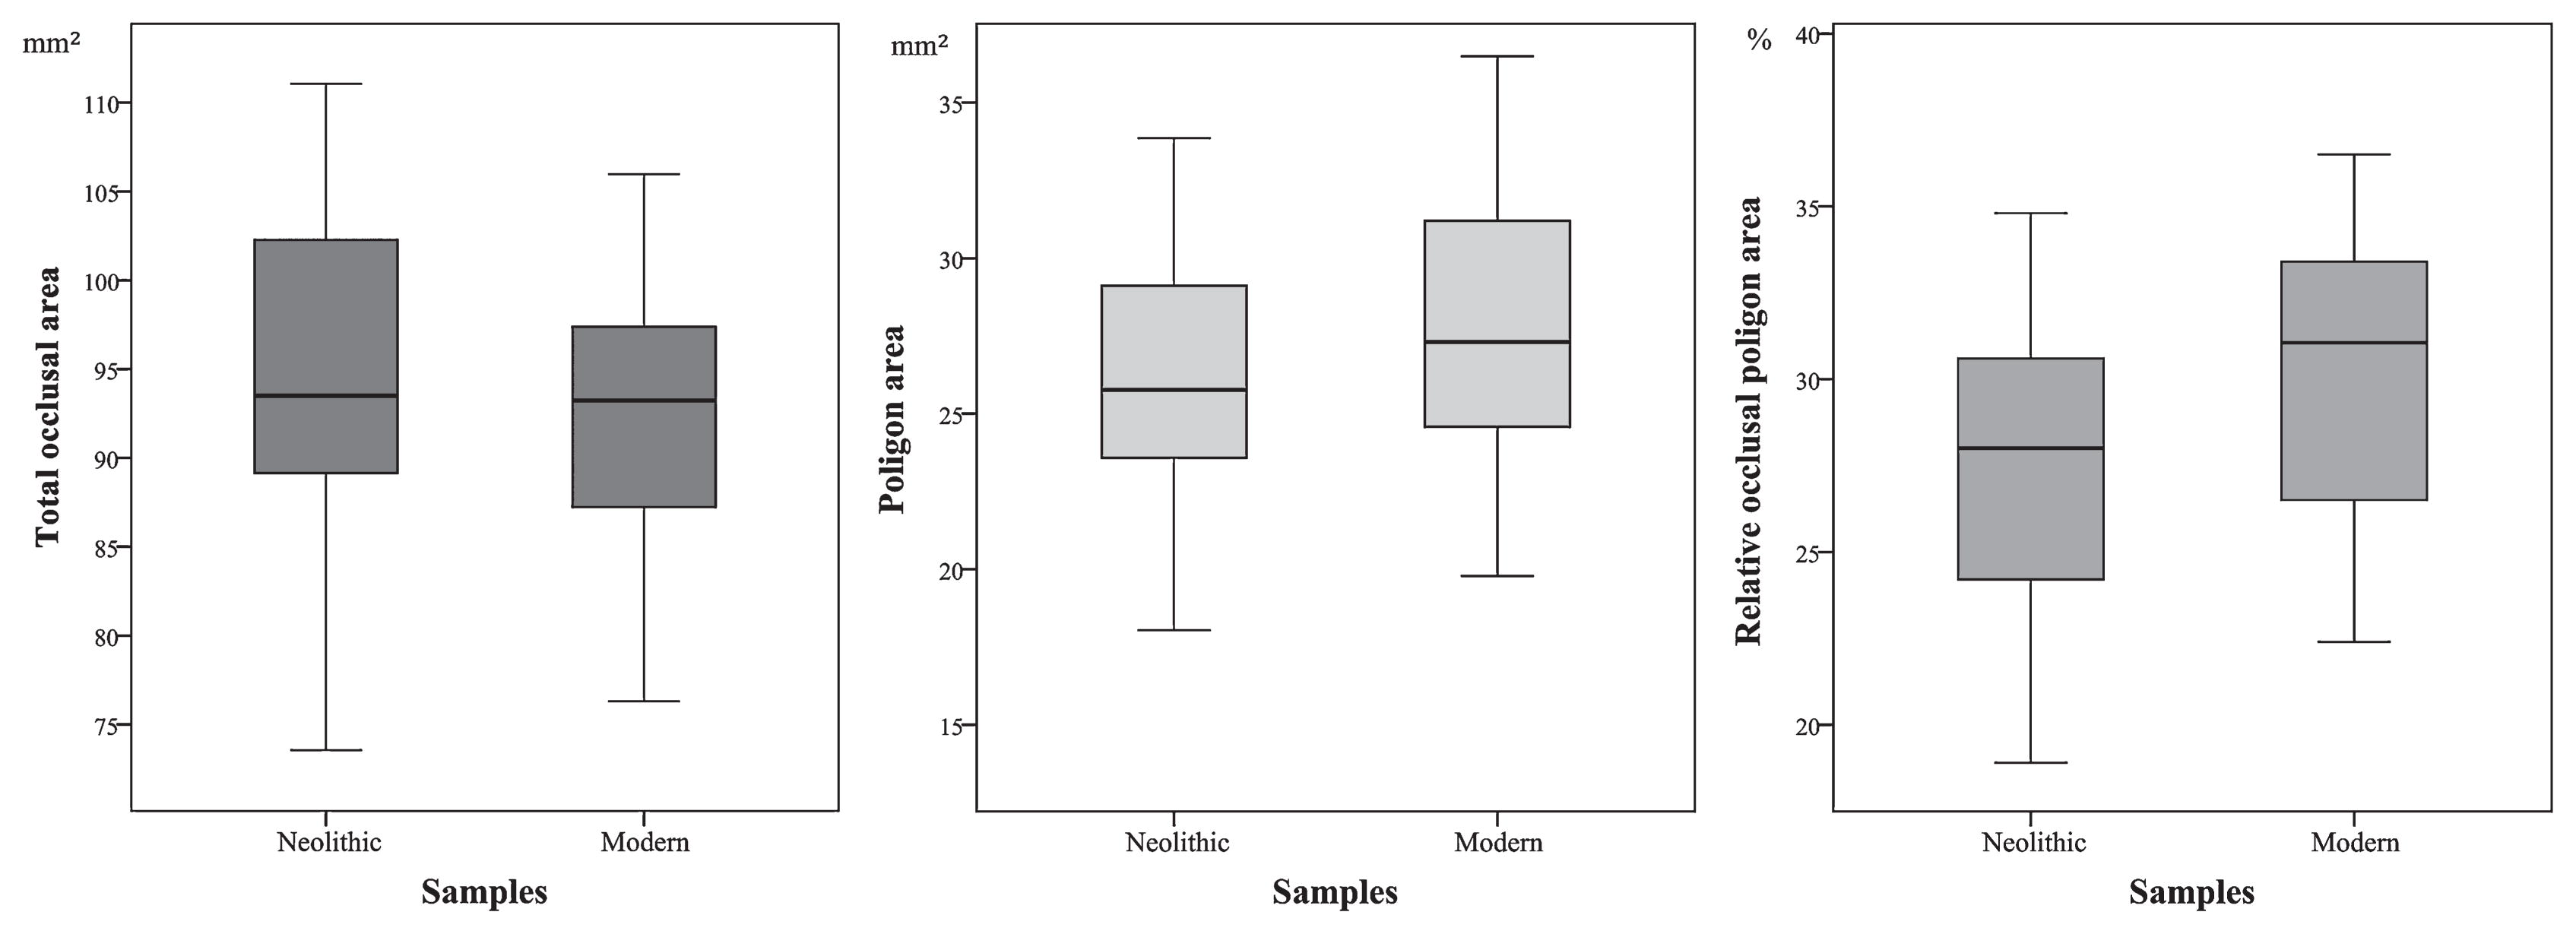
Table 1
Descriptive statistics and significant differences (Mann–Whitney
U non-parametric test) between Neolithic and modern-day Portuguese populations in total occlusal, polygon and relative occlusal polygon areas
|
Neolithic (n = 54) |
Modern (n = 50) |
P-value |
|
|
|
|
X |
SD |
Interval |
X |
SD |
Interval |
|
(mm2) |
(mm2) |
|
| Total occlusal area |
94.50 |
9.37 |
73.54–111.05 |
92.65 |
6.70 |
77.58–105.41 |
0.280 |
| Occlusal polygon area |
26.14 |
3.93 |
18.04–33.86 |
28.50 |
4.53 |
19.78–36.49 |
0.035 |
|
|
|
(%) |
(%) |
|
| Relative occlusal polygon area |
27.70 |
3.80 |
19.00–34.90 |
30.30 |
4.10 |
22.40–36.60 |
0.003 |
The values in bold are statistically significant.
The results obtained seem to show there has been an increase in the area of the occlusal polygon linking the four cusps of M1 (Table 1, Figure 3). The average difference found was 1.95 mm2 for this characteristic, representing an increase of 7.46% from the Neolithic (26.14 mm2) to the Coimbra modern sample (28.09 mm2). These results were found to be statistically significant (P = 0.035).
Relative occlusal polygon area
The percentage of the total occlusal area occupied by the cusp’s polygon was calculated using the two previously mentioned measurements (total occlusal area and occlusal polygon area) and is therefore dependent on these. As in the previous case we then found a statistically significant (P = 0.003) increase of 2.6% in the relative polygonal area between the Neolithic (27.70%) to the Coimbra modern sample (30.30%) (Table 1, Figure 3).
Discussion
Total occlusal area
No significant change in tooth size occurred in the time period analysed. This result is similar to that found by Bailey (2002), where over a longer time interval—Upper Palaeolithic to modern times—an insignificant decrease of only 2 mm2 was reported.
Bailey (2002) found in her study an average value of 96.4 mm2 for her modern sample compared to 106.37 mm2 obtained by Takahashi and colleagues (2007). These differences may be explained, at least partially, by the fact that Bailey studied teeth of individuals from different continents, whereas Takahashi and colleagues focused on teeth of Australian aboriginals, who are known to have the biggest teeth among of all modern populations, sometimes 30–35% bigger than those of Europeans. When this is compared to our values, Takahashi’s are only 14% bigger.
The dental size reduction trend reported here was also reported for other world regions. Christensen (1998) analysed Mexican samples spanning from 1600 BC to AD 1521 and found a reduction trend. Pressley (2008) found also reduction in buccolingual breadth when comparing American samples from around 4000 BC and AD 500. However, these studies were based on the analysis of buccolingual and mesiodistal measurements, while the present study is based in an alternative morphometric method not yet commonly used. In fact, it is important to note that no other works on dental microevolution have applied this morphometric method. This work is the first one to apply this methodology in this type of study. Moreover, some studies only analyse reductive trends on one of the measured axes, mostly the buccolingual (Hill, 2004; Pinhasi et al., 2008; Pressley, 2008), while the method we used accounts for the whole area and the overall shape of the teeth.
We have also found that the interval of values of the modern sample (27.83 mm2) is significantly lower than the Neolithic counterpart (37.51 mm2), possibly indicating that this characteristic has become more homogeneous.
Occlusal polygon area
Harris and Dinh (2006) and Ozaki and colleagues (1987) report that the distances between M1 cusps, and consequently also its area, depend largely on the size of the crown. Gómez-Robles and colleagues (2007) also demonstrated that the form of the occlusal polygon is not independent of the occlusal crown area. Therefore, the absence of changes in the crown area seen previously should not relate to the distance between and the positions of the cusps observed in this present work. Here, a movement away from the centre towards the periphery of the tooth is observed. One of the possibilities may be that this is a result of an environment–genotype interaction that is constantly changing through human evolution and cultural modifications. Jernvall and colleagues reported a disparity in adult tooth morphology, related to differences in gene expression in the developing tooth bud (Jernvall and Jung, 2000; Jernvall et al., 2000). Later on, many protein-coding genes, such as EDA, EDAR, HOXB2 or IGFBP1, have been identified as being involved in dental development and cusp formation, number and position (Kangas et al., 2004; Kassai et al., 2005; Townsend et al., 2012). This multigenic signalling works as a patterning cascade of events in the formation of the various molar cusps, relying on precise temporal and spatial control for its development (Jernvall, 2000; Jernvall and Jung, 2000; Boccone and Moggi Cecchi, 2010). Hunter and colleagues were able to demonstrate that small variations in developmental timing can also account for differences in cusp patterns independently of genotype (Hunter et al., 2010). This environment–genotype interaction affecting the spacing of enamel knots relative to crown size may have had an important role in the placement and number of cusps during evolution.
Relative occlusal polygon area
Our study therefore indicates that cusp movement from the centre to the periphery is not dependent on tooth size but on actual changes in the cusp positions. Bailey (2004) and Gómez-Robles and colleagues (2007) reported a distinct macroevolutionary trend in crown occlusal morphology. In the case of the M1, Gómez-Robles et al. propose that Homo heidelbergensis and Neandertals show a derived pattern while Homo sapiens retained the shape found in Australopithecus. Neandertal M1’s rhomboid-shaped occlusal polygon must have been derived from an approximately square occlusal polygon of Australopithecus and H. sapiens (Gómez-Robles et al., 2007). The trend affecting modern humans must then be one of maintenance of the polygon’s shape and for Neandertals must have been of its reduction, as the values presented by Bailey (2004) for the latter are significantly lower than those of early hominins and contemporary modern humans (even though sample sizes were very small for H. erectus and early anatomically modern humans, their mean values are closer to the ones of contemporary and early anatomically modern humans). Therefore, based on Bailey’s results (2004), it was expected to detect mean values higher than the ones of Neandertals and similar values at least to those of contemporary modern humans. Indeed, both our Neolithic and modern samples have mean values higher than those reported for Neandertal (26.8%) but surprisingly lower than any of the modern humans studied by Bailey (37.50%). The average values in this study are within the range reported by Bailey for Neandertals (24.50–30.50%) and the lowest values in the case of both Neolithic and modern Portuguese samples are below Bailey’s range for Neandertals.
The 2.60% increase in the relative polygonal area in the case of the two Portuguese samples (Table 1, Figure 3) may indicate the existence of a microevolutionary trend during the 4300-year interval. These results curiously do not follow the modern human trend of maintenance of the polygonal shape discussed above, and actually stands as the opposite of the Neandertal reduction trend as it shows a small but statistically significant increase of the polygon area.
One should not forget that our samples are both Portuguese, and therefore the best way to understand these results is in this context, as a “trend may be a regional rather than a continental phenomenon” (Pinhasi and Meiklejohn, 2011: 452).
Conclusions
This study has documented the evolutionary change in the crowns of maxillary first molars by analysing the relation between the total crown occlusal area and the cusp’s polygon area. Using an alternative morphometrics method this was achieved by comparing two samples separated by a time interval of about 4300 years—between the Late Neolithic and modern times.
In relation to tooth size, there were no significant changes of the crown’s occlusal area size between these samples over time. The occlusal polygon formed by connecting the cusp apices of the first maxillary molar showed a positive trend, increasing its area over time. Since this increase was not caused by a general increase in the tooth size, as documented above, this indicates that the locations of the cusps’ apexes have shifted over time from the centre to the periphery of the crown’s occlusal surface, possibly as a result of a constantly evolving environment–genotype interaction in early tooth development. These results also seem to support an increasing trend of the relative occlusal polygon area. This trend opposes the one of a decrease reported by Bailey (2004) in her study of Neandertals.
The disparity of values when compared to the available literature suggests our results should be presented in their regional context, i.e. Europe and more specifically Portugal. Future research will further explore this trend in other populations and in the case of other teeth in order to assess whether it is a universal rather than a region-specific trend.
Acknowledgments
We have to thank the Museum of Anthropology (nowadays Museu da Ciência), University of Coimbra, for allowing the study of one of its identified osteological collections; the Museu Municipal de Torres Vedras who temporarily handed over the osteological sample of Tholos de Paimogo I; the Centro de Investigação em Antropologia e Sáude (CIAS); and University College Cork, especially the Archaeology Department.
References
- Bailey, S. (2002) Neandertal dental morphology: implications for modern human origins. Ph.D. dissertation, Arizona State University.
- Bailey, S. (2004) A morphometric analysis of maxillary molar crowns of Middle–Late Pleistocene hominins. Journal of Human Evolution, 47: 183–198.
- Bailey, S., Glantz, M., Weaver, T.D., and Viola, B. (2008) The affinity of the dental remains from Obi-Rakhmat Grotto, Uzbekistan. Journal of Human Evolution, 55: 238–248.
- Bernal, V., Perez, S.I., Gonzalez, P.N., and Diniz-Filho, J.A.F. (2010) Ecological and evolutionary factors in dental morphological diversification among modern human populations from southern South America. Proceedings of the Royal Society Biology, 277: 1107–1112.
- Brace, C.L., and Mahler, P.E. (1971) Early Holocene changes in the human dentition. American Journal of Physical Anthropology, 34: 191–204.
- Brace, C.L., Rosenberg, K.R., and Hunt, K.D. (1987) Gradual change in human tooth size in the late pleistocene and pos-pleistocene. Evolution, 41: 705–720.
- Boccone, S., and Moggi Cecchi, J. (2010) Dental development and upper molar cusp dimensions of South African australopithecines. Transactions of the Royal Society of South Africa, 60: 95–97.
- Calcagno, J.M. (1986) Dental reduction in post-pleistocene Nubia. American Journal of Physical Anthropology, 70: 349–363.
- Calcagno, J.M. (1989) Mechanisms of human dental reduction: a case study from post-Pleistocene Nubia. Lawrence, University of Kansas Publications in Anthropology No. 18.
- Chamla, M.C. (1980) Étude des variations métriques des couronnes dentaires du Nord-Africains de l’Épipaléolithique à l’Époque Actuelle. L’Anthropologie, 84: 254–271.
- Christensen, A.F. (1998) Odontometric microevolution in the Valley of Oaxaca, Mexico. Journal of Human Evolution, 34: 333–360.
- Cunha, E., and Wasterlain, S. (2007) The Coimbra identified osteological collections. In: Grupe, G., and Peters, J. (eds.), Skeletal series and their socio-economic context. Documenta Archae-obiologiae 5. Verlag Marie Leidorf, Rahden/Westf., pp. 23–33.
- Delson, E., Tattersall, I., Couvering, J., and Brooks, A. (2000) Encyclopedia of Human Evolution and Prehistory. Garland Publishing, New York.
- Garn, S.M., Lewis, A.B., and Walcnga, A.J. (1969) Crown-size profile patterns and presumed evolutionary trends. American Anthropologist, 71: 79–84.
- Gómez-Robles, A., Martinon-Torres, M., Bermudez de Castro, J.M., Margvelashvili, A., Bastir, M., Arsuaga, J.L., Perez-Perez, A., Estebaranz, F., and Martinez, L.M. (2007) A geometric morphometric analysis of hominin upper first molar shape. Journal of Human Evolution, 53: 272–285.
- Haddow, S.D. (2001) Morphometric analysis of the dentition from bronze age Tell Leilan, Syria: a contribution to the dental anthropology of ancient Mesoptamia. Master’s thesis, University of Alberta.
- Harris, E.F., and Dinh, D.P. (2006) Intercusp relationships of the permanent maxillary first and second molars in American whites. American Journal of Physical Anthropology, 130: 514–528.
- Hill, M.K. (2004) Dental reduction and diet in the prehistoric Ohio river valley. Dental Anthropology, 17: 34–44.
- Hunter, J.P., Guatelli-Steinberg, D., Weston, T.C., Durner, R., and Betsinger, T.K. (2010) Model of tooth morphogenesis predicts Carabelli cusp expression, size, and symmetry in humans. PLoS ONE, 5: e11844.
- Jacobs, K. (1994) Human dento-gnathic metric variation in Mesolithic/Neolithic Ukraine: possible evidence of demic diffusion in the Dnieper rapids region. American Journal of Physical Anthropology, 95: 335–356.
- Jernvall, J. (2000) Linking developmental with generation of novelty in mammalian teeth. Proceedings of the National Academy of Sciences of the United States of America, 97: 2641–2645.
- Jernvall, J., and Jung, H.S. (2000) Genotype, phenotype, and developmental biology of molar tooth characters. Yearbook of Physical Anthropology, 43: 171–190.
- Jernvall, J., Keränen, S.V.E., and Thesleff, I. (2000) Evolutionary modification of development in mammalian teeth: quantifying gene expression patterns and topography. Proceedings of the National Academy of Sciences of the United States of America, 97: 14444–14448.
- Kangas, A.T., Evans, A.R., Thesleff, I., and Jernvall, J. (2004) Non independence of mammalian dental characters (abstract). Nature, 432: 211–214.
- Kassai, Y., Munne, P., Hotta, Y., Penttilä, E., Kavanagh, K., Ohbayashi, N., Takada, S., Thesleff, I., Jernvall, J., and Itoh, N. (2005) Regulation of mammalian tooth cusp patterning by ectodin. Science, 309: 2067–2070.
- Kimura, R., Yamaguchi, T., Takeda, M., Kondo, O., Toma, T., Haneji, K., Hanihara, T., Matsukusa, H., Kawamura, S., and Maki, K.et al. (2009) A common variation in EDAR is a genetic determinant of shovel-shaped incisors. American Journal of Human Genetics, 85: 528–535.
- Mavrodisz, K., Rozsa, N., Budai, M., Soos, A., Pap, I., and Tarjan, I. (2007) Prevalence of accessory tooth cusps in a contemporary and ancestral Hungarian population. European Journal of Orthodontics, 29: 166–169.
- Morris, D.H. (1986) Maxillary molar occlusal polygons in five human samples. American Journal of Physical Anthropology, 70: 333–338.
- Ozaki, T., Kanazawa, E., Sekikawa, M., and Akai, J. (1987) Three-dimensional measurements of the occlusal surfaces of the upper molars in Australian Aboriginals (abstract). Australian Dental Journal, 32: 263–269.
- Pinhasi, R., and Meiklejohn, C. (2011) Dental reduction and the transition to agriculture in Europe. In: Pinhasi, R., and Stock, J.T. (eds.), Human Bioarchaeology of the Transition to Agriculture. Wiley-Blackwell, Chichester, pp. 451–474.
- Pinhasi, R., Eshed, V., and Shaw, P. (2008) Evolutionary changes in the masticatory complex following the transition to farming in the Southern Levant. American Journal of Physical Anthropology, 135: 136–148.
- Pressley, J.L. (2008) Dental reduction as evidence of microevolution and selection between Middle Archaic and Middle/Late Woodland occupations at 11Sa87a—The Black Earth Site (abstract). Master’s thesis, Southern Illinois University.
- Quam, R., Bailey, S., and Wood, B. (2009) Evolution of M1 crown size and cusp proportions in the genus Homo. Journal of Anatomy, 214: 655–670.
- Rothhammer, F., Lasserre, E., Blanco, R., Covarrubias, E., and Dixon, M. (1968) Microevolution in human Chilean populations. IV. Shovel shape, mesial-palatal version and other dental traits in Pewenche Indians. Zeitschrift für Morphologie und Anthropologie, 60: 162–169.
- Serafin, S. (2007) Bioarchaeological investigation of the ancient population structure of Mayapán. Foundation for the Advancement of Mesoamerican Studies, Inc.
- Silva, A.M. (2002) Antropologia funerária e Paleobiologia das populações portuguesas (litorais) do Neolítico final/Calcolítico. Ph.D. dissertation, University of Coimbra.
- Silva, A.M. (2003) Portuguese populations of the Late Neolithic and Chalcolithic periods exhumed from collective burials: an overview. Anthropologie, XLI/1–2: 55–64.
- Takahashi, M., Kondo, S., Townsend, G.C., and Kanazawa, E. (2007) Variability in cusp size of human maxillary molars, with particular reference to the hypocone. Archives of Oral Biology, 52: 1146–1154.
- Townsend, G.C., Bockmann, M., Hughes, T., and Brook, A. (2012) Genetic, environmental and epigenetic influences on variation in human tooth number, size and shape. Odontology, 100: 1–9.
- Turner, C.G. (1967) Dental genetics and microevolution in prehistoric and living Koniag eskimo. Journal of Dental Research, 46: 911–917.
- y’Edynak, G. (1989) Yugoslav Mesolithic dental reduction. American Journal of Physical Anthropology, 78: 17–36.
- y’Edynak, G., and Fleisch, S. (1983) Microevolution and biological adaptability in the transition from food-collecting to food-producing in the Iron Gates of Yugoslavia. Journal of Human Evolution, 12: 279–296.

