Abstract
The purpose of this study was to propose a time-series modeling and simulation (M&S) strategy for probabilistic cost-effective analysis in cancer chemotherapy using a Monte-Carlo method based on data available from the literature. The simulation included the cost for chemotherapy, for pharmaceutical care for adverse events (AEs) and other medical costs. As an application example, we describe the analysis for the comparison of four regimens, cisplatin plus irinotecan, carboplatin plus paclitaxel, cisplatin plus gemcitabine (GP), and cisplatin plus vinorelbine, for advanced non-small cell lung cancer. The factors, drug efficacy explained by overall survival or time to treatment failure, frequency and severity of AEs, utility value of AEs to determine QOL, the drugs’ and other medical costs in Japan, were included in the model. The simulation was performed and quality adjusted life years (QALY) and incremental cost-effectiveness ratios (ICER) were calculated. An index, percentage of superiority (%SUP) which is the rate of the increased cost vs. QALY-gained plots within the area of positive QALY-gained and also below some threshold values of the ICER, was calculated as functions of threshold values of the ICER. An M&S process was developed, and for the simulation example, the GP regimen was the most cost-effective, in case of threshold values of the ICER=$70000/year, the %SUP for the GP are more than 50%. We developed an M&S process for probabilistic cost-effective analysis, this method would be useful for decision-making in choosing a cancer chemotherapy regimen in terms of pharmacoeconomic.
In cancer chemotherapy, an important concern for patients is the efficacy of treatment, usually expressed by indices such as survival time and performance status. The high cost of cancer chemotherapy is a burden for both patients and the national economy; for example, the total cost of cancer therapy in the United States reported by National Cancer Institute (NCI) was $157 billion in 2010.1) It has also been reported that these costs may increase at a faster rate than overall medical expenditure2) because new targeted anticancer therapies such as monoclonal antibodies and small-molecule inhibitors will be adopted as standard therapies, and therefore, more efficient but more expensive therapies will be used.
A concept of pharmacoeconomics has been applied to a clinical pharmacy practice,3,4) and a health care evaluation.5) Several types of cost-effective analyses have been performed for choosing the optimal chemotherapy regimens for cancer patients.6–8) The objectives of these cost-effective analyses were to compare two or more regimens from the viewpoint of increasing cost per increasing efficacy. From a pharmaceutical viewpoint, in order to choose the optimal regimen that provides the best cost-effective ratio, information regarding both treatments’ efficacy and the frequency and severity of possible adverse events (AEs) should be considered when comparing different regimens.9) Considering the QOL of patients, it is also important to manage possible AEs during chemotherapy, such as vomiting and myelosuppression by appropriate pharmacotherapy. Therefore, the cost for not only chemotherapy and other medical costs but also for treating and preventing AEs should be considered for overall cost-effective analysis.10,11)
In order to perform a systematic cost-effective analysis, a mathematical and probabilistic model is needed10) to take the inter-individual variability of anticancer efficacy and probabilities of AEs into consideration for an economic evaluation. Modeling and simulation (M&S) has been often used in cost-effective analysis for decision-making.5,11,12) A Markov process model13,14) has been used for modeling changes in disease conditions in patients, and a typical index such as the incremental cost-effective ratio (ICER)15) has been used for this purpose. In a Markov model, transition probabilities are estimated from hazard rates of progression free survival (PFS) or overall survival (OS), and a time course profile of PFS or OS is not considered. In the present study, we aimed to simulate an occurrence of possible AEs after typical dosing regimens as time-series profiles throughout individual survival times. For this purpose, we adopted a model to simulate individual survival times from the time-to-event profiles of OS and those of time to failure (TTF). As an application example, a cost-effectiveness analysis was performed for the comparison of four platinum-based regimens; i) cisplatin (CDDP) plus irinotecan (IP), ii) carboplatin (CBDCA) plus paclitaxel (TC), iii) cisplatin plus gemcitabine (GP), and iv) cisplatin plus vinorelbine (NP) for advanced non-small cell lung cancer (NSCLC).16) Although these are not the latest regimens, we used the results of this clinical study because this is a typical example of a comparative analysis of different regimens with similar efficacy and different toxicity profiles.
The purpose of the present study was to develop a time-series M&S strategy for probabilistic cost-effective analysis in cancer chemotherapy.
MATERIALS AND METHODS
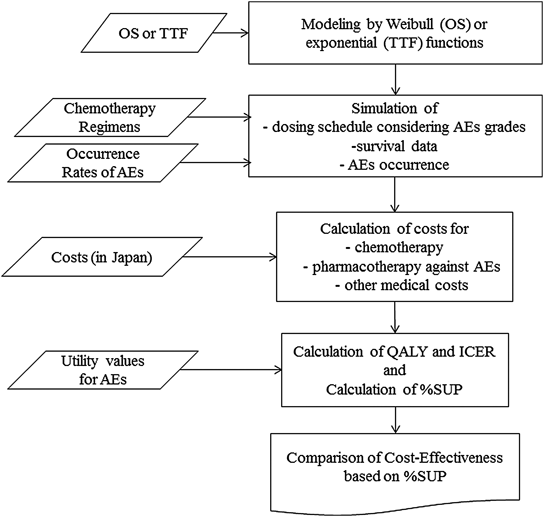
General Strategy of Modeling and SimulationWe included three factors in the model. The first factor was drug efficacy in chemotherapy treatment, which is explained by survival parameters such as OS and TTF. The second factor was the frequency and severity of AEs, reported by occurrence rates and grading scores according to the Common Terminology Criteria for Adverse Effects (CTC AE) Version 4.0. The utility values for AEs were also considered to determine QOL. The last factor was the actual cost (prices) of drugs for chemotherapy and for the prevention and treatments of possible AEs, and other medical costs. Figure 1 shows the schematic summary of the whole M&S processes in this study.
We used the data for the survival times and the occurrence rates of AEs which were available from published papers or package inserts. To take inter-patient variability of those factors into consideration, a probabilistic model was used and simulations were performed with the Monte Carlo method. For simulations, we assumed a hypothetical population of 1000 patients, and simulations were performed using the statistical package R (version 3.23; available as a free down-load from http://www.r-project.org).17)
DataWe performed M&S using the data available from a clinical study report16) and other reports18–23); the basic data regarding the chemotherapy such as the dose regimens, the data for OS and TTF, and the data of the occurrence rates of AEs taken from the clinical study report16) are summarized in Table 1, and the data for drugs against AEs, utility values, and medical treatment fees are summarized in Table 2. The model parameters for the survival function were estimated based on the data for OS and TTF. We used TTF rather than the data for time to progression (TTP) because TTF is more appropriate to determine the time to stop chemotherapy.24) Occurrence rates of AEs were defined separately depending on grading scores because the types of pharmacotherapy depended on these grading scores. Major typical drugs for the prevention or treatment of corresponding AEs were chosen based on the Clinical Practice Guidelines for the Japan Society of Clinical Oncology (http://jsco-cpg.jp/) or American Society of Clinical Oncology (ASCO).23) Prevention therapies for vomiting were determined for each anticancer drug considering the vomiting risks of the drugs after repeated dosing, and the details are summarized in Table 2. In addition, medical treatment fees during repeated dosing were incorporated into the simulation based on the information by Ministry of Health, Labour and Welfare (MHLW) in Japan (http://www.mhlw.go.jp/stf/seisakunitsuite/bunya/0000032996.html), as shown in Tables 1 and 2. The costs of diuretic drugs and transfusions were not included in this study. The prices of all drugs are given as Japanese standard values (National Health Insurance Drug Price List reported by MHLW (http://www.mhlw.go.jp/topics/2012/03/tp120305-01.html), and were converted into dollars at the rate of $1.00/100 yen for better understanding by non-Japanese readers.
Table 1. Basic Data for Dose Regimens, Efficacy Data (OS and TTF), and Rates of AEs (Taken from Ref. 16)
| Treatment | Drugs and dosing schedules | Costs |
|---|
| IP | Cisplatin (Buripurachin®): 80 mg/m2 on day 1, for a 4-week cycle | $254.1/week |
| Irinotecan (Topotecin®): 60 mg/m2 on days 1, 8, 15, for a 4-week cycle | $93.7/week |
| TC | Carboplatin (Paraplatin®): target AUC 6.0 min·mg/mL, on day 1, for a 3-week cycle | $452.1/week |
| Paclitaxel (Taxol®): 200 mg/m2 on day 1, for a 3-week cycle | $662.1/week |
| GP | Cisplatin: 80 mg/m2 on day 1, for a 3-week cycle | $254.1/week |
| Gemcitabine (Gemzar®): 1000 mg/m2 on days 1, and 8 for a 3-week cycle | $231.2/week |
| NP | Cisplatin: 80 mg/m2 on day 1, for a 3-week cycle | $254.1/week |
| Vinorelbine (Navelbine®): 25 mg/m2 on days 1, and 8 for a 3-week cycle | $165.6/week |
| Overall survival (OS) |
| IP | 59.2% at 52.1 weeks, 50.0% at 60.4 weeks, 26.5% at 104.3 weeks |
| TC | 51.0% at 52.1 weeks, 50.0% at 53.4 weeks, 25.5% at 104.3 weeks |
| GP | 59.6% at 52.1 weeks, 50.0% at 60.8 weeks, 31.5% at 104.3 weeks |
| NP | 50.0% at 52.1 weeks, 48.3% at 49.5 weeks, 21.4% at 104.3 weeks |
| Time to treatment failure (TTF) |
| IP | 50% at 14.3 weeks |
| TC | 50% at 13.9 weeks |
| GP | 50% at 13.9 weeks |
| NP | 50% at 13.0 weeks |
| Occurrence rate of AEs (%) (Number of occurrences/Total number) |
| IP | TC | GP | NP |
|---|
| Nausea or vomiting (G2, 3) | 61 (90/147) | 25 (37/148) | 58 (88/151) | 47 (69/146) |
| Diarrhea (G2) | 33 (49/147) | 4 (6/148) | 7 (11/151) | 8 (12/146) |
| Diarrhea (G3) | 15 (22/147) | 3 (4/148) | 2 (3/151) | 4 (6/146) |
| Diarrhea (G4) | 1 (1/147) | 0 (0/148) | 0 (0/151) | 0 (0/146) |
| Neutrophils (G2, 3) | 50 (74/147) | 24 (36/148) | 61 (92/151) | 21 (31/146) |
| Neutrophils (G4) | 45 (66/147) | 69 (102/148) | 23 (35/151) | 72 (105/146) |
| Anorexia (G4) | 2 (3/147) | 1 (1/148) | 1 (2/151) | 1 (1/146) |
| Fatigue (G2, 3) | 39 (57/147) | 28 (41/148) | 20 (30/151) | 26 (38/146) |
| Fatigue (G4) | 1 (1/147) | 1 (1/148) | 0 (0/151) | 0 (0/146) |
| Neuroclinical (G4) | 0 (0/147) | 1 (1/148) | 0 (0/151) | 0 (0/146) |
| Phlebitis (G4) | 1 (1/147) | 0 (0/148) | 0 (0/151) | 0 (0/146) |
| Febrile neutropenia | 14 (21/147) | 18 (27/147) | 2 (3/151) | 18 (26/146) |
Table 2. Basic Data for Drugs against AEs, Utility Values, and Medical Treatment Fees
| Prevention for adverse events (taken from refs. 19–23) |
|---|
| Purpose | Drugs and dosage | Costs |
|---|
| Vomiting for cisplatine | Emend® (Aprepitant): 125 mg PO on day 1, and 80 mg PO on days 2–3 | $117.6/treatment |
| Aroxy® (Palonosetron): 0.75 mg SC on day 1 | $149.4/treatment |
| Decadron® (Dexamethasone): 9.9 mg SC on day 1, and 8 mg PO on days 2–4 | $7.3/treatment |
| Vomiting for irinotecan and carboplatin | Emend® (Aprepitant): 125 mg PO on day 1, and 80 mg PO on days 2–3 | $117.6/treatment |
| Aroxy®: 0.75 mg SC on day 1 | $149.4/treatment |
| Decadron®: 3.3 mg SC on day 1 | $1.8/treatment |
| Vomiting for paclitaxel and gemcitabine | Decadron®: 6.6 mg SC on day 1 | $3.6/treatment |
| Treatment for adverse events (taken from refs. 19–23) |
| Vomiting | Primperan® (Metoclopramide): 10 mg PO 3 times on days 1–3 | $0.6/treatment |
| Diarrhea (G1-4) | Lopemin® (Loperamide): 4 mg PO on day 1 | $1.9/treatment |
| Febrile neutropenia | Neu-up® (Nartograstim): 1 µg/kg SC on day 1 | $72.5/treatment |
| Utility values (taken from ref. 18) * |
| Base | 0.6725 (=0.6532 (intercept)+0.0193 (response)) |
| Neutropenia | −0.08973 |
| Fatigue | −0.07346 |
| Nausea & vomiting | −0.04802 |
| Diarrhea | −0.04680 |
| Medical treatment fees |
| Re-examination fee | $7.2 |
| IV drip fee | $9.5 |
| Preparation in sterile environment | $5.0 |
| Outpatient chemotherapy | $58 |
| Blood drawing fee | $1.5 |
| Peripheral blood tests fee | $2.1 |
| Peripheral blood tests diagnostic fee | $12.5 |
| Biochemical tests diagnostic fee | $14.4 |
PO: per oral, SC: subcutaneous, TID: three times a day. * See the texts for details of utility values.
Survival curves are usually shown by a Kaplan–Meier plot25,26) and the survival times at certain percentiles of survival rates (e.g., 50, 75%) are often available from the literature. For modeling of survival data, functions for some statistical distributions such as the exponential distribution and the Weibull distribution are used for analyzing time to event data. In the present study, we chose the Weibull function and the exponential function as possible models to explain the OS and TTF data, and the appropriate model was chosen as described later.
A cumulative distribution function for the Weibull distribution is given by Eq. 1, where F0 is the survival rate at zero time (fixed to 100%), k is a first order decreasing rate constant, and r is a parameter for determining the shape of the distribution curve.
 | (1) |
For the data of TTF, the function for the exponential distribution is given by fixing the parameter
r to 1 in Eq. 1. The datasets for certain percentiles of survival rates,
e.g., 25, 50%, and corresponding survival times obtained from literatures were used, and a least squares method was applied to estimate the model parameters
k and
r using Eq. 1 by a “solver” tool in Microsoft Excel
®. In order to improve the models, the model-predicted curves were visually compared with the observed Kaplan–Meier curves presented in the original paper. Then for OS data, the parameter values of
k and
r were manually changed so that the predicted curves can be closer to the reported curves. For TTF data, no Kaplan–Meier curves were shown in the original paper and thus the least-squares estimates for
k were used without any modification. In the analysis, 1 month was defined 365/12 d.
SimulationsThe hypothetical data for the OS and the TTF were generated by the Monte Carlo simulation based on the parameter estimates in the modeling process. The sampling of the simulated data was performed using Eq. 2 for the Weibull or the exponential distribution, where u is a random sample from a uniform distribution U(0, 1), log represents the natural logarithm, and R means a random number sampled from the distribution. In case of the exponential distribution, r was fixed to 1 and the random numbers were similarly generated.
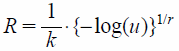 | (2) |
With respect to dosing schedule in the simulation processes, treatment periods and washout periods were assumed to be regularly repeated according to the typical regimen until the time of treatment failure. A treatment period was replaced with an observation period,
i.e., administration of the anticancer drugs was cancelled, when severe AEs (Grade 4 AEs were defined as severe AEs) occurred in the previous week. We assumed that possible AEs randomly occurred in a patient during a treatment period with a probability based on the binomial distribution using the reported occurrence rates shown in
Table 2. We also assumed that the duration of the occurred AEs was 1 week. Appropriate pharmacotherapy treatments were assumed to be dependent on the grades of AEs, and the costs of drugs for both prevention and treatment of AEs were included in calculating the total costs. It was assumed that all patients received the drugs for prevention of AEs on the days of chemotherapy, and all patients who experienced AEs received the drugs for treatment purpose.
The whole simulation was repeated at weekly interval for 1000 hypothetical patients. The simulation procedures can be summarized as follows:
For j-th patient (j=1 to 1000), repeat 1) and 2);
1) Survival time (OSj) and TTFj are randomly simulated, where subscript j means j-th individual.
2) At the i-th week in j-th patient,
i) If either OSj or TTFj is shorter than i (i.e., the patient is not alive or treatment is failed), no more data regarding dosing and adverse effects are simulated. Else, data for treatment or washout period is simulated according to the corresponding chemotherapy regimen.
ii) If a Grade 4 AE is simulated in the previous week, the dosing of the anticancer drugs is cancelled even in the treatment period.
iii) In the treatment period, dosing schedules are simulated according to the typical regimens of the corresponding anticancer drugs, and AEs are simulated according to the reported occurrence rates.
After completion of the simulation processes, the total number of doses for anticancer agents and AE occurrences were summarized, and the total costs of anticancer drugs and drugs for prevention and treatment of AEs. Other medical costs shown in Table 2 were also considered for the total costs. In all simulations, the body surface area of patients was assumed to be 1.5 m2. Dosage of carboplatin was determined using the Calvert formula assuming the typical value of creatinine clearance as 90 mL/min.
Comparison of Cost-Effectiveness among Different RegimensBased on the simulation results, an incremental cost-effectiveness ratio (ICER) between regimens was calculated as follows:
 | (3) |
where subscripts 1 and 2 represent different regimens (Regimen 1 and Regimen 2), “Cost” is the simulated total costs, “Efficacy” is the simulated survival times (OS in the present case) or the OS adjusted by the QOL,
i.e., QALY (quality adjusted life years). The numerator in Eq. 3 is an incremental cost and the denominator is a QALY-gained. Values for the QOL were calculated based on the reported utility values
18) for each of the AEs (
Table 2). In the present study, we defined the “base (responding disease with no toxicity)” value (0.6725) to be a sum of the values for “intercept (0.6532)” and “response (0.0193).” When one or more toxicities occurred, the QOL was defined to be the sum of the base value and the corresponding utility values (
e.g. when neutropenia and fatigue occurred at a time, QOL=0.6725−0.08973−0.07346=0.50931). As we assumed 1 week for the occurred AEs, the QOL values were also assumed 1 week. Then the averaged QOL value during the survival time was used for calculating QALY. As references, quality non-adjusted life years gained (LYG) was also calculated. The ICER for all pairs of 1000 hypothetical patients among four regimens were calculated according to Eq. 3, giving 1000000 pairs×6 combination of the regimens in total.
The cost-effective threshold has been proposed to support decision making for choosing a better regimen in reference to some values of the ICER for the threshold have been reported.27) Based on these previous reports, we defined some typical threshold values K for the ICER between $10000/year and $200000/year, and the borderlines corresponding to these values are given in the same panels of the simulated incremental cost vs. QALY-gained plots. The parameter K represents a maximum acceptable cost per unit of effectiveness. By such definitions, we calculated the percentages of the plots within the area of positive QALY-gained (i.e., Efficacy1−Efficacy2>0) and also below these borderlines. This percentage is an index of cost-effectiveness which has been used for “cost-effectiveness acceptability curve”.12,28) We refer to this index as “percentage of superiority (%SUP)” in this study, that is, an index of superiority of Regimen 1 compared with Regimen 2 from the viewpoint that Regimen 1 is more effective under the defined conditions of the ICER. The %SUP for each combination of the four regimens is plotted as functions of threshold values (K). The estimated costs, LYG, QALY-gained, OS and TTF are shown by mean values and (minimum–maximum) ranges.
RESULTS
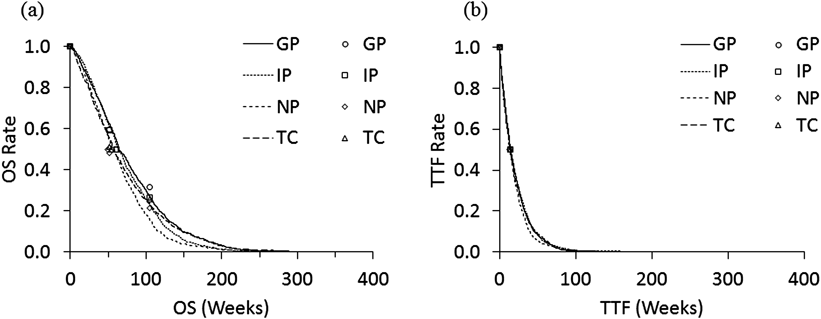
Using data for OS in Table 1, the model parameters were estimated as follows: k=0.012 (/week) and r=1.6 for IP; 0.013 (/week) and 1.3 for TC; 0.012 (/week) and 1.4 for GP; 0.014 (/week) and 1.5 for NP. The data for TTF in Table 1 were modeled using the exponential model, and the estimated parameters were as follows: k=0.0483 (/week) for IP, 0.0499 (/week) for TC, 0.0499 (/week) for GP, and 0.0532 (/week) for NP. Figures 2(a) and (b) show the survival curves for OS and TTF, respectively, using the generated data for a hypothetical population of 1000 patients, as well as the plots of the original data. It is shown that the curves for TTF decreased faster than those for OS. The summary statistics for the simulated OS, TTF and QALY are shown in Table 3. The median values of OS were 62.4, 61.3, 63.4 and 55.5 weeks, and medians of TTF were 13.7, 14.9, 13.7 and 12.9, in IP, TC, GP and NP regimens, respectively.
Table 3. Summary of the Simulated Efficacy Items (TTF, OS, QALY), and Cost Items
| TTF (week) | OS (week) | QALY | Total cost | Cost of anticancer drugs and for prevention of AEs | Cost for medical treatments | Cost for treatment of AEs |
|---|
| IP | 20.36 (0.03, 161) | 71.48 (1.44, 290) | 5.64 (0, 45) | $9062 ($0, $71924) | $9062 ($0, $71924) | $1228 ($0, $9918) | $126 ($0, $1002) |
| TC | 20.52 (0.01, 128) | 72.42 (0.14, 320) | 3.86 (0, 24) | $10547 ($0, $65095) | $9778 ($0, $60356) | $770 ($0, $4739) | $95 ($0, $737) |
| GP | 19.47 (0.02, 127) | 74.20 (0.66, 311) | 6.25 (0, 43) | $7446 ($0, $49122) | $6196 ($0, $40747) | $1250 ($0, $8375) | $21 ($0, $315) |
| NP | 18.66 (0.00, 125) | 64.37 (0.06, 253) | 4.21 (0, 30) | $5613 ($0, $38112) | $4651 ($0, $31297) | $855 ($0, $6061) | $107 ($0, $755) |
The summary of the estimated total costs for IP, TC, GP, and NP are shown in Table 3 with cost of anticancer drugs and for prevention of AEs, cost for medical treatments and cost for treatment of AEs. The regimen which showed the most expensive cost for treatment of AEs was IP regimen ($126), probably due to the high occurrence rate of AEs such as nausea, vomiting or diarrhea. The regimen which showed the most expensive cost for anticancer drugs and for prevention of AEs was TC regimen. In all regimens, the costs for cancer drugs and prevention of AEs were higher than the cost for medical treatment or for AEs treatment.
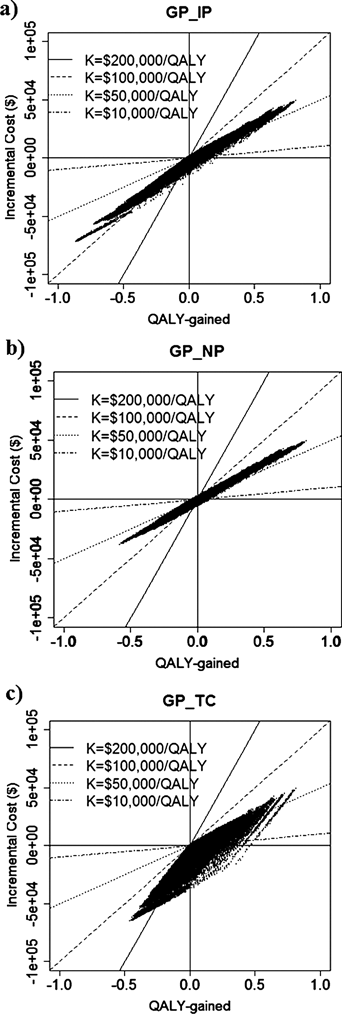
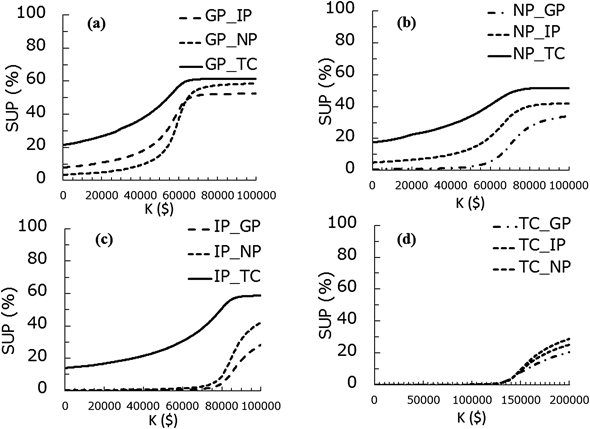
In Table 4, the simulated incremental costs, LYG, ICER per LYG, QALY-gained and ICER per QALY values for different combinations of the regimens are summarized. For example, the incremental cost in GP regimen against IP and TC regimen was negative, which means that the cost of GP regimen was less expensive. Figure 3 shows the relationship between the incremental cost and QALY-gained for three different combinations of the regimens as examples (GP vs. IP, GP vs. NP, and GP vs. TC) with various threshold values (K). In these panels, the plots in the fourth quadrant show that GP regimen is more effective and less costly, and the plots in the first quadrant show that GP regimen is more effective and costly. The superiority of a regimen depends on the threshold values (K), thus the %SUP can be presented as function of K. The %SUP for each combination of the four regimens is shown in Fig. 4 functions of K. The GP regimen was generally the most cost-effective, as GP showed generally greater %SUP compared with other regimens. For example, in case of K=$70000/year, the %SUP for the GP regimen are more than 50% (51.5, 55.1, and 61.2% against IP, NP and TC).
Table 4. Comparison of the Simulated Incremental Costs, LYG, ICER per LYG, QALY-Gained and ICER per QALY
| Pairs | Incremental cost | LYG | ICER per LYG | QALY-gained | ICER per QALY |
|---|
| GP–IP | −$1616 | 0.05 | $12687 | 0.01 | $72917 |
| GP–NP | $1834 | 0.19 | $7454 | 0.04 | $35981 |
| GP–TC | −$3101 | 0.03 | $3429 | 0.05 | $108222 |
| IP–GP | $1616 | −0.05 | — | −0.01 | — |
| IP–NP | $3450 | 0.14 | $6851 | 0.03 | $112997 |
| IP–TC | −$1485 | −0.02 | $16505 | 0.03 | −$497315 |
| NP–GP | −$1834 | −0.19 | — | −0.04 | — |
| NP–IP | −$3450 | −0.14 | — | −0.03 | — |
| NP–TC | −$4935 | −0.15 | $9145 | 0.01 | $308961 |
| TC–GP | $3101 | −0.03 | — | −0.05 | — |
| TC–IP | $1485 | 0.02 | — | −0.03 | — |
| TC–NP | $4935 | 0.15 | — | −0.01 | — |
DISCUSSION
In the present study, we applied a concept of cost-effectiveness acceptability to an M&S strategy for comparative cost-effective analysis of the four chemotherapy regimens. We firstly obtained the time-profiles of the survival curves and then, by using Monte Carlo methods, we simulated the typical administration schedules including washout and observation periods, and the possible occurrence of AEs and their grades as time series data sets were also included in the simulation. These approaches are difficult to be achieved by the Markov models.7,11)
We used a limited number of data for survival curves (OS or TTF) using the Weibull or the exponential function and this may lead to inaccurate estimates of the parameters. In order to overcome this problem, we manually determined the final parameter estimates by visually comparing the model predicted curves with the Kaplan–Meier plots for OS presented in the original article.16) Some previous reports used a method of computer digitization to extract the numeric data from Kaplan–Meier plots,29,30) or another report31) obtained the values for hazard rate based only on median OS values without performing a curve fitting under such a limited situation. Although our method to visually determine the parameters may cause some biases in the modeling results, our present method is one alternative way to reproducibly obtain the model predicted survival curves when the data available from literature are limited.
We used the data for efficacy and AEs from one clinical study, although there are some other clinical study reports regarding the platinum based regimens against NSCLC.32–37) The method we proposed can be flexibly applied to those other source of information. The simulation results may be different depending on the source data, and the M&S results using data from more than two studies may be expected for more reliable and flexible decision-making.
Some previous papers reported the systematic reviews regarding the cost-effectiveness of platinum-based chemotherapy for NSCLC.38–40) Bongers et al. performed a systematic search of the published studies and they found that GP regimen is generally most cost-effective compared with other platinum-based regimens.38) Brown et al. also reported the results of systematic review for NSCLC and GP regimen was found to be relatively more cost-effective than other regimens.39) Another systematic review by Chouaïd et al. suggested that GP regimen is a cost-saving choice.40) We cannot strictly compare these results with our findings by the M&S because the referenced data for costs, efficacy, AEs, QOL etc. and the evaluation methods of these previous reports are different. However, the similar results in these reports would partly support the validity of our evaluation procedures.
We used the threshold values (K) from $10000/QALY to $200000/QALY to estimate the values of %SUP based on the report by the National Institute of Health Care and Excellence (NICE). NICE reported that the maximum threshold values for a new intervention was around $50000 per QALY-gained, based on their evaluation in 1982,27,41) and it has been reported that this value would now be equivalent to about $200000 per QALY-gained, adjusted for health-care inflation.42) As another criteria, NICE showed €20000–€30000 per QALY-gained.
The four platinum-based regimens (IP, TC, GP, and NP) considered in our study showed similar efficacy profiles for advanced NSCLC but different toxicity profiles.16) Therefore, this is a typical case showing that a pharmacoeconomic analysis should be performed by including costs for prevention and treatments against AEs, as demonstrated in our study. It is expected that the results of this study will be confirmed in future clinical settings. Recently, other standard chemotherapy such as bevacizumab is used for NSCLC, which is more costly than the four regimens considered here. The validity and usefulness of the proposed M&S strategy should be further examined for such expensive drugs.
CONCLUSION
We developed an M&S process for probabilistic cost-effective analysis of cancer chemotherapy, and performed a cost-effective analysis based on probability distributions of survival times and occurrence rates of AEs, which enable precise comparison of different regimens. Our method would be useful for decision-making in choosing a chemotherapy regimen in terms of pharmacoeconomics in clinical setting.
Acknowledgment
This work was supported by ‘Promotion Plan for the Platform of Human Resource Development for Cancer’ by the Ministry of Education, Culture, Sports, Science and Technology (MEXT) of Japan.
Conflict of Interests
The authors declare no conflict of interest.
REFERENCES
- 1) Mariotto AB, Yabroff KR, Shao Y, Feuer EJ, Brown ML. Projections of the cost of cancer care in the United States: 2010–2020. J. Natl. Cancer Inst., 103, 117–128 (2011).
- 2) Warren JL, Yabroff KR, Meekins A, Topor M, Lamont EB, Brown ML. Evaluation of trends in the cost of initial cancer treatment. J. Natl. Cancer Inst., 100, 888–897 (2008).
- 3) Touchette DR, Doloresco F, Suda KJ, Perez A, Turner S, Jalundhwala Y, Tangonan MC, Hoffman JM. Economic evaluations of clinical pharmacy services: 2006–2010. Pharmacotherapy, 34, 771–793 (2014).
- 4) Poole CD, Smith J, Davies JS. Cost-effectiveness and budget impact of empirical vitamin D therapy on unintentional falls in older adults in the U.K. BMJ Open, 5, e007910 (2015).
- 5) Spiegelhalter DJ, Abrams KR, Myles JP. Bayesian Approaches to Clinical Trials and Health-Care Evaluation, Wiley, NJ (2004).
- 6) Hannouf MB, Sehgal C, Cao JQ, Mocanu JD, Winquist E, Zaric GS. Cost-effectiveness of adding cetuximab to platinum-based chemotherapy for first-line treatment of recurrent or metastatic head and neck cancer. PLoS ONE, 7, e38557 (2012).
- 7) Giuliani G, Grossi F, de Marinis F, Walzer S. Cost-effectiveness analysis of bevacizumab versus pemetrexed for advanced non-squamous NSCLC in Italy. Lung Cancer, 69 (Suppl. 1), S11–S17 (2010).
- 8) Lopes G, Gluck S, Avancha K, Montero AJ. A cost effectiveness study of eribulin versus standard single-agent cytotoxic chemotherapy for women with previously treated metastatic breast cancer. Breast Cancer Res. Treat., 137, 187–193 (2013).
- 9) Niraula S, Amir E, Vera-Badillo F, Seruga B, Ocana A, Tannock IF. Risk of incremental toxicities and associated costs of new anticancer drugs: a meta-analysis. J. Clin. Oncol., 32, 3634–3642 (2014).
- 10) Mueller C, Schur C, O’Connell J. Prescription drug spending: the impact of age and chronic disease status. Am. J. Public Health, 87, 1626–1629 (1997).
- 11) Karnon J, Brennan A, Pandor A, Fowkes G, Lee A, Gray D, Coshall C, Nicholls C, Akehurst R. Modelling the long term cost effectiveness of clopidogrel for the secondary prevention of occlusive vascular events in the U.K. Curr. Med. Res. Opin., 21, 101–112 (2005).
- 12) Ryder HF, McDonough C, Tosteson AN, Lurie JD. Decision analysis and cost-effectiveness analysis. Semin. Spine Surg., 21, 216–222 (2009).
- 13) Verhoef TI, Morris S, Mathur A, Singer M. Potential economic consequences of a cardioprotective agent for patients with myocardial infarction: modelling study. BMJ Open, 5, e008164 (2015).
- 14) Boyd KA, Jones RJ, Paul J, Birrell F, Briggs AH, Leung HY. Decision analytic cost-effectiveness model to compare prostate cryotherapy to androgen deprivation therapy for treatment of radiation recurrent prostate cancer. BMJ Open, 5, e007925 (2015).
- 15) Cromwell I, van der Hoek K, Malfair Taylor SC, Melosky B, Peacock S. Erlotinib or best supportive care for third-line treatment of advanced non-small-cell lung cancer: a real-world cost-effectiveness analysis. Lung Cancer, 76, 472–477 (2012).
- 16) Ohe Y, Ohashi Y, Kubota K, Tamura T, Nakagawa K, Negoro S, Nishiwaki Y, Saijo N, Ariyoshi Y, Fukuoka M. Randomized phase III study of cisplatin plus irinotecan versus carboplatin plus paclitaxel, cisplatin plus gemcitabine, and cisplatin plus vinorelbine for advanced non-small-cell lung cancer: four-arm cooperative study in Japan. Ann. Oncol., 18, 317–323 (2007).
- 17) Ihara R, Gentlemana RR. A language for data analysis and graphics. J. Comput. Graph. Stat., 5, 299–314 (1996).
- 18) Nafees B, Stafford M, Gavriel S, Bhalla S, Watkins J. Health state utilities for non-small cell lung cancer. Health Qual. Life Outcomes, 6, 84 (2008).
- 19) de Wit R, Herrstedt J, Rapoport B, Carides AD, Guoguang-Ma J, Elmer M, Schmidt C, Evans JK, Horgan KJ. The oral NK(1) antagonist, aprepitant, given with standard antiemetics provides protection against nausea and vomiting over multiple cycles of cisplatin-based chemotherapy: a combined analysis of two randomised, placebo-controlled phase III clinical trials. Eur. J. Cancer, 40, 403–410 (2004).
- 20) Nishimura J, Satoh T, Fukunaga M, Takemoto H, Nakata K, Ide Y, Fukuzaki T, Kudo T, Miyake Y, Yasui M, Morita S, Sakai D, Uemura M, Hata T, Takemasa I, Mizushima T, Ohno Y, Yamamoto H, Sekimoto M, Nezu R, Doki Y, Mori M, Multi-center Clinical Study Group of Osaka, Colorectal Cancer Treatment Group (MCSGO). Combination antiemetic therapy with aprepitant/fosaprepitant in patients with colorectal cancer receiving oxaliplatin-based chemotherapy (SENRI trial): a multicentre, randomised, controlled phase 3 trial. Eur. J. Cancer, 51, 1274–1282 (2015).
- 21) Glare P, Pereira G, Kristjanson LJ, Stockler M, Tattersall M. Systematic review of the efficacy of antiemetics in the treatment of nausea in patients with far-advanced cancer. Support. Care Cancer, 12, 432–440 (2004).
- 22) García-Carbonero R, Mayordomo JI, Tornamira MV, López-Brea M, Rueda A, Guillem V, Arcediano A, Yubero A, Ribera F, Gómez C, Trés A, Pérez-Gracia JL, Lumbreras C, Hornedo J, Cortés-Funes H, Paz-Ares L. Granulocyte colony-stimulating factor in the treatment of high-risk febrile neutropenia: a multicenter randomized trial. J. Natl. Cancer Inst., 93, 31–38 (2001).
- 23) Benson AB 3rd, Ajani JA, Catalano RB, Engelking C, Kornblau SM, Martenson JA Jr, McCallum R, Mitchell EP, O’Dorisio TM, Vokes EE, Wadler S. Recommended guidelines for the treatment of cancer treatment-induced diarrhea. J. Clin. Oncol., 22, 2918–2926 (2004).
- 24) Pazdur R. Endpoints for assessing drug activity in clinical trials. Oncologist, 13 (Suppl. 2), 19–21 (2008).
- 25) Rich JT, Neely JG, Paniello RC, Voelker CC, Nussenbaum B, Wang EW. A practical guide to understanding Kaplan–Meier curves. Otolaryngol. Head Neck Surg., 143, 331–336 (2010).
- 26) Altman DG, De Stavola BL, Love SB, Stepniewska KA. Review of survival analyses published in cancer journals. Br. J. Cancer, 72, 511–518 (1995).
- 27) Grosse SD. Assessing cost-effectiveness in healthcare: history of the $50000 per QALY threshold. Expert Rev. Pharmacoecon. Outcomes Res., 8, 165–178 (2008).
- 28) Watts RA, Mooney J, Barton G, MacGregor AJ, Shepstone L, Irvine L, Scott DG. The outcome and cost-effectiveness of nurse-led care in the community for people with rheumatoid arthritis: a non-randomised pragmatic study. BMJ Open, 5, e007696 (2015).
- 29) Diaby V, Adunlin G, Montero AJ. Survival modeling for the estimation of transition probabilities in model-based economic evaluations in the absence of individual patient data: a tutorial. Pharmacoeconomics, 32, 101–108 (2014).
- 30) Guyot P, Ades AE, Ouwens MJ, Welton NJ. Enhanced secondary analysis of survival data: reconstructing the data from published Kaplan–Meier survival curves. BMC Med. Res. Methodol., 12, 9 (2012).
- 31) Chan JK, Herzog TJ, Hu L, Monk BJ, Kiet T, Blansit K, Kapp DS, Yu X. Bevacizumab in treatment of high-risk ovarian cancer—A cost-effectiveness analysis. Oncologist, 19, 523–527 (2014).
- 32) Negoro S, Masuda N, Takada Y, Sugiura T, Kudoh S, Katakami N, Ariyoshi Y, Ohashi Y, Niitani H, Fukuoka M, CPT-11 Lung Cancer Study Group West. Randomised phase III trial of irinotecan combined with cisplatin for advanced non-small-cell lung cancer. Br. J. Cancer, 88, 335–341 (2003).
- 33) Stathopoulos GP, Veslemes M, Georgatou N, Antoniou D, Giamboudakis P, Katis K, Tsavdaridis D, Rigatos SK, Dimitroulis I, Bastani S, Loukides S, Vergos K, Marossis K, Grigoratou T, Kalatzi E, Charalambatou M, Paspalli A, Michalopoulou P, Stoka M, Gerogianni A. Front-line paclitaxel-vinorelbine versus paclitaxel-carboplatin in patients with advanced non-small-cell lung cancer: a randomized phase III trial. Ann. Oncol., 15, 1048–1055 (2004).
- 34) Georgoulias V, Ardavanis A, Tsiafaki X, Agelidou A, Mixalopoulou P, Anagnostopoulou O, Ziotopoulos P, Toubis M, Syrigos K, Samaras N, Polyzos A, Christou A, Kakolyris S, Kouroussis C, Androulakis N, Samonis G, Chatzidaki D. Vinorelbine plus cisplatin versus docetaxel plus gemcitabine in advanced non-small-cell lung cancer: a phase III randomized trial. J. Clin. Oncol., 23, 2937–2945 (2005).
- 35) Yang CH, Simms L, Park K, Lee JS, Scagliotti G, Orlando M. Efficacy and safety of cisplatin/pemetrexed versus cisplatin/gemcitabine as first-line treatment in East Asian patients with advanced non-small cell lung cancer: results of an exploratory subgroup analysis of a phase III trial. J. Thorac. Oncol., 5, 688–695 (2010).
- 36) Manegold C, van Zandwijk N, Szczesna A, Zatloukal P, Au JS, Blasinska-Morawiec M, Serwatowski P, Krzakowski M, Jassem J, Tan EH, Benner RJ, Ingrosso A, Meech SJ, Readett D, Thatcher N. A phase III randomized study of gemcitabine and cisplatin with or without PF-3512676 (TLR9 agonist) as first-line treatment of advanced non-small-cell lung cancer. Ann. Oncol., 23, 72–77 (2012).
- 37) Han JY, Nam BH, Kim HY, Yoon SJ, Kim HT, Lee JS. A randomized phase II study of irinotecan plus cisplatin versus irinotecan plus capecitabine with or without isosorbide-5-mononitrate in advanced non-small-cell lung cancer. Ann. Oncol., 23, 2925–2930 (2012).
- 38) Bongers ML, Coupé VM, Jansma EP, Smit EF, Uyl-de Groot CA. Cost effectiveness of treatment with new agents in advanced non-small-cell lung cancer: a systematic review. Pharmacoeconomics, 30, 17–34 (2012).
- 39) Brown T, Pilkington G, Bagust A, Boland A, Oyee J, Tudur-Smith C, Blundell M, Lai M, Martin Saborido C, Greenhalgh J, Dundar Y, Dickson R. Clinical effectiveness and cost-effectiveness of first-line chemotherapy for adult patients with locally advanced or metastatic non-small cell lung cancer: a systematic review and economic evaluation. Health Technol. Assess., 17, 1–278 (2013).
- 40) Chouaïd C, Crequit P, Borget I, Vergnenegre A. Economic evaluation of first-line and maintenance treatments for advanced non-small cell lung cancer: a systematic review. Clinicoecon. Outcomes Res., 7, 9–15 (2014).
- 41) Drummond MF, Mason AR. European perspective on the costs and cost-effectiveness of cancer therapies. J. Clin. Oncol., 25, 191–195 (2007).
- 42) Sullivan R, Peppercorn J, Sikora K, Zalcberg J, Meropol NJ, Amir E, Khayat D, Boyle P, Autier P, Tannock IF, Fojo T, Siderov J, Williamson S, Camporesi S, McVie JG, Purushotham AD, Naredi P, Eggermont A, Brennan MF, Steinberg ML, De Ridder M, McCloskey SA, Verellen D, Roberts T, Storme G, Hicks RJ, Ell PJ, Hirsch BR, Carbone DP, Schulman KA, Catchpole P, Taylor D, Geissler J, Brinker NG, Meltzer D, Kerr D, Aapro M. Delivering affordable cancer care in high-income countries. Lancet Oncol., 12, 933–980 (2011).