Abstract
The current Japanese Ministry of Health Labour and Welfare (MHLW)’s Guideline for Bioequivalence Studies of Generic Products uses averaged dissolution rates for the assessment of dissolution similarity between test and reference formulations. This study clarifies how the application of model-independent multivariate confidence region procedure (Method B), described in the European Medical Agency and U.S. Food and Drug Administration guidelines, affects similarity outcomes obtained empirically from dissolution profiles with large variations in individual dissolution rates. Sixty-one datasets of dissolution profiles for immediate release, oral generic, and corresponding innovator products that showed large variation in individual dissolution rates in generic products were assessed on their similarity by using the f2 statistics defined in the MHLW guidelines (MHLW f2 method) and two different Method B procedures, including a bootstrap method applied with f2 statistics (BS method) and a multivariate analysis method using the Mahalanobis distance (MV method). The MHLW f2 and BS methods provided similar dissolution similarities between reference and generic products. Although a small difference in the similarity assessment may be due to the decrease in the lower confidence interval for expected f2 values derived from the large variation in individual dissolution rates, the MV method provided results different from those obtained through MHLW f2 and BS methods. Analysis of actual dissolution data for products with large individual variations would provide valuable information towards an enhanced understanding of these methods and their possible incorporation in the MHLW guidelines.
Ensuring similarity in the performance of oral solid dosage forms, such as between pre- and post-changed approved products or innovator and generic products, requires appropriate methods in comparing their dissolution profiles. The European Medicines Agency (EMA), the U.S. Food and Drug Administration (FDA), and the Ministry of Health Labour and Welfare (MHLW, Japan) guidelines on bioequivalence list the model-independent method using similarity factors (Method A), difference factor (f1), or a similarity factor (f2), as main methods for comparing dissolution profiles.1–4) The FDA and EMA guidelines also allow the use of the model-independent multivariate confidence region procedure (Method B) for the comparison of profiles that show large variations in individual dissolution rates, without detailed description of the procedure. However, the current MHLW guideline does not describe the use of Method B.
Several procedures have been reported to assess the similarity of dissolution profiles having large variations. A “bootstrap” method (BS method), which compares dissolution profiles by calculating the statistical distribution of f2 values, simulates their distribution of expected values and calculates the 90% confidence interval.5) The method compares the lower limit of this interval of expected f2 value (f2*) with the f2 criterion to assess dissolution similarity. Dissolution profiles with large variations can also be compared through another multivariate analysis procedure (MV method), which uses the Mahalanobis distance (DM) for this purpose.6) The DM values are based on the pooled variances at each time point and correlations among these,7) while f2 statistics are based on the Euclid distance, established on the differences of averaged dissolution rates. Limited studies describe the effects of different methods of analysis on the similarity outcome using a small number of dissolution profiles and/or simulated ones.8–10) However, it is unclear whether the data used for evaluations represent the dissolution profiles of many formulations on the market.
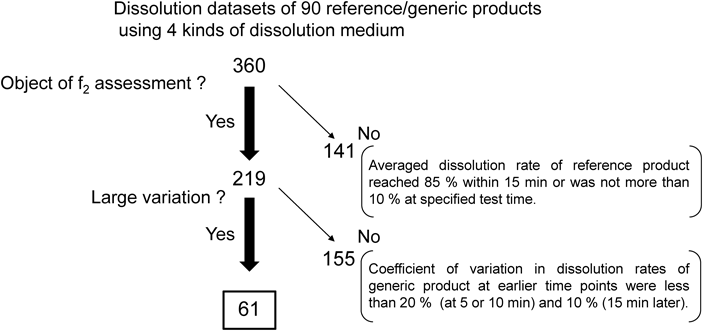
Consequently, this study compares the methods used to assess the similarity of dissolution profiles with large variations in individual dissolution rates by analyzing dissolution profiles of innovator and generic products marketed in Japan. Sixty-one datasets of dissolution profiles with large variations in individual dissolution rates of generic products (Fig. 1) out of 360 datasets were assessed on their similarity through the f2 statistics defined in the MHLW guidelines (MHLW f2 method) and two Method B procedures, that is, the BS and MV methods. The analysis of actual dissolution data of products provided valuable information for an enhanced understanding of the utilized methods and their possible incorporation in the MHLW guidelines.
MATERIALS AND METHODS
DataDatasets of dissolution profiles of generic and corresponding reference innovator products (six tablets each), obtained for quality evaluation activities of products on the market by the Formulation Evaluation Working Group in Expert Committee on Quality of Generic Pharmaceutical Products in Japan were used for this study.11,12) The working group is composed of 11 public health science institutes. Among 360 datasets of dissolution profiles (90 generic formulations, 4 medium, 10 active pharmaceutical ingredients) reported in the 13th Committee, 61 datasets of dissolution profiles assessed using the f2 statistics as per the MHLW guidelines3) and showed large variations in the individual dissolution rates of generic products (coefficients of variation were above 20% at 5 or 10 min, or above 10% at 15 min or later) were used for the comparison (Fig. 1).
f2 Statistics According to MHLW Guidelines (MHLW f2 Method)The comparison of dissolution profiles using the MHLW f2 method was based on MHLW guidelines,3) which specify testing times as follows: 2 h in a medium of pH 1.2 and 6 h in other test media, or the time at which the average dissolution of the reference product reaches 85%. The dissolution rates were obtained at three or four time points, chosen according to the average dissolution of reference products. The acceptance criteria for dissolution similarity were set based on the average dissolution of reference products, namely, f2≥42 (the average dissolution of reference product reaches 85% within the specified testing time), f2≥46 (the average dissolution of reference product is between 50 and 85% at the specified testing time), and f2≥53 (the average dissolution of reference product is below 50% at the specified testing time).
Method B: BS and MV MethodsThe BS method was applied for the assessment of dissolution similarity using “PhEq_bootstrap version 1.2,” an open source software programed to assess dissolution similarity by FDA’s and EMA’s f2 computation with the bootstrap technique.9,13) All data points until average dissolutions of both reference and generic products that reached 85% were used according to FDA recommendations. The datasets of dissolution profiles were created by random sampling of individual dissolution rates at each time point in the original data. The number of artificially created dissolution profiles was set to 5000, which was sufficient to stabilize the results. The confidence interval was set to 90%. Dissolution similarity was concluded when the lower confidence interval for the expected f2 value (f2*) calculated by the software was not below the similarity acceptance criteria. The same acceptance criteria as for the MHLW f2 method were applied for similarity assessment.
The MV method was applied as previously described6) using Microsoft Excel. Global similarity limits were set based on the average dissolutions of reference products to ±15, ±12, and ±9% (the average dissolution of reference product reaches 85%, between 50 and 85%, and below 50% at the specified testing time, respectively) according to MHLW guidelines. The similarity limits were calculated using the global similarity limit, subsequently compared to the upper 90% limit of the confidence interval of true DM (DMu). Dissolution similarity was concluded when the DMu value was not above the similarity limit. The time points used for the analysis of Method B are not specified in FDA guidelines.1) Therefore, all data points or those until the reference product reached 85% dissolution were used, according to MHLW guidelines.
RESULTS AND DISCUSSION
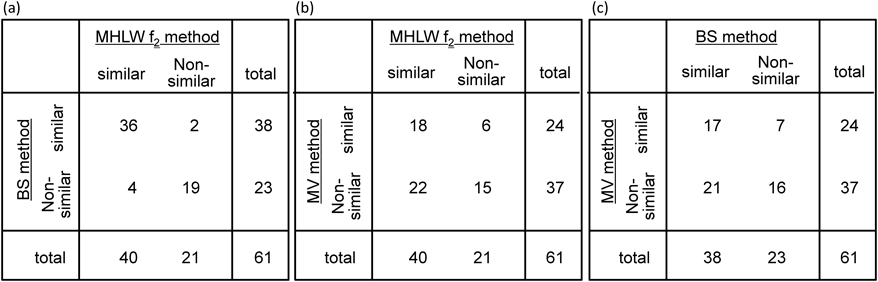
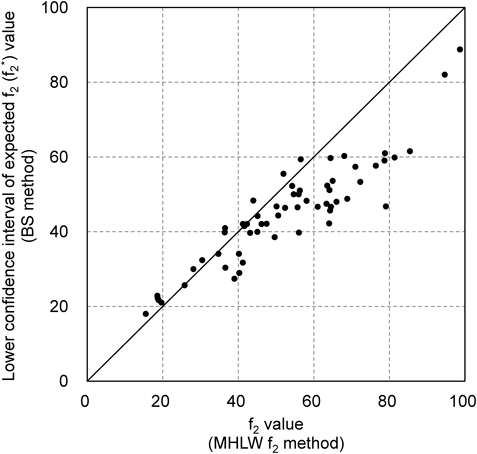
Among the 219 dissolution datasets of reference/generic products required to be assessed using MHLW f2 methods, the coefficient of variation of 61 datasets (28%) exceeded the criteria for the use of Method A in the FDA and EMA guidelines (Fig. 1). The relatively high ratio of formulations with large variations in individual dissolution data indicates the necessity for setting appropriate methods (e.g., Method B) to evaluate dissolution similarities. Figure 2 shows the number of reference and generic product dissolution profile datasets that showed similar or non-similar dissolution profiles when assessed using the MHLW f2 method and the two types of Method B. Among the 61 datasets of dissolution profiles of reference/generic products, analysis through the MHLW f2, BS, and MV methods categorized 40, 38, and 24 combinations as “similar,” respectively. Moreover, the MHLW f2 and BS methods showed almost similar conclusions (Fig. 2a). The sensitivity of the BS method to the MHLW f2 method was higher (36/40=0.9) than that of the MV method (18/40=0.45), which agreed with the results of the previous studies.9) The large variations in individual dissolution rates expanded the confidence intervals of the expected f2 value, resulting in a decrease in the f2* value. Although most f2* values obtained by the BS method were lower than the f2 values obtained by the MHLW f2 method (Fig. 3), the difference in the time points used in the analysis could explain the higher f2* values obtained through the BS method compared to the f2 values of the MHLW f2 method. Therefore, adopting the BS method in the MHLW guidelines would require specifying appropriate measurement time points for calculating f2 values.
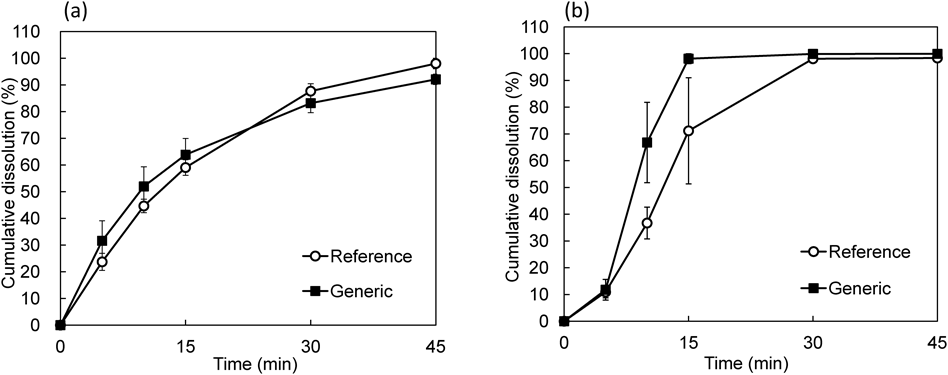
Analysis through the MV method categorized a smaller number of datasets as similar dissolution profiles compared to those analyzed by the MHLW f2 and BS methods. Around half of the datasets categorized as similar dissolution profiles by using the MHLW f2 or BS methods were concluded to be non-similar in the MV method (Figs. 2b, c). This was different from the comparison between the BS and MHLW f2 methods (Fig. 2a). Some datasets were categorized as non-similar, although the differences of mean dissolution rates were within 15% at all time points (Fig. 4a, Table 1). In case of two dissolution curves crossing each other, analysis through the MV method was reported to be less sensitive to that through the f2 method,9) requiring special attention on using the MV method in this case. Conversely, six dissolution datasets, categorized as non-similar on using the MHLW f2 method, were concluded to be similar through the MV method. Among these, two datasets showed nearly 100% dissolution of test products at an early time point and reduced the variance-covariance matrix, resulting in a tendency to meet the similarity criteria of the MV method. An example of a dissolution profile showing different similarities depending on the analysis method is shown in Fig. 4b and Table 2.
Table 1. Similarity Assessment of Dissolution Profiles Shown in
Fig. 4a by 3 Different Methods
| Generic | Similarity criteria | Assessment |
|---|
| MHLW f2 method | f2=64.13 | ≧42 | Similar |
| BS method | f2*=51.14 | ≧42 | Similar |
| MV method | DMu=9.61, Limit=8.91 | DMu≦Limit | Non-similar |
Table 2. Similarity Assessment of Dissolution Profiles Shown in
Fig. 4b by 3 Different Methods
| Generic | Similarity criteria | Assessment |
|---|
| MHLW f2 method | f2=40.26 | ≧42 | Non-similar |
| BS method | f2*=28.96 | ≧42 | Non-similar |
| MV method | DMu=9.49, Limit=27.61 | DMu≦Limit | Similar |
The number of tablets used in the analysis was associated with the second degree of freedom in the F-distribution.6) A relatively small number of tablets (six tablets) and the limited time points (up to nine) used for the analysis in this study would explain the different conclusions on dissolution similarity through the MV method compared to MHLW f2.
CONCLUSION
This study, using actual dissolution profiles with large individual variations, indicated a large difference in the dissolution similarity assessed by the current MHLW f2 method and two Method B procedures (BS and MV methods). The use of datasets on actual dissolution profiles is as important as using simulated datasets for a better understanding of the advantages and drawbacks of the analysis methods. However, these results may vary depending on the criteria applied in each method. Adopting these assessment methods in the MHLW guidelines would require deliberate consideration, including specifying a detailed procedure, and should be based on an appropriate rationale.
Acknowledgments
We are grateful to Dr. Yomota of the Pharmaceutical and Medical Device Regulatory Science Society of Japan (PMRJ), Mr. Takahashi of Astellas Pharma Inc., and members of the study group in the Office of Generic Drugs, Pharmaceuticals and Medical Devices Agency (PMDA) for the valuable discussions regarding analysis by Method B. This work is partly supported by the Research on Regulatory Science of Pharmaceuticals and Medical Devices from the Japan Agency for Medical Research and Development (AMED), and by a Health and Labour Sciences Research Grant from the Ministry of Health, Labour and Welfare of Japan.
Conflict of Interest
The authors declare no conflict of interest.
REFERENCES
- 1) U.S. Food and Drug Administration. Guidance for Industry, Dissolution Testing of Immediate Release Solid Oral Dosage Forms. (1997).
- 2) European Medicines Agency. Guideline on the Investigation of Bioequivalence. (2010).
- 3) Ministry of Health. Labour and Welfare of Japan. Guideline for Bioequivalence Studies of Generic Products. (2012).
- 4) Moore JW, Flanner HH. Mathematical comparison of dissolution profiles. Pharm. Tech., 20, 64–74 (1996).
- 5) Shah VP, Tsong Y, Sathe P, Liu JP. In vitro dissolution profile comparison—statistics and analysis of the similarity factor, f2. Pharm. Res., 15, 889–896 (1998).
- 6) Tsong Y, Hammerstrom T, Sathe P, Shah VP. Statistical assessment of mean differences between two dissolution data sets. Ther. Innov. Regul. Sci., 30, 1105–1112 (1996).
- 7) LeBlond D. In vitro dissolution testing: statistical approaches and issues. Nonclinical Statistics for Pharmaceutical and Biotechnology Industries. Springer, New York, pp. 605–630 (2016).
- 8) Maggio RM, Castellano PM, Kaufman TS. A new principal component analysis-based approach for testing “similarity” of drug dissolution profiles. Eur. J. Pharm. Sci., 34, 66–77 (2008).
- 9) Mangas-Sanjuan V, Colon-Useche S, Gonzalez-Alvarez I, Bermejo M, Garcia-Arieta A. Assessment of the regulatory methods for the comparison of highly variable dissolution profiles. AAPS J., 18, 1550–1561 (2016).
- 10) Saranadasa H, Krishnamoorthy K. A multivariate test for similarity of two dissolution profiles. J. Biopharm. Stat., 15, 265–278 (2005).
- 11) “Expert Committee on Quality of Generic Pharmaceutical Products.”: ‹http://www.nihs.go.jp/drug/ecqaged.html›, accessed 15 April, 2015.
- 12) Shibata H, Yoshida H, Izutsu K, Yomota C, Goda Y, Okuda H. Scientific and regulatory approaches to confirm quality and improve patient perceptions of generic drug products in Japan. AAPS Open, 2, 6 (2016).
- 13) Mendyk A, Pacławski A, Szlek J, Jachowicz R. PhEq_bootstrap: Open-source software for the simulation of f2 distribution in cases of large variability in dissolution profiles. Dissolut. Technol., 20, 13–17 (2013).