METHODS
ChemicalsLuseogliflozin, (2S,3R,4R,5S,6R)-2-{5-[(4-ethoxyphenyl)methyl]-2-methoxy-4-methylphenyl}-6-(hydroxymethyl)thiane-3,4,5-triol hydrate; C23H30O6S xH2O; molecular weight (for anhydrate) 434.55 (Fig. 1).
Study Design, Population, and PK and PD DataPK and PD data were acquired from four active groups of the clinical pharmacology study performed in Japanese outpatients with T2DM whose glycated hemoglobin (HbA1c) ranged from 6.9 to 10.3%.9) Thirty-one patients (26 male and 5 female) were allocated to four luseogliflozin dose groups: 0.5 mg (n=7), 1 mg (n=8), 2.5 mg (n=8), and 5 mg (n=8), once daily before breakfast for 7 d. They were prescribed a stable therapeutic diet, and oral antidiabetic drugs and insulin were prohibited for 4 weeks before administration of the study drug. Only two patients had taken oral antidiabetic drugs 4 weeks before study drug administration. Age, weight, body mass index, estimated glomerular filtration rate (eGFR),22) fasting plasma glucose (FPG), and UGE at baseline (before first luseogliflozin administration) of patients ranged from 43 to 74 years, 51.9 to 99.3 kg, 19.1 to 32.0 kg/m2, 59 to 116 mL/min, 113 to 229 mg/dL, and 0.3 to 81.4 g/d, respectively (Table 1). Patients consumed a standardized meal of approximately 600 kcal (approximately 16% protein, 21% fat, and 63% carbohydrate) just after luseogliflozin administration (0 h), and 4 and 12 h later on days 1 and 7. On day −1, they consumed this standardized meal at the same time points as on days 1 and 7.
Table 1. Patient Characteristics at Baseline
| Dose | Total |
|---|
| 0.5 mg | 1 mg | 2.5 mg | 5 mg |
|---|
| Number of subjects | 7 | 8 | 8 | 8 | 31 |
| Gender | (male/female) | 6/1 | 6/2 | 8/0 | 6/2 | 26/5 |
| Age | (years) | 57.1±9.7 | 59.8±10.8 | 55.9±8.8 | 57.6±8.2 | 57.6±9.0 |
| | (46–71) | (43–74) | (45–68) | (47–69) | (43–74) |
| Weight | (kg) | 67.71±14.40 | 72.12±18.57 | 68.00±7.90 | 71.80±9.59 | 69.98±12.74 |
| | (51.9–92.9) | (52.4–99.3) | (58.6–76.6) | (57.5–82.3) | (51.9–99.3) |
| BMI | (kg/m2) | 23.55±3.62 | 25.94±4.98 | 24.38±3.35 | 26.13±2.83 | 25.05±3.75 |
| | (20.8–30.1) | (19.1–32.0) | (19.9–29.2) | (21.3–29.1) | (19.1–32.0) |
| eGFR | (mL/min) | 88.6±16.9 | 90.8±16.9 | 90.5±13.7 | 92.5±25.2 | 90.6±17.8 |
| | (61–110) | (71–113) | (62–106) | (59–116) | (59–116) |
| HbA1c | (%) | 8.26±1.05 | 7.61±1.01 | 8.30±1.08 | 7.59±1.01 | 8.33±1.04 |
| | (7.4–10.3) | (6.9–9.4) | (7.3–10.2) | (7.0–10.3) | (6.9–10.3) |
| FPG | (mg/dL) | 166.0±29.1 | 151.3±32.0 | 166.5±37.9 | 150.1±22.0 | 158.2±30.3 |
| | (142–209) | (113–201) | (122–229) | (122–183) | (113–229) |
| UGE | (g/d) | 33.5±25.0 | 17.0±15.3 | 44.1±29.4 | 16.2±14.0 | 27.5±23.9 |
| | (0.466–79.1) | (1.10–42.6) | (7.79–81.4) | (0.329–45.7) | (0.329–81.4) |
Displayed by the mean±S.D. (min–max) except gender and number of subjects. BMI, body mass index; eGFR, estimated glomerular filtration rate; HbA1c, haemoglobin A1c; FPG, fasting plasma glucose; UGE, urinary glucose excretion.
Plasma concentrations of luseogliflozin were measured at 0, 0.25, 0.5, 1, 1.5, 2, 3, 4, 6, 8, 12, and 24 h after luseogliflozin administration on days 1 and 7 and at 48, 72, and 96 h after luseogliflozin administration on day 7 (Supplementary Fig. S1). In addition, plasma glucose levels were measured at 0, 0.5, 1, 2, 4, 4.5, 5, 6, 8, 12, 12.5, 13, 14, 16, and 24 h after the start of breakfast on day −1; at 0, 0.5, 1, 2, 4, 4.5, 5, 6, 8, 12, 12.5, 13, 14, 16, and 24 h after luseogliflozin administration on days 1 and 7; and at 96 h after luseogliflozin administration on day 7 (Supplementary Fig. S1). Urinary glucose samples were collected at 0–2, 2–4, 4–6, 6–8, 8–10, 10–12, 12–14, 14–16, and 16–24 h after the start of breakfast on day −1; at 0–2, 2–4, 4–6, 6–8, 8–10, 10–12, 12–14, 14–16, and 16–24 h after luseogliflozin administration on days 1 and 7; and at 24–48, 48–72, and 72–96 h after luseogliflozin administration on day 7. Measurements of plasma concentration of luseogliflozin, plasma glucose level, and urinary glucose have been described previously.7)
Ethical ApprovalWe analyzed PK and PD data from Japanese patients with T2DM enrolled in a clinical pharmacology study, which was conducted in accordance with the ethical standards of the Helsinki Declaration and the Japanese Pharmaceutical Affairs Law and Good Clinical Practice. The study protocol was approved by the Institutional Review Board of P-One Clinic, Keikokai Medical Corporation. The study design, study population, and PK and PD data outlined here are the only data analyzed in this report. Additional information is provided in a previous report.9)
Informed ConsentInformed consent was obtained from all individual participants included in the clinical study.
PD Model StructureA PD model was developed based on the mechanisms of luminal glucose reabsorption by SGLT1/2 for analysis of UGE at day −1 to estimate individual Vmax2 and Vmax1. Glucose reabsorption rate without an inhibitor is simply described by the Michaelis–Menten process as Eq. (1):
 | (1) |
where v is the glucose reabsorption rate of SGLTs,
Vmax,j is the transport capacity of SGLT1 (
j=1) and SGLT2 (
j=2), Glu is the luminal glucose, and
Km,j is the glucose affinity for SGLT1 (
j=1) and SGLT2 (
j=2). Moreover, we used the rate constant “
Kg” to describe the time lag of excretion derived in the tubule. UGE rate at 2–4 h after each meal was higher than that at 0–2 h (
Table 2). On the other hand, the
AUC of plasma glucose 2–4 h was lower than at 0–2 h (
Table 2). Because the UGE peak was delayed after the
AUC peak of plasma glucose, we assumed a lag time after the proximal tubule and before urine excretion to fit the observed UGE (
Fig. 2). The lag was also observed in the absence of luseogliflozin at day −1 (
Table 2); therefore, we set the
Kg in the PD model. In the PD model, the Michaelis–Menten process and rate constant
Kg were adopted for the population analysis of UGE at day −1 to estimate the individual
Vmax2 and
Vmax1.
Table 2. UGE Rate and Partial
AUC of Plasma Glucose of Each Meal on Days −1 and 7
| Variables | Time interval (after administration) | Unit | Dose |
|---|
| 0.5 mg | 1 mg | 2.5 mg | 5 mg |
|---|
| Day 7 |
| UGE rate | After breakfast (0–2 h) | (g/h) | 4.0 (1.5) | 4.9 (1.3) | 7.0 (3.0) | 6.9 (1.5) |
| After breakfast (2–4 h) | (g/h) | 4.4 (1.5) | 5.2 (1.5) | 6.9 (1.8) | 6.1 (2.1) |
| After lunch (4–6 h) | (g/h) | 4.5 (1.4) | 4.7 (1.6) | 6.8 (1.6) | 6.0 (1.9) |
| After lunch (6–8 h) | (g/h) | 6.6 (2.6) | 6.2 (1.8) | 8.6 (2.7) | 7.9 (3.2) |
| After supper (12–14 h) | (g/h) | 3.0 (1.0) | 3.3 (0.9) | 5.3 (0.7) | 4.8 (1.2) |
| After supper (14–16 h) | (g/h) | 5.5 (2.2) | 4.2 (1.3) | 7.4 (1.5) | 7.3 (1.8) |
| Partial AUC of plasma glucose | After breakfast (0–2 h) | (mg·h/dL) | 427 (65) | 422 (65) | 389 (52) | 384 (40) |
| After breakfast (2–4 h) | (mg·h/dL) | 383 (93) | 359 (57) | 349 (54) | 325 (51) |
| After lunch (4–6 h) | (mg·h/dL) | 409 (91) | 372 (57) | 376 (59) | 338 (44) |
| After lunch (6–8 h) | (mg·h/dL) | 477 (119) | 414 (73) | 426 (71) | 372 (63) |
| After supper (12–14 h) | (mg·h/dL) | 413 (34) | 377 (58) | 374 (31) | 348 (63) |
| After supper (14–16 h) | (mg·h/dL) | 511 (75) | 448 (74) | 454 (34) | 407 (78) |
| Day −1 |
| UGE rate | After breakfast (0–2 h) | (g/h) | 1.4 (1.3) | 1.3 (1.1) | 2.2 (1.5) | 1.3 (0.7) |
| After breakfast (2–4 h) | (g/h) | 2.0 (1.4) | 1.1 (1.1) | 2.8 (2.3) | 1.6 (1.7) |
| After lunch (4–6 h) | (g/h) | 2.3 (1.7) | 0.7 (0.6) | 2.8 (1.9) | 1.0 (1.0) |
| After lunch (6–8 h) | (g/h) | 2.7 (2.3) | 0.8 (0.6) | 3.7 (2.7) | 1.2 (2.0) |
| After supper (12–14 h) | (g/h) | 1.4 (0.9) | 0.6 (0.5) | 1.6 (1.3) | 0.6 (0.5) |
| After supper (14–16 h) | (g/h) | 3.2 (2.0) | 1.9 (1.7) | 3.6 (2.2) | 1.3 (1.1) |
| Partial AUC of plasma glucose | After breakfast (0–2 h) | (mg·h/dL) | 481 (75) | 472 (79) | 521 (93) | 461 (48) |
| After breakfast (2–4 h) | (mg·h/dL) | 469 (110) | 414 (89) | 497 (116) | 415 (66) |
| After lunch (4–6 h) | (mg·h/dL) | 529 (94) | 440 (70) | 528 (95) | 418 (62) |
| After lunch (6–8 h) | (mg·h/dL) | 534 (114) | 435 (91) | 535 (107) | 411 (60) |
| After supper (12–14 h) | (mg·h/dL) | 489 (64) | 437 (60) | 489 (103) | 414 (63) |
| After supper (14–16 h) | (mg·h/dL) | 545 (102) | 507 (95) | 560 (89) | 468 (67) |
Values are mean (S.D.). AUC, area under the curve; UGE, urinary glucose excretion.
In the presence of luseogliflozin, glucose reabsorption by SGLT1/2 is inhibited by luseogliflozin, and glucose is excreted in urine. Luseogliflozin is a competitive inhibitor of SGLT2.20) Because luseogliflozin competes with glucose for SGLT1/2 within renal tubule segments 1 and 3, it was also thought to be a competitive, rather than an uncompetitive or noncompetitive, inhibitor to SGLT1. As the inhibition is competitive, the glucose reabsorption rate of SGLT1/2 inhibited by luseogliflozin is represented by Eq. (2).23)
 | (2) |
where
v is the glucose reabsorption rate of SGLTs,
Vmax,j is the transport capacity of SGLT1 (
j=1) and SGLT2 (
j=2), Glu is the luminal glucose,
Km,j is the glucose affinity for SGLT1 (
j=1) and SGLT2 (
j=2), Luseo is the luminal luseogliflozin concentration, and
Ki,j is the inhibition constant of luseogliflozin to SGLT1 (
j=1) and SGLT2 (
j=2). Equation (2) was used in “PK-PD model 1” to calculate the reabsorption rate of SGLT1/2.
However, as the inhibition rate constant of luseogliflozin for SGLT2 was small, the glucose reabsorption rate could not be simply expressed by Eq. (2). Regarding the kinetics of inhibition rate constants, Dahl reported that smaller Kon and Koff values led to slowing of the association and dissociation reactions.24) Hummel et al. reported that the inhibition rate constant Kon of phlorizin, an SGLT2 inhibitor, was 9.72 1/nM/h and Koff was 108 1/h,25) which were large values, and the dissociation half-time (T1/2,off) was 24 s, which was very small. Compared with phlorizin, the Kon and Koff of luseogliflozin for SGLT2 (0.084 1/nM/h and 0.11 1/h, respectively) were small and the T1/2,off (7.0 h) was large.20) Accordingly, the reabsorption rate of SGLT2 inhibited by luseogliflozin should be expressed as a product of Vmax2 and fraction of SGLT2-Glu complex (Eq. 3). The fraction of SGLT2-Glu complex is calculated using three differential Eqs. (4)–(6) in consideration of Kon and Koff.26)
 | (3) |
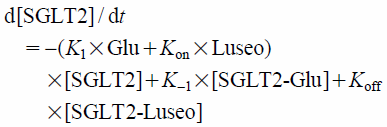 | (4) |
 | (5) |
 | (6) |
where
v is the glucose reabsorption rate of SGLT2 inhibited by Luseo,
Vmax2 is the transport capacity of SGLT2, [SGLT2-Glu] is the fraction of SGLT2-glucose complex, [SGLT2] is the fraction of free SGLT2, [SGLT2-Luseo] is the fraction of SGLT2-luseogliflozin complex, [SGLT2]+[SGLT2-Glu]+[SGLT2-Luseo]=1,
K1 and
K−1 are rate constants,
K−1/
K1=
Km2 (equilibrium 1 in
Fig. 2), and
Km2 is the glucose affinity for SGLT2. In “PK-PD model 2,” the reabsorption rates of SGLT1 and SGLT2 were calculated by Eqs. 2 and 3, respectively.
In order to verify the need for Kon and Koff, both PK-PD models 1 and 2 were compared. For this mechanism-based PK-PD model, several assumptions were adopted. The free fraction of luseogliflozin calculated from a plasma protein binding of 96%27) was assumed to be the same as the luminal luseogliflozin concentration in the proximal tubule. The glucose level just after filtration in the glomerulus was assumed to be consistent with the plasma glucose level and then was devoted to reabsorption. eGFR was used for the flow rate of glucose until segment 3 in the proximal tubule.
PK Model AnalysisThe plasma luseogliflozin concentrations of 31 patients with T2DM were individually analyzed using a 2-compartment model with first-order absorption and absorption lag time. Basic statistics of PK parameters were calculated.
PK-PD Model AnalysisFor the PK-PD analysis, we used the time course of individual plasma glucose levels and the free fraction of plasma luseogliflozin concentration and performed a nonlinear mixed effect model analysis to predict the UGE of each collection interval to estimate parameters. For accurate PK-PD regression, we used predicted plasma luseogliflozin concentrations calculated from individually estimated PK parameters analyzed by WinNonlin using a 2-compartment model with first-order absorption and absorption lag time. Subsequently, these concentrations were converted to free fractions and used for PK-PD modeling. If there was a time point at which plasma glucose level was absent for regression of UGE, values of this time point were linearly interpolated using observed values.
Although Vmax1 and Vmax2 were fundamental to predicting UGE, we found no literature regarding the in vitro estimation of Vmax. Accordingly, we estimated individual Vmax1 and Vmax2 by population analysis using data from day −1, the day before luseogliflozin administration. The model-building process reported here was performed by following two steps:
1. Population analysis of UGE at day −1 using PD model and estimation of individual Vmax1 and Vmax2
2. Population analysis of UGE after luseogliflozin administration using PK-PD model and estimation of PK-PD parameters
Step 1: Population Analysis of UGE at Day −1 Using PD Model and Estimation of Individual Vmax1 and Vmax2Population analysis of UGE from 31 patients with T2DM at day −1 was performed using a PD model with Km1 and Km2 fixed to in vitro estimated values, 1.8 and 4.9 mM, respectively.28) Normal distribution was assumed for intra-individual variability. Log-normal distribution was assumed for inter-individual variability of PD parameters, Vmax1, Vmax2, and Kg. Individual Vmax1 and Vmax2 values were estimated by the POSTHOC option. A PD model with rate constant Kg was compared to a PD model without Kg based on the deterioration of objective function (OBJ) and visual inspection of the scatter plot of observed UGE against individually predicted UGE in both models. Residual plots against time in both models were made to confirm the necessity of Kg. Basic statistics of estimated Vmax1, Vmax2, and contribution of Vmax{Vmax1/(Vmax1+Vmax2)} were calculated. Moreover, exploratory analyses of correlation between Vmax and background data were performed. Age, body weight, body mass index, eGFR, total bilirubin, HbA1c, FPG, and albumin were analyzed by regression analysis to Vmax, and significant variables were analyzed as covariates by NONMEM based on the OBJ using the log-likelihood ratio test. A p value of 0.05, representing a decrease in the OBJ of 3.84, was considered statistically significant (chi square distribution, degrees of freedom=1).
Step 2: Population Analysis of UGE after Luseogliflozin Administration Using PK-PD Model and Estimation of PK-PD ParametersPopulation mean and inter-individual variability of PK-PD parameters, Ki2 (and Kon for model 2) were estimated using nonlinear mixed-effects modeling based on the two PK-PD models. Normal distribution was assumed for intra-individual variability. Log-normal distribution was assumed for inter-individual variability of PK-PD parameters, Ki2 (and Kon for model 2). In this analysis, Km1 and Km2 values from the literature28) and individually estimated Vmax1 and Vmax2 in step 1 were used as fixed values. For model 2, Koff was calculated using Ki2 and Kon (Koff=Ki2×Kon).25) T1/2,off was calculated by loge2/Koff.28) Comparison between both models was based on the deterioration of OBJ and visual inspection of the scatter plot of observed UGE against the individually predicted UGE of both models. Moreover, the observed UGE and individually predicted mean was plotted against time after administration for evaluation of fitting to characteristic time course of UGE caused by luseogliflozin.
Sensitivity Analysis of Ki1 and K1We found no literature regarding the Ki1 of luseogliflozin and K1 for SGLT2. We estimated Ki1 using in vitro selectivity of luseogliflozin of 1770, which was the IC50 of SGLT1 divided by IC50 of SGLT2.5) The estimated Ki1 value was 1950 nM (1770-fold the Ki2 value of 1.10 nM). To confirm the validity of the Ki1 value, a sensitivity analysis using Ki1 values of 195, 1950, and 19500 nM was performed using a selected population PK-PD model. There was also no literature regarding K1 value for SGLT2-Glu complex in equilibrium 1 (Fig. 2). If rapid equilibrium is assumed, K1 must be large enough not to generate a binding delay between SGLT2 and glucose.29) All NONMEM analyses were done with a K1 value of 10. Sensitivity analysis using K1 values of 0.3, 1, and 3 1/(mg/dL)/h was performed using a selected population PK-PD model.
Time Course of Inhibition Ratio of SGLT2To speculate on the reason for the characteristic time course of UGE caused by luseogliflozin, the mean predicted inhibition ratios of SGLT2 against time on day 7 in PK-PD models 1 and 2 were plotted for each dose. The predicted inhibition ratio of SGLT2 was calculated as a fraction of the SGLT2-luseogliflozin complex in PK-PD model 2. The predicted inhibition ratio of SGLT2 in PK-PD model 1 was calculated by Eq. (2).
PK-PD Model ValidationThe population PK-PD model selected from the goodness-of-fit plots was evaluated using a nonparametric visual predictive check. Simulation datasets of 1000 subjects per dose were produced. Recommended doses of 2.5 and 5 mg were selected. Dosage, plasma glucose data, and individually estimated Vmax1 and Vmax2 values were repeatedly sampled from the population PK-PD modeling dataset. PK parameters for 1000 subjects by dose were randomly simulated from basic statistics of each PK parameter. Plasma luseogliflozin concentration was calculated using these PK parameters and then using the converted free fraction of luseogliflozin. UGE was simulated based on the selected population PK-PD model in which the population mean and inter-individual variability of Ki2 (and Kon for model 2), as well as the intra-individual variability, were fixed. A 5, 50, and 95th percentile of predicted UGE was created for each time point, and the prediction was evaluated by visual inspection.30)
SoftwareCompartment model analysis of plasma concentrations of luseogliflozin was performed using Phoenix WinNonlin (version 6.2, Certara). UGE regression analysis and simulation were performed using NONMEM (version 7.2, ICON). The first-order conditional estimation (FOCE) method was selected for the estimation algorithm. SAS (version 9.2, SAS Institute Inc.) was used to calculate basic statistical values and to prepare datasets for NONMEM and for Phoenix WinNonlin.
RESULTS
PK Model AnalysisPlasma luseogliflozin concentrations of 31 patients with T2DM were individually analyzed. The geometric mean and coefficient of variation of PK parameters (oral clearance, volume of distribution of central compartment, volume of distribution of peripheral compartment, inter-compartmental clearance, absorption rate constant, and absorption lag time) were 2.78 L/h (14.9%), 21.1 L (25.7%), 18.9 L (35.1%), 3.69 L/h (75.4%), 20.3 1/h (49.2%), and 0.174 h (40.7%), respectively.
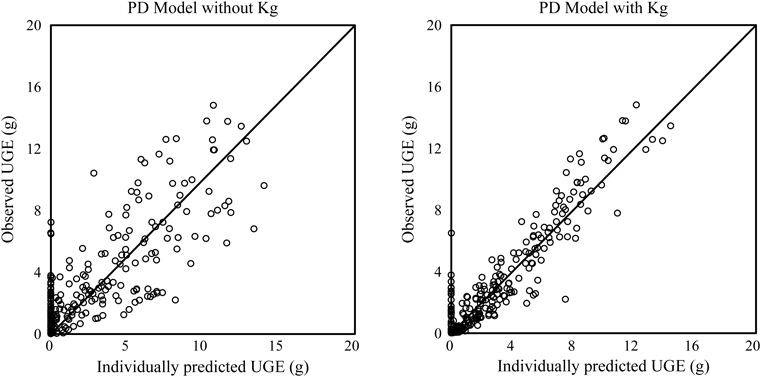
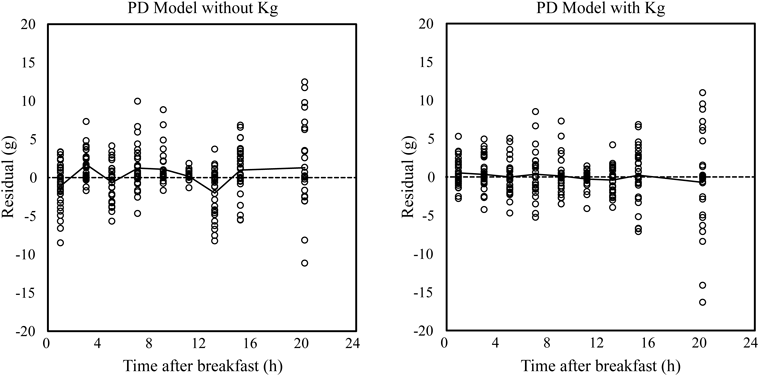
PK-PD Model AnalysisStep 1: Population Analysis of UGE at Day −1 Using PD Model and Estimation of Individual Vmax1 and Vmax2The population PD parameter was estimated by PD analyses of both models. NONMEM regressions were successfully converged in both models with Kg and without Kg. Population parameters are presented in Table 3. The OBJ of PD model with Kg decreased by 250.979 compared with the model without Kg and residual (intra-individual) error also decreased from 2.18 to 1.28. Scatter plots of observed UGE against individually predicted UGE in both models are shown in Fig. 3. Residual plots against time in both models are shown in Fig. 4. These plots indicated that introducing Kg to the PD model improved prediction accuracy and diminished the prediction bias by time interval. The mean Vmax1 was 30 g/d and ranged from 14 to 53 g/d. The mean Vmax2 was 376 g/d and ranged from 228 to 465 g/d. The mean contribution of Vmax1{Vmax1/(Vmax2+Vmax1)} was 7% and ranged from 3 to 11%. eGFR was significantly related with Vmax1 and Vmax2, p=0.047 and p<0.001, respectively (Fig. 5). However, eGFR was not covariate for Vmax1 and Vmax2 in the population analysis by NONMEM.
Table 3. Population Analysis of Pharmacodynamic Models
| PD model | Parameter estimate |
|---|
Vmax2
g/d | Vmax1
g/d | Kg
1/h | ωVmax2
— | ωVmax1
— | ωKg
— | Residual
g | OBJ |
|---|
| Model without Kg | 360 | 56.6 | — | 0.159 | 0.345 | — | 2.18 | 775.785 |
| Model with Kg | 374 | 31.9 | 1.19 | 0.171 | 0.863 | 0.133 | 1.28 | 524.806 |
PD, pharmacodynamic; Vmax1, transport capacity of SGLT1; Vmax2, transport capacity of SGLT2; Kg, rate constant for excretion lag time; ωVmax2, interindividual variability of Vmax2; ωVmax1, interindividual variability of Vmax1; ωKg, interindividual variability of Kg; OBJ, objective function of NONMEM; SGLT, sodium glucose co-transporter.
The population PK-PD parameters were estimated by PK-PD analyses of both models. NONMEM regressions were successfully converged for all analyses. PK-PD parameters and comparison with parameters in vitro are presented in Table 4. The population mean of Ki2 was estimated as 0.251 nM in model 1. On the other hand, the population means of Ki2 and Kon were estimated as 0.336 nM and 0.303 1/nM/h, respectively, in model 2. Koff and T1/2,off were calculated as 0.102 1/h and 6.81 h, respectively. The addition of Kon to model 2 reduced residual (intra-individual) error from 5.43 to 4.71 and improved the fit (⊿OBJ=−176.441). Scatter plots of observed UGE against individually predicted UGE in both models are shown in Fig. 6. Individual points in model 2 assembled to solid line compared with model 1. This indicated that model 2 improved prediction. Plots of observed UGE and individually predicted mean against time after administration are shown in Fig. 7. The time course of observed UGE was predicted dose-dependently, and luseogliflozin’s characteristic time course of UGE was also predicted.
Table 4. Population Analysis of PK-PD Models
| PK-PD Model | Parameter estimate |
|---|
Ki2
nM | Kon
1/nM/h | Koff
1/h | Kg
1/h | T1/2,off
h | ωKi2
— | ωKg
— | Residual
g | OBJ |
|---|
| Model 1 | 0.251 | — | — | 1.51 | — | 0.635 | — | 5.43 | 2961.685 |
| Model 2 | 0.336 | 0.303 | 0.102 | 2.20 | 6.81 | 0.527 | 0.0167 | 4.71 | 2785.244 |
| PK-PD Model | Parameter in vitro | Ratio in vivo/in vitro |
|---|
Ki2
nM | Kon
1/nM/h | Koff
1/h | Kg
1/h | T1/2,off
h | Ki2
— | Kon
— | Koff
— | T1/2,off
— |
|---|
| Model 1 | 1.10 | — | — | — | — | 0.23 | — | — | — |
| Model 2 | 0.084 | 0.11 | — | 7.0 | 0.31 | 3.6 | 0.94 | 1.0 |
PK-PD model, pharmacokinetic-pharmacodynamic model; Ki2, inhibition constant of luseogliflozin to SGLT2; Kon, inhibition on rate of luseogliflozin to SGLT2; Koff, inhibition off rate of leusogliflozin from SGLT2 and luseogliflozin complex; Kg, rate constant for excretion lag time; T1/2,off, half-time of Koff; ωKi2, interindividual variability of Ki2; ωKon, interindividual variability of Kon; OBJ, objective function of NONMEM; SGLT, sodium glucose co-transporter; Model 1, PK-PD model in which Kon and Koff are not considered for inhibition of SGLT2; Model 2, PK-PD model in which Kon and Koff are considered for inhibition of SGLT2; Parameter in vitro: ref 20.
Estimated population mean, inter-individual variability, and residual UGE barely fluctuated with varying Ki1 values (195, 1950, and 19500 nM, respectively), and with varying K1 values (0.3, 1, 3, and 10 1/(mg/mL)/h, respectively) in model 2. Accordingly, we concluded that model 2 was not sensitive for the values of Ki1 and K1 in those ranges, and that the Ki1 value of 1950 nM and the K1 value of 10 1/(mg/mL)/h used in the PK-PD model were reasonable for analysis.
The time course of the SGLT2 inhibition ratio for both PK-PD models is shown in Fig. 8. The time course of SGLT2 inhibition ratio in model 2 reflects the features of UGE.
PK-PD Model EvaluationA visual predictive check of UGE rates based on the PK-PD model (model 2) was performed. The time course of observed and predicted UGE rates for doses of 2.5 and 5 mg on day 7 is shown in Fig. 9. The 5, 50, and 95th percentiles of simulated UGE rates were reasonably comparable with the 50th percentiles and the 90% prediction intervals of observed UGE rates, and most of the observed UGE rates were within the 90% interval of the simulated UGE rates. The predicted UGE rates generally described the characteristic time course of the observed UGE rates.
DISCUSSION
The selected population PK-PD model 2 could describe the time course of the observed UGE after administration of luseogliflozin. We subsequently assessed the validity of the estimated value of the PD parameters and PK-PD parameter, Ki2, and considered the relevance of inhibition rate constants to sustained UGE.
Validity of Estimated PD Parameters of Vmax1, Vmax2, and KgThe mean (standard deviation (S.D.)) values of individually estimated Vmax1 and Vmax2 and contribution of Vmax1 were 30 (10) and 376 (52) g/d, and 7% (2%), respectively. Because these are the first estimated values of Vmax1 and Vmax2 in Japanese patients with T2DM, we compared the values with other reports. Lu et al. reported a Vmax1 of 86 g/d and Vmax2 of 475 g/d for patients with T2DM.18) The mean Vmax1 and Vmax2 in our study were less than those reported by Lu et al. The contribution of Vmax1 was also less than that reported by Lu et al. As SGLT1 was thought to be responsible for 10% of glucose reabsorption, the Vmax1 contribution of 7% was not an extremely low value.
The Vmax difference between these two reports might be attributable to not only race but also to eGFR values. Lu et al. reported eGFRs ranging from 109 to 127 mL/min for patients with T2DM. This was higher than for the Japanese patients in our study. Considering the relationship of Vmax1 and Vmax2 to eGFR, the Vmax2 value of 376 g/d was adjusted to 411–446 g/d and the Vmax1 value of 30 g/d was adjusted to 34–38 g/d. Though Vmax1 was still lower, the Vmax2 values of this report were then closer to the Vmax2 of Lu et al. The reason for the relationship between Vmax and eGFR was unclear. However, hyperglycemia augments the expression and activity of SGLT2 in the renal proximal tubules,1) and augmentation of eGFR is observed in patients with T2DM. A relationship between Vmax and eGFR is therefore possible. Accordingly, the Vmax values reported here are generally acceptable for Japanese patients with T2DM.
The rate constants for excretion lag time, Kg, were estimated to be 1.19 1/h without luseogliflozin administration and 2.20 1/h with luseogliflozin administration in model 2. These Kg values indicate the remaining glucose that is absent from SGLT reabsorption in the renal tubule takes a mean time of 0.84 or 0.45 h to appear in a urine sample. As the reversal of UGE in each meal interval against the AUC of plasma glucose was predicted by adopting Kg to the PD model without luseogliflozin administration and the PK-PD model with luseogliflozin administration (Figs. 4, 7), we considered that a lag time existed between the UGE and plasma glucose peaks. Since, to our knowledge, there were no reports about measurement of the flow rate of luminal fluid and time required for the fluid to pass beyond the proximal tubule in humans, we could not determine the physiological validity of the Kg value estimated from the PD and PK-PD models. We assumed that the lag time derives from the temporary retention of urine in the bladder. Urine remaining in the bladder is excreted in the next urine-collection interval, and the retention appears as lag time. As urine-collection intervals are two or eight hours, lag time of about one hour is possible.
The longer the lag time, the more UGE in the next urine-collection interval. The ratio of (UGE2–4 h)/(UGE0–2 h) in each meal was 0.9–1.8, on day 7, but it was 0.9–3.0 on day −1 and that on day-1 was larger than on day 7 (Table 2), which was thought to be why the lag time of excretion without the inhibitor was longer than with the inhibitor.
Validity of Estimated PK-PD Parameter of Ki2As the mean prediction curve described the time course of observed UGE in all doses (Fig. 7), the estimated value of Ki2 on model 2 corresponded to the dose-dependency of luseogliflozin. However, the Ki2 value estimated on model 2 was one-third of the value in vitro; thus, to confirm the validity of Ki2 in vivo, we tried to calculate the Ki2 value from the EC50 in a previous report.9) Sasaki et al. calculated that EC50, 254 ng·h/mL, by regression analysis of the AUC0–24h of plasma luseogliflozin concentration to the change in daily UGE from day −1. EC50 could be converted to the mean free fraction of luseogliflozin over 24 h, 0.974 nM. This value was assumed to be the IC50 of SGLT2, considering the low contribution of SGLT1. According to the relationship between inhibition constants (Ki) and IC50,31) IC50=Ki×(1+Glu/Km), Ki2 is calculated at 0.312 nM using the value of the IC50, mean plasma glucose level over 24 h, (188 mg/dL), and Km2. As the Ki2 value (0.312 nM), approximately calculated by the Emax model of daily UGE, is nearly the same as the Ki2 value estimated by the PK-PD model (0.336 nM), we assumed it to be valid for the in vivo value.
Consequently, we examined the reason for the in vivo value being about one-third of the in vitro value. The low estimate of Ki2 in vivo compared with in vitro can be explained by the increased luminal luseogliflozin concentration. If luseogliflozin was secreted into the proximal tubule, the luminal luseogliflozin concentration could be increased. But renal clearance of free luseogliflozin is about 50 mL/min, less than the eGFR, and luseogliflozin is reabsorbed from the tubule. The luminal fluid is known to be condensed by almost three-fold when it reaches the end of the proximal tubule. But it is not obvious that luminal fluid is condensed three-fold at the site of SGLT2 in segment 1. As explained above, the difference between the Ki2 values in vitro and in vivo was not explained by secretion of luseogliflozin to the tubule or condensation of luminal fluid. Thus, we think that the difference was derived from experimentally using hSGLT2 expression cells in vitro, which is not the same circumstance as in the actual proximal tubule.
Explanation of Sustained UGE over 24 h and Other Properties of UGE after Administration of LuseogliflozinThe dissociation half-time of luseogliflozin from SGLT2, calculated from the Koff estimate based on model 2 was 6.81 h, and the dissociation delay was proven in vivo as well as in vitro. In Fig. 7, the mean prediction curve was fitted to the observed time course of UGE and the sustained UGE after supper appeared in the prediction curve. Accordingly, the assumption that sustained UGE results from the delay of dissociation of luseogliflozin from SGLT2 was thought to be correct.
Next, we considered the effect of another inhibition rate constant, Kon. As shown in Fig. 8, at all doses of luseogliflozin, the SGLT2 inhibition ratio in model 2 increased gradually, compared with plasma luseogliflozin up to 4 h, then decreased by 24 h. Because the Tmax of plasma luseogliflozin concentration was 1 h or less, the SGLT2 inhibition ratio peak was delayed after the plasma luseogliflozin peak. We thought the peak of the SGLT2 inhibition ratio indicated that the association of luseogliflozin to SGLT2 was delayed. In fact, the time course of the SGLT2 inhibition ratio was composed of both the association delay of Kon and the dissociation delay of Koff. As shown in Table 5, sustained UGE after supper was accompanied by a UGE peak after lunch on day 7. The three time intervals in Fig. 8, 0–4, 4–8, and 12–16 h, represent each three-meal interval. The magnitude of the SGLT2 inhibition ratio of the three-meal interval in model 2 clearly illustrates the properties of UGE as described in Table 5. Temporary rises, which depend on low glucose levels, were observed at 4 and 12 h in the inhibition ratio of SGLT2 in model 1, but the inhibition ratio decreased more steadily and uniformly in this model. Because it is difficult for model 1 to describe the time course of UGE that conflicts with the concentration of the inhibitor, the good fit with model 2 was thought to derive from both inhibition rate constants in that model.
Table 5. UGE Rate and Partial
AUC of Plasma Glucose and Luseogliflozin on Day 7
| Variables | Time interval (after administration) | Unit | Dose |
|---|
| 0.5 mg | 1 mg | 2.5 mg | 5 mg |
|---|
| UGE rate | After breakfast (0–4 h) | (g/h) | 4.2 (1.4) | 5.1 (1.3) | 6.9 (2.3) | 6.5 (1.7) |
| After lunch (4–8 h) | (g/h) | 5.5 (1.9) | 5.5 (1.0) | 7.7 (2.1) | 6.9 (2.6) |
| After supper (12–16 h) | (g/h) | 4.2 (1.5) | 3.8 (0.9) | 6.4 (1.0) | 6.1 (1.4) |
| Partial AUC of plasma glucose | After breakfast (0–4 h) | (mg·h/dL) | 810 (156) | 780 (116) | 738 (102) | 708 (88) |
| After lunch (4–8 h) | (mg·h/dL) | 887 (209) | 787 (126) | 802 (127) | 710 (105) |
| After supper (12–16 h) | (mg·h/dL) | 924 (108) | 824 (125) | 828 (63) | 755 (137) |
| Partial AUC of luseogliflozin | After breakfast (0–4 h) | (ng·h/mL) | 58 (9) | 124 (21) | 289 (67) | 644 (83) |
| After lunch (4–8 h) | (ng·h/mL) | 39 (7) | 80 (12) | 200 (33) | 411 (82) |
| After supper (12–16 h) | (ng·h/mL) | 22 (5) | 46 (8) | 113 (22) | 230 (42) |
Values are mean (S.D.). AUC, area under the curve; UGE, urinary glucose excretion.
Based on these explanations, by adopting the inhibition rate constants to a competitive inhibition model, the PK-PD model could address the delay of association and dissociation of luseogliflozin, and could explain the delay of the UGE peak and the sustained UGE after administration of luseogliflozin. Moreover, since UGE was sustained up to 24 h, and consequently, lowering of plasma glucose was maintained after supper with once-daily dosage in the morning,9) it became clear that these results derived from the kinetic characteristics of lower Kon and Koff.