Abstract
Gastric motility disturbance is commonly found in long-standing hyperglycemia. Both delayed and rapid gastric emptying has been reported in diabetes. However, very few studies have followed the changes in gastric emptying during disease progression in diabetes because of technical limitations. 13C-Acetic acid breath test is a validated method which is non-invasive and can be used repeatedly or serially to evaluate gastric emptying changes in animal. We investigated the gastric emptying changes in different stages of diabetes using 13C-acetic acid breath test, as well as its related mechanisms involving interstitial cells of Cajal (ICCs), and stem cell factor (SCF) in streptozotocin-induced diabetic rats. The results showed that gastric emptying was accelerated at the early stage (12 weeks of diabetes) whereas intramuscular ICCs (ICC-IM) networks were not different from normal group. At long-term stage (28 weeks of diabetes), gastric emptying had returned to normal pattern with no delayed. ICC-IM networks were decreased in the diabetic group compared to 12th weeks, and were lower than in the normal group at the same time point. SCF levels were constantly high in the diabetic group than in the normal group. This result indicated that 13C-acetic acid breath test is useful to track the alteration in gastric emptying during disease progression. The change of gastric emptying was not found to be significantly associated with ICC-IM. Elevated SCF may help to preserve ICC-IM, especially in the early phase of diabetes.
Diabetes mellitus is a chronic disease with increasing prevalence worldwide.1) Persistent hyperglycemia causes major complications in many organs of the body, including the gastrointestinal (GI) tract. The most common GI disorder in diabetes is gastroparesis, which is defined as delayed gastric emptying in the absence of mechanical obstruction.2,3) Although delay in gastric emptying is well-recognized in a subset of diabetic patients, accelerated gastric emptying is increasingly reported in both type 1 and type 2 diabetic patients,4,5) as well as in diabetic animal models.6,7) Changes in gastric emptying rate, either faster or slower, can impair glycemic control, increase diabetic complications, and affect QOL in diabetic patients.3)
Gastric emptying is controlled by electrical signals (slow waves) that originate from interstitial cells of Cajal (ICCs) (or gut pacemaker cells) that are located in the muscular layers of the stomach.3) Two subtypes of ICCs have been identified in gastric tissue: 1) myenteric ICCs (ICC-MY), which lie between the circular and longitudinal muscles and transmit electrical current to adjacent smooth muscle cells via gap junctions; and, 2) intramuscular ICCs (ICC-IM), which are located in the circular and longitudinal muscle layers and play a major role in the neurotransmission process.8) The proliferation and survival of ICCs are influenced by the binding of stem cell factor (SCF), a peptide growth factor, to its c-Kit tyrosine kinase receptor and activates downstream signaling proteins.9) Several previous studies reported that delayed gastric emptying in diabetes is related to the depletion of ICCs.10–13) Mechanisms of reduction in ICCs in diabetes is related to deficiency of SCF, and the involvement of hyperglycemia-induced oxidative damage.10) However, the mechanisms leading to accelerated gastric emptying are not fully understood, because hyperglycemia normally slows the rate of gastric emptying.3)
Although either delayed or accelerated gastric emptying has been reported in type 1 and type 2 diabetes, but these results came from different studies. There are very few studies follow the changes of gastric emptying during the progression of diabetes in each individual due to technical limitations. Previously, the tests commonly used for measuring gastric emptying in rodents are non-survival methods that measure the remaining test substances in the stomach (gastric residual) at a fixed-time interval. Thus, the tracking of gastric emptying in the same animal by this method is not possible. Scintigraphy is a gold standard for measuring gastric emptying,14) but its use in some research center is limited due to the need of expensive equipment, as well as interpretation by specialists. Moreover, repetitive measurement could not be performed by this technique due to a significant radiation exposure.15) Recently, the accuracy and reliability of breath test with stable isotope for measuring gastric emptying have been recognized.16) 13C-Breath test is a non-invasive diagnostic method used to evaluate the rate of gastric emptying in clinical setting and research centers.17) Uchida et al. established a simple 13C-acetic acid breath test which is sensitive for measuring liquid gastric emptying, and can be repetitively used to follow the gastric emptying changes during disease time course.18) In this study, we applied this non-invasive 13C-acetic acid breath test to monitor the alteration of gastric emptying during disease progression in diabetes-induced rats. In addition, the changes of ICCs and SCF in different stages of diabetes were also investigated.
MATERIALS AND METHODS
This study was conducted at the Department of Physiology, Faculty of Medicine Siriraj Hospital, Mahidol University, Bangkok, Thailand during March 2015 to May 2016. The protocol for this study was approved by the Siriraj Institutional Review Board (SIRB), Faculty of Medicine Siriraj Hospital, Mahidol University.
AnimalsEight-week-old male Sprague Dawley rats (200–300 g) were purchased from the National Laboratory Animal Center, Mahidol University, Salaya Campus, Nakhon Pathom, Thailand. All rats were housed in controlled laboratory conditions (18–22°C, 12 h day/night cycle) with ad libitum access to rodent chow and water. The animal experimentation protocol was approved by the Institutional Animal Care and Use Committee, Faculty of Medicine Siriraj Hospital, Mahidol University (approval no. 011/2014) and all animal experiments complied with internationally mandated animal care and use guidelines for scientific study.
Induction of DiabetesAll rats were fasted overnight. In the morning, a single 60 mg/kg intraperitoneal injection of streptozotocin (STZ) (Sigma-Aldrich Corporation, St. Louis, MO, U.S.A.) freshly dissolved in 0.1 M sodium citrate buffer at pH 4.5 was administered to treatment group rats. Age-matched normal control rats were injected with an equal volume of sodium citrate buffer. Induction of diabetes was determined by fasting blood sugar (FBS) level using blood harvested from a tail vein and a glucose reagent kit (Roche Diagnostics, Basel, Switzerland). Rats with an FBS level higher than 200 mg/dL at 72 h after STZ injection were considered to be diabetic rats. FBS and body weight (BW) were recorded every 4 weeks. In this study, we defined the 12th week as early phase diabetes and 20th and 28th weeks to be long-term diabetes.
Experiment DesignRats were given one week to adjust and acclimate to their new environment. Then FBS and gastric emptying were evaluated and recorded as baseline. Rats were randomly divided into either the diabetic or the normal control group. Normal control group was given citrate buffer solution and diabetic group got STZ injection. Gastric emptying was again measured at 12, 20, and 28 weeks in both groups after induction of diabetes in diabetic group rats. At the end of week 12 and week 28, the rats were sacrificed using an excessive dosage of ketamine/xylasine anesthesia. Blood was immediately collected from the abdominal aorta and serum was separated. The stomach was then rapidly removed, opened along the greater curvature, and cleaned. Soon after, the stomach was divided into two pieces, with one piece being immediately submerged in liquid nitrogen and stored at −80°C for Western blot analysis and the other being immersed in 4% paraformaldehyde for immunofluorescence (Fig. 1).
Evaluation of Gastric EmptyingGastric emptying was measured by 13C-acetic acid breath test, as described by Uchida et al.,18) and validated by Matsumoto et al.19) Briefly, the breath test system is composed of desiccator (2000 mL) which was wide enough for the rat to move about freely and used as an animal chamber. The animal chamber was connected to pump (Baoding Shenchen Precision Pump Co., Ltd., Baoding city, China), and breath sample bag (Otsuka Pharmaceutical Co., Ltd., Tokyo, Japan) (Fig. 2). The night before the experiment, rats were refrained from food, but were given ad libitum access to water. On the day of the experiment, each rat was placed in a chamber and given 15 min to acclimate before food administration. Rats were then given 2 mL of Blendera enteral nutrition containing 16 mg/kg 13C-acetic acid (Cambridge Isotope Laboratories, Inc., Tewksbury, MA, U.S.A.). Exhaled breath air was collected at 5-min intervals until 30 min; at 15-min intervals for 60 min; and, at 120, 180, and 240 min after test meal administration.
Data Analysis13CO2 enrichment in breath samples was analyzed using IR isotope spectrometry (BreathTek UBiT-IR300 Infrared Spectrometry System; Otsuka Pharmaceutical Co., Ltd., Tokyo, Japan). The measured value was expressed as the change in 13CO2 (Δ13C, ‰) from the sample and standard 13CO2/12CO2 ratio. Mixed gas consisting of 5% 12CO2 and 95% O2 was used as a standard. Maximum concentration (Cmax; ‰), time taken to reach the maximum concentration (Tmax; min), and area under the curve (AUC240 min; ‰·min) were calculated using Δ13C values. In our study, Tmax of 13CO2 exhalation reflected gastric emptying rate, because it is a more reliable parameter than half-emptying times obtained by scintigraphy.16) Cmax and AUC240 min were the peak and amount, respectively, of 13CO2 extraction during 240 min, and reflect the absorption of labeled material.
Immunofluorescent Staining for c-KitGastric antral specimens were fixed with 4% paraformaldehyde in 0.1 M phosphate buffered saline (PBS, pH 7.4) at 4°C for 24 h. Tissues were washed 3×10 min with 0.1 M PBS (pH 7.4) and then incubated in 30% sucrose in PBS at 4°C overnight. The sucrose-protected tissues were embedded in Optimum Cutting Temperature (OCT) compound (Bio-Optica Milano SpA, Milan, Italy), cooled with dry ice, and cut into 5 µm sections with a cryostat (Thermo Fisher Scientific, Inc., Waltham, MA, U.S.A.). Specimens on nonadjacent sections were examined (each >60 µm apart).
Sections were rinsed with PBS and then blocked with 2% bovine serum albumin (BSA) +10% normal donkey serum in PBS containing 0.3% Triton X-100 (PBST) for 1 h at room temperature. Sections were then incubated with anti-c-Kit antibody (1 : 200; Santa Cruz Biotechnologies, Inc., Dallas, TX, U.S.A.) overnight at 4°C. After washing 3×5 min with PBST, tissues were incubated with Alexa Fluor 555 donkey anti-goat immunoglobulin G (IgG) (1 : 1000; Life Technologies Corporation, Carlsbad, CA, U.S.A.) for 1 h at room temperature in a humidified and dark environment, washed, and counterstained with 4′,6-diamidino-2-phenylinodole dilactate (DAPI dilactate, 1 : 1000; Life Technologies Corporation, Carlsbad, CA, U.S.A.) to label nuclei. Negative controls were created by omitting primary antibody. Immunostained muscular tissues were visualized under a fluorescent microscope (Carl Zeiss Microscopy GmbH, Oberkochen, Germany). The c-Kit-positive ICC networks in the intramuscular region (ICC-IM) were identified. To ensure unbiased, blinded quantification, three fields per slide from three nonadjacent slide sections of each rat were analyzed using ImageTool software (http://compdent.uthscsa.edu/dig/itdesc.html). The c-Kit-positive ICC-IM networks were expressed as a percentage of total stained area. Mast cells, identified by their round shape, absence of dendritic processes, and stronger staining, were excluded from the analysis.
Image Analysis by ImageTool SoftwareImageTool software (http://compdent.uthscsa.edu/dig/itdesc.html) was used to measure intensity values of selected images. The field in each slide was outlined using a drawing tool component of the software (450×350 µm, 0.16 mm2). Measurement values included mean intensity, standard deviation of intensity, integrated intensity (sum of all pixels in the region), maximum and minimum gray scale levels, and threshold area (expressed as a percentage of total stained area).
Western Blot Analysis of SCFFrozen samples of gastric antrum (50 mg) were homogenized in ice-cold radioimmunoprecipitation assay (RIPA) buffer (Pierce Biotechnology, Inc., Rockford, IL, U.S.A.) containing protease inhibitor cocktail (Thermo Fisher Scientific, Inc.), incubated on ice for 45 min, centrifuged at 12000×g for 5 min at 4°C, and supernatants were used as total proteins. The total protein concentration was measured by microBCA™ Protein Assay Kit (Thermo Fisher Scientific, Inc.). Equal amounts of protein were subjected to electrophoretic separation by sodium dodecyl sulfate-polyacrylamide gel electrophoresis (SDS-PAGE) in 12% polyacrylamide gels. Proteins were transferred onto polyvinylidene difluoride (PVDF) membrane. Nonspecific binding protein was blocked by 5% BSA in Tris-buffered saline 0.1% Tween 20 (Sigma-Aldrich Corporation, St. Louis, MO, U.S.A.) for 60 min at room temperature, and then immunoblotted with mouse monoclonal antibody for SCF (1 : 500; Santa Cruz Biotechnology, Inc.) at 4°C overnight. After washing three times with TBST, blots were incubated with horseradish peroxidase (HRP)-conjugated secondary antibody (1 : 3000; Santa Cruz Biotechnology, Inc.) for 1 h at room temperature. Immunoreactive bands were detected by enhanced chemiluminescence using ElectroChemiLuminescence (ECL) immunoassay (Thermo Fisher Scientific, Inc.). Levels of measured protein were normalized to the level of glyceraldehyde 3-phosphate dehydrogenase (GAPDH) gene (1 : 3000; Cell Signaling Technology, Inc., Danvers, MA, U.S.A.). Band quantification was performed using ImageJ software (https://imagej.nih.gov/ij/download.html).
Statistical AnalysisAll data are presented as mean±standard error of the mean (S.E.M.). Comparisons of gastric emptying, FBS, and BW within group and between groups at each time point were analyzed using repeated-measures ANOVA with Bonferroni adjustment. Difference in SCF expression between groups was analyzed by unpaired t-test. p-values less than 0.05 were considered to be statistically significant. All statistical analysis was performed using SPSS Statistics version 19.0 (SPSS, Inc., Chicago, IL, U.S.A.).
RESULTS
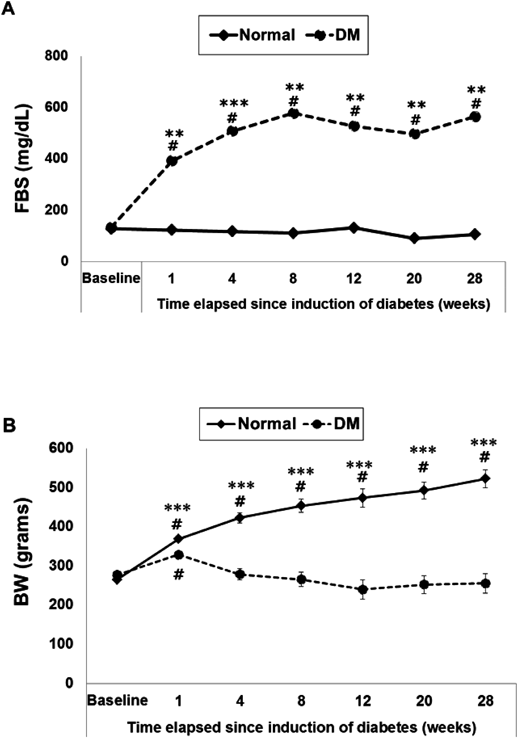
Fasting Blood Sugar (FBS, mg/dL) and Body Weight (BW, g)There was no difference in mean±S.E.M. baseline FBS between groups (127.80±2.52 vs. 133.60±4.60 for normal and diabetic rats, respectively). At 1 week after induction of diabetes, FBS in untreated diabetic group was significantly higher than in normal control group, and it stayed markedly higher than their normal control group counterparts throughout the 28 weeks of the study (p<0.01; Fig. 3A). Mean±S.E.M. baseline BW was similar between groups (265±4.54 vs. 277.14±4.85 for normal and diabetic rats, respectively). At 1 week after induction of diabetes, the BW of diabetic group was decreased and remained low all the way through the 28 weeks of diabetes; whereas, the BW of normal control group continuously increased and was significantly higher than the BW of diabetic group at each time point (p<0.001; Fig. 3B).
Gastric Emptying RateGastric emptying was determined by 13C-acetic acid breath test. Δ13C values at different time point is shown in Fig. 4, and the Δ13C values at different time point between groups are shown in Fig. 5. Tmax, Cmax, and AUC240 min are presented in Table 1. Baseline Tmax, Cmax, and AUC240 min were not different between groups (Fig. 5A, Table 1). However, after 12 weeks of diabetes, gastric emptying in the diabetic group was accelerated (Figs. 4A and 5B, Table 1), and Tmax was significantly decreased from baseline and lower than in normal control group (p<0.05; Table 1). Gastric emptying at 20th week was accelerated (Figs. 4A and 5C, Table 1), and Tmax was increased from 12th week, but still lower than baseline (Table 1) (p>0.05). At 28th week, the gastric emptying pattern in the diabetic group returned to baseline (Figs. 4A and 5D, Table 1), and Tmax was not statistically significantly different from either baseline or normal control group (Table 1). Cmax and AUC240 min at 12th and 20th weeks were not different between groups; however; at 28th week, Cmax and AUC240 min of diabetic group were slightly decreased when compared with normal control group (Table 1). In normal control group, gastric emptying (Tmax) at different time point did not showed statistical significantly difference (Fig. 4B).
Table 1. Parameters Assessing Gastric Emptying Rate
| Group | Time (weeks) | Tmax (min) | Cmax (‰) | AUC240 min (‰·min) |
|---|
| Normal | Baseline | 40.00±5.00 | 139.99±14.53 | 7829.08±976.65 |
| 12 | 36.67±3.30 | 231.83±25.05 | 12343.25±1382.54 |
| 20 | 36.67±3.63 | 242.23±22.94 | 13678.79±1134.91 |
| 28 | 28.33±2.77 | 265.46±11.31# | 15385.79±835.25# |
| DM | Baseline | 45.00±4.63 | 167.07±14.53 | 10187.21±906.98 |
| 12 | 23.57±3.06#,* | 218.63±25.05 | 10007.50±1279.98 |
| 20 | 28.57±3.36 | 207.47±22.94 | 10584.00±1050.72 |
| 28 | 35.71±2.56 | 183.67±11.31* | 9913.46±773.29* |
Tmax represents gastric emptying rate, and Cmax and AUC represent absorptive capacity in each group (n=7–8). Data are expressed as mean±S.E.M. #p<0.05 compared with baseline; *p<0.05 compared with normal controls at the same time point. Abbreviations: Tmax, time to reach maximal concentration of 13CO2 in expired air; Cmax, maximal concentration of 13CO2 in expired air; AUC, area under the curve.
The c-Kit positive ICCs and mast cells in the intramuscular region can be characterized by their morphology and distribution. Mast cells are identified by their small cell size, round shape, and absence of dendritic cell processes (yellow arrowhead in Figs. 6A and B). c-Kit positive ICC-IM are found scattered in the muscle layers (especially in the circular muscle layer), and oriented parallel to the long axis of smooth muscle cells (white arrow in Figs. 6A and B). c-Kit positive ICC-IM cells showed a spindle shape with branching processes running out of the cell body (Fig. 6B), whereas c-Kit-positive ICC-MY network was patchy and not well-defined.20) As a result, ICC-MY was excluded from evaluation (Fig. 6A).
Alteration of ICC-IM Networks in Diabetic ConditionAt 12th week after induction of diabetes, c-Kit-positive ICC-IM network areas were slightly higher or more crowded in diabetic rats than in normal control rats (3.68±0.23 vs. 3.48±0.21%, respectively; p>0.05) (Figs. 7A: a, B). However, ICC-IM network areas at 28th week after diabetes were significantly lower in diabetic rats than in normal control rats at the same time point (2.82±0.18 vs. 2.17±0.16; p<0.01) (Figs. 7A: d, B). Furthermore, ICC-IM network areas at 28th week after diabetes were markedly decreased, as compared with the value at 12th week (3.68±0.23 vs. 2.17±0.16%; p<0.001) (Figs. 7A: d, B). Surprisingly, ICC-IM network areas in specimens from normal control rats at 28th week also showed a significant decrease, as compared with the value in the same rats at 12th week (3.48±0.21 vs. 2.82±0.18%; p<0.05) (Figs. 7A: c, B).
SCF Protein ExpressionSCF, a c-Kit receptor ligand, was evaluated by Western blot analysis in gastric tissue of rats at 12th and 28th weeks after induction of diabetes. SCF was significantly more highly expressed in diabetic rats at both 12th and 28th weeks, as compared to normal control rats at the same time points (1.37±0.13 vs. 0.70±0.12, p<0.01 for week 12; and, 1.49±0.27 vs. 0.68±0.08, p<0.05 for week 28) (Fig. 8).
DISCUSSION
Gastric motility alterations have been reported in both diabetes type 1 and type 2. Although delayed gastric emptying is more common in diabetic gastroparesis,2,3) accelerated gastric emptying is also found in diabetic patients and diabetic animal models.4,5) Very few studies have examined changes in gastric emptying and the related mechanisms during disease progression in diabetes. In the present study, 13C-acetic acid breath test was used to monitor liquid gastric emptying in STZ-induced diabetic rats, due largely to the fact that this method is non-invasive and repetitive measurement can be performed.16) Using this method, we demonstrated that gastric emptying (Tmax) was accelerated at 12th week after induction of diabetes and then returned to normal pattern at 28th week. We also confirmed changes in gastric emptying using a conservative method with phenol red as a marker and we obtained the same results (data not shown). Absorptive capacity (Cmax, AUC240 min) did not show a significant difference between diabetic and age-matched normal control rats, except at 28th week when absorptive capacity in normal rats was shown to increase. Marked increases in body weight at 28th week in normal rats may be a contributing factor to increases in absorptive capacity.
The time course of accelerated gastric emptying in this study was consistent with results from previous studies in animal models with type 1 and type 2 diabetes that used dynamic methods to measure gastric emptying, and also in studies of human patients with diabetes.6,7,21–23) Delayed gastric emptying in STZ-diabetic rats has been reported in other studies10,24); however, those studies used different measurement methods. This study was the first to follow changes in gastric emptying in STZ-induced diabetic rats for 28 weeks. We found that gastric emptying was accelerated at 12th week and then returned to normal/baseline at 28th week. A similar pattern of gastric emptying was found previously in non-obese diabetic (NOD) mice, in which gastric emptying was accelerated during weeks 1–2 after induction of diabetes and then returned to normal by weeks 3–5 with no delay in gastric emptying.6) From another study, delayed gastric emptying in NOD mice was reported after more than 1.5 months of diabetes development.25) In the present study, rats were not followed longer than 28 weeks due to the high-risk health status of untreated diabetic rats. Delayed gastric emptying could possibly develop later in the diabetic course, but was not found in this 28-week study. However, the return to normal gastric emptying pattern at 28th week may reflect a trend towards delayed gastric emptying.
The mechanisms of accelerated gastric emptying in diabetes are not fully understood. The alteration in the regulation of gastric emptying, mainly regarding hormonal changes, during hyperglycemia has been established.26) Rapid gastric emptying in diabetes might be due to the lack of amylin, a pancreatic β-cell peptide co-secreted with insulin, which plays a role in inhibiting gastric emptying.23) Subcutaneous injection of amylin could reverse accelerated gastric emptying in diabetic biobreeding (BB) rats.23) Similarly, Worle et al. showed that gastric emptying was accelerated in type 1 diabetic patients and treatment with pramlintide (an islet amyloid polypeptide analog) slowed gastric emptying and markedly reduced postprandial hyperglycemia in these patients.27) In addition to amylin, ghrelin has been proposed as a possible cause of rapid gastric emptying. Gastric emptying in STZ-induced diabetic rats was accelerated with ghrelin levels remaining high (at fasting levels) even after feeding, and treatment with anti-ghrelin antibody stopped accelerated gastric emptying in these STZ rats.28)
In this study, we evaluated the alterations of ICCs using c-Kit antibody to ICC-IM, and also determined the changes of SCF in gastric muscular tissue, concomitant with time course of gastric emptying measurement. The results showed that in the early phase (12th week) of diabetes, while the gastric emptying was accelerated, ICC-IM was not different from age-matched normal control rats whereas the SCF levels were increased. Later, at 28th week after induction of diabetes, though a markedly decreased in ICC-IM in diabetic rats was observed, no delay in gastric emptying was shown. Our finding indicated that the changes of gastric emptying during diabetes progression were not correlated with the alteration of ICC-IM. Thus gastric emptying rate in diabetes may not depend only partly on ICCs, but the other factors such as hormonal changes like amylin or ghrelin, autonomic and enteric neurons may involve. Choi et al. hypothesized that a slight depletion in neuronal nitric oxide synthase (nNOS) (an inhibitory neuron) levels during early diabetes might lead to a relative increase in excitatory input because of a reduction in inhibition of intrinsic excitatory pathways.6) Moreover, Belai et al. reported that the intensity of substance P-immunoreactive nerve (an excitatory nerve) was increased in STZ-induced diabetic rat vessel.29) This imbalance of excitatory and inhibitory input might be caused an initial increase in gastric emptying in diabetic rats which required further study. In our study, the intensity of c-Kit-positive ICC-IM at early phase (12th week) of diabetes was not different from normal control rats while SCF expression was increased. This result indicated that ICC-IM survival may result from the elevation of SCF levels which have been reported an increased in inflammatory condition.30)
However, in long-term diabetes, ICC-IM was markedly reduced compared to early phase of diabetes though SCF levels remained high. Reduction of ICCs in long-standing hyperglycemia has been established.10,12,24,25) This alteration might be due to a lack of insulin and insulin-like growth factor I (IGF-I). In ICC primary cell culture, supplementation of hyperglycemic media with insulin and IGF-I can prevent the loss of ICCs and maintain their function for at least 12 weeks (86 d).31) Moreover, reactive oxygen species (ROS) overproduction during diabetes is very harmful to ICCs and caused the reduction of ICCs.10,32) Interestingly, Choi et al. reported that nitric oxide (NO) produced from nitrergic nerves is necessary for complete development of ICCs. The number of ICCs in primary culture were increased during incubation with NO donor (S-nitroso-N-acetylpenicillamine) and decreased after incubation with nNOS inhibitor (NG-nitro-L-arginine). Moreover, the volume of c-Kit-positive ICC networks in myenteric region from nNOS−/− mice were also reduced compared with control mice.33) In NOD mice and STZ-induced diabetic mice, gastric emptying rate was delayed due to the depletion of pyloric nNOS protein and mRNA. Treatment with insulin can be improved blood glucose concentrations, restored nNOS expression and pyloric function to normal levels, and reversed delayed gastric emptying.34) Furthermore, in STZ-induced diabetic rats with myosin light chain kinase (MLCK) deficiency, had delayed gastric emptying rate. Insulin treatment significantly improved gastric emptying by restoring MLCK levels.35)
In addition, we also found that ICC-IM in aging normal control rats were significantly reduced at 28th week compared to 12th week. The age-related ICC loss presented in this study is consistent with a recent study in aging humans that showed a marked loss of ICCs in normal human stomach and colon with age.20) The underlying mechanism for the loss of ICCs with age is not known, and the proliferation, self-renewal, and differentiation of ICCs may decline with age.20,36)
In conclusion, 13C-acetic acid breath test is effective to monitor the alteration of gastric emptying during the progression of diabetes. We found acceleration in gastric emptying in the early phase of diabetes with no change in ICC-IM networks, but with increased SCF expression. Later–at 28 weeks of diabetes, gastric emptying returned to normal non-accelerated emptying; however, ICC-IM networks were markedly decreased even though SCF expression was still high. We hypothesize that SCF may help to preserve ICCs and maintain neurotransmission function, with the possible cause of gastric emptying alteration in early phase being some type of hormonal and neuronal changes. Both of these proposed mechanisms require further study. With progressive damage to ICC networks and neuronal structure, delayed gastric emptying may be detected later in the course of diabetes. Additional studies are needed to identify both the mechanism of altered gastric emptying and an intervention to preserve ICCs and other structures before deterioration occurs. This may help us identify a novel prophylaxis treatment to ameliorate gastric motility disorders in diabetic patients.
Acknowledgments
This work was supported by Siriraj Research Development Fund (number R015733010), Faculty of Medicine Siriraj Hospital, Mahidol University. The authors gratefully acknowledge Associate Professor Supatra Lohsiriwat, for her excellent instruction and her invaluable contributions to this study. We appreciate the technical assistance by Mrs. Namoiy Semprasert (Endocrinology unit, Department of Physiology, Faculty of Medicine Siriraj Hospital, Mahidol University).
Conflict of Interest
The authors declare no conflict of interest.
REFERENCES
- 1) Wild S, Roglic G, Green A, Sicree R, King H. Global prevalence of diabetes: estimates for the year 2000 and projections for 2030. Diabetes Care, 27, 1047–1053 (2004).
- 2) Feldman M, Schiller LR. Disorders of gastrointestinal motility associated with diabetes mellitus. Ann. Intern. Med., 98, 378–384 (1983).
- 3) Ma J, Rayner CK, Jones KL, Horowitz M. Diabetic gastroparesis: diagnosis and management. Drugs, 69, 971–986 (2009).
- 4) Nowak TV, Johnson CP, Kalbfleisch JH, Roza AM, Wood CM, Weisbruch JP, Soergel KH. Highly variable gastric emptying in patients with insulin dependent diabetes mellitus. Gut, 37, 23–29 (1995).
- 5) Keshavarzian A, Iber FL, Vaeth J. Gastric emptying in patients with insulin-requiring diabetes mellitus. Am. J. Gastroenterol., 82, 29–35 (1987).
- 6) Choi KM, Zhu J, Stoltz GJ, Vernino S, Camilleri M, Szurszewski JH, Gibbons SJ, Farrugia G. Determination of gastric emptying in nonobese diabetic mice. Am. J. Physiol. Gastrointest. Liver Physiol., 293, G1039–G1045 (2007).
- 7) Green GM, Guan D, Schwartz JG, Phillips WT. Accelerated gastric emptying of glucose in Zucker type 2 diabetic rats: role in postprandial hyperglycaemia. Diabetologia, 40, 136–142 (1997).
- 8) Suzuki S, Suzuki H, Horiguchi K, Tsugawa H, Matsuzaki J, Takagi T, Shimojima N, Hibi T. Delayed gastric emptying and disruption of the interstitial cells of Cajal network after gastric ischaemia and reperfusion. Neurogastroenterol. Motil., 22, 585–593, e126 (2010).
- 9) Lennartsson J, Ronnstrand L. Stem cell factor receptor/c-Kit: from basic science to clinical implications. Physiol. Rev., 92, 1619–1649 (2012).
- 10) Jin QH, Shen HX, Wang H, Shou QY, Liu Q. Curcumin improves expression of SCF/c-kit through attenuating oxidative stress and NF-kappaB activation in gastric tissues of diabetic gastroparesis rats. Diabetol. Metab. Syndr., 5, 12 (2013).
- 11) Wang XY, Huizinga JD, Diamond J, Liu LW. Loss of intramuscular and submuscular interstitial cells of Cajal and associated enteric nerves is related to decreased gastric emptying in streptozotocin-induced diabetes. Neurogastroenterol. Motil., 21, 1095–e92 (2009).
- 12) He CL, Soffer EE, Ferris CD, Walsh RM, Szurszewski JH, Farrugia G. Loss of interstitial cells of Cajal and inhibitory innervation in insulin-dependent diabetes. Gastroenterology, 121, 427–434 (2001).
- 13) Forster J, Damjanov I, Lin Z, Sarosiek I, Wetzel P, McCallum RW. Absence of the interstitial cells of Cajal in patients with gastroparesis and correlation with clinical findings. J. Gastrointest. Surg., 9, 102–108 (2005).
- 14) Griffith GH, Owen GM, Kirkman S, Shields R. Measurement of rate of gastric emptying using chromium-51. Lancet, 287, 1244–1245 (1966).
- 15) Schmidt PT, Abrahamsson H, Dolk A, Hausken T, Karling P, Lindberg G, Nyhlin H, Ohlsson B, Simren M, Sjolund K, Stotzer PO, Tornblom H. Methods to assess gastric motility and sensation. Scand. J. Gastroenterol., 43, 1285–1295 (2008).
- 16) Braden B, Adams S, Duan LP, Orth KH, Mual FD, Lembke B, Hör G. WF C. The 13C-acetate breath test accurately reflects gastric emptying of liquids in both liquid and semisolid test meals. Gastroenterology, 108, 1048–1055 (1995).
- 17) Braden B. Methods and functions: Breath tests. Best Pract. Res. Clin. Gastroenterol., 23, 337–352 (2009).
- 18) Uchida M, Endo N, Shimizu K. Simple and noninvasive breath test using 13C-acetic acid to evaluate gastric emptying in conscious rats and its validation by metoclopramide. J. Pharmacol. Sci., 98, 388–395 (2005).
- 19) Matsumoto K, Kimura H, Tashima K, Uchida M, Horie S. Validation of 13C-acetic acid breath test by measuring effects of loperamide, morphine, mosapride, and itopride on gastric emptying in mice. Biol. Pharm. Bull., 31, 1917–1922 (2008).
- 20) Gomez-Pinilla PJ, Gibbons SJ, Sarr MG, Kendrick ML, Shen KR, Cima RR, Dozois EJ, Larson DW, Ordog T, Pozo MJ, Farrugia G. Changes in interstitial cells of cajal with age in the human stomach and colon. Neurogastroenterol. Motil., 23, 36–44 (2011).
- 21) Nowal TV, Roza AM, Weisbruch JP, Brosnan MR. Accelerated gastric emptying in diabetic rodents: effect of insulin treatment and pancreas transplantation. J. Lab. Clin. Med., 123, 110–116 (1994).
- 22) Bertin E, Schneider N, Abdelli N, Wampach H, Cadiot G, Loboguerrero A, Leutenegger M, Liehn JC, Thiefin G. Gastric emptying is accelerated in obese type 2 diabetic patients without autonomic neuropathy. Diabetes Metab (Paris) , 27, 357–364 (2001).
- 23) Young AA, Gedulin B, Vine W, Percy A, Rink TJ. Gastric emptying is accelerated in diabetic BB rats and is slowed by subcutaneous injections of amylin. Diabetologia, 38, 642–648 (1995).
- 24) Chen Y, Xu JJ, Liu S, Hou XH. Electroacupuncture at ST36 ameliorates gastric emptying and rescues networks of interstitial cells of Cajal in the stomach of diabetic rats. PLOS ONE, 8, e83904 (2013).
- 25) Ordög T, Takayama I, Cheung WK, Ward SM, Sanders KM. Remodeling of networks of interstitial cells of Cajal in a murine model of diabetic gastroparesis. Diabetes, 49, 1731–1739 (2000).
- 26) Vinik A, Nakave A, Chuecos MS. A break in the brake mechanism in diabetes-A cause of postprandial hyperglycemia. Diabetes Care, 31, 2410–2413 (2008).
- 27) Woerle HJ, Albrecht M, Linke R, Zschau S, Neumann C, Nicolaus M, Gerich JE, Goke B, Schirra J. Impaired hyperglycemia-induced delay in gastric emptying in patients with type 1 diabetes deficient for islet amyloid polypeptide. Diabetes Care, 31, 2325–2331 (2008).
- 28) Ariga H, Imai K, Chen C, Mantyh C, Pappas TN, Takahashi T. Does ghrelin explain accelerated gastric emptying in the early stages of diabetes mellitus? Am. J. Physiol. Regul. Integr. Comp. Physiol., 294, R1807–R1812 (2008).
- 29) Belai A, Milner P, Aberdeen J, Burnstock G. Selective damage to sensorimotor perivascular nerves in the mesenteric vessels of diabetic rats. Diabetes, 45, 139–143 (1996).
- 30) Da Silva CA, Frossard N. Regulation of stem cell factor expression in inflammation and asthma. Mem. Inst. Oswaldo Cruz, 100 (Suppl. 1), 145–151 (2005).
- 31) Horváth VJ, Vittal H, Ordog T. Reduced insulin and IGF-I signaling, not hyperglycemia, underlies the diabetes-associated depletion of interstitial cells of Cajal in the murine stomach. Diabetes, 54, 1528–1533 (2005).
- 32) Kashyap P, Farrugia G. Oxidative stress: key player in gastrointestinal complications of diabetes. Neurogastroenterol. Motil., 23, 111–114 (2011).
- 33) Choi KM, Gibbons SJ, Roeder JL, Lurken MS, Zhu J, Wouters MM, Miller SM, Szurszewski JH, Farrugia G. Regulation of interstitial cells of Cajal in the mouse gastric body by neuronal nitric oxide. Neurogastroenterol. Motil., 19, 585–595 (2007).
- 34) Watkins CC, Sawa A, Jaffrey S, Blackshaw S, Barrow RK, Snyder SH, Ferris CD. Insulin restores neuronal nitric oxide synthase expression and function that is lost in diabetic gastropathy. J. Clin. Invest., 106, 373–384 (2000).
- 35) Hu W, Feng P. Myosin light chain kinase is involved in the mechanism of gastrointestinal dysfunction in diabetic rats. Dig. Dis. Sci., 57, 1197–1202 (2012).
- 36) Lorincz ARD, Redelman D, Horváth VJ, Bardsley MR, Chen H, Ördög T. Progenitors of interstitial cells of Cajal in the postnatal murine stomach. Gastroenterology, 134, 1083–1093 (2008).