Abstract
We explored the effects of chondroitin sulfate on knee osteoarthritis in a one-year, randomized, double-blind, dose-comparison study. Patients with painful, Kellgren–Lawrence grade 2–3, osteoarthritis of the knee were treated with oral chondroitin sulfate at a dose of either 260 mg/d (low-dose group, control group) or 1560 mg/d (high-dose group). Symptoms were evaluated by the Lequesne’s index and visual analog scale for pain. We made subgroup analyses according to background symptom severity (Lequesne’s index ≥8 or <8) in 73 patients. Serum level of cartilage oligomeric matrix protein and hyaluronic acid were also determined. In the subgroup with severe symptoms (Lequesne’s index ≥8), the chondroitin sulfate dose of 1560 mg/d improved pain faster after 6 and 9 months’ therapy. However, no dose-related effects were found on cartilage oligomeric matrix protein or hyaluronic acid levels. Chondroitin sulfate also had good tolerability. We conclude that chondroitin sulfate is useful for pain control in knee osteoarthritis.
Osteoarthritis (OA) is the most common form of arthritis and is a major cause of morbidity, activity limitation, physical disability, excess health care utilization, and reduced health-related QOL, especially in people aged 65 years and older.1,2) OA is characterized by progressive structural and metabolic changes in joint tissue, mainly comprising cartilage degradation, subchondral bone sclerosis, and synovial membrane inflammation. The management of OA requires a combination of pharmacological and non-pharmacological treatments designed to relieve pain and maintain joint mobility in daily life over the long term.3) Therefore, many attempts have been made to find treatments that can not only offer pain relief but also alter the course of the disease with the lowest risk of adverse effects. Only a few medications have been recognized by clinical trials as potentially influencing the course of OA beneficially. These include chondroitin sulfate (CS),4–7) glucosamine,8–10) diacerein,11) doxycycline (an antibiotic belonging to the tetracycline family),12) cyclooxygenase/5-lipoxygenase inhibitors,13) and intra-articular injections of hyaluronic acid (HA). These approaches, however, have frequently produced insufficient benefit and excess risk of adverse effects.14–16) CS is perhaps exceptional in this regard because its relative safety is established by over 50 years of medicinal use.
CS is a glycosaminoglycan and a major component of the extracellular matrix (ECM) of many connective tissues, including cartilage, bone, skin, and ligaments/tendons. In joint tissues affected by OA, CS has been shown to modify the chondrocyte death process17,18) and promote subchondral bone homeostasis,19) partly by reducing some proinflammatory and catabolic factors, such as nuclear-factor κB, and increasing anabolic factors.20–22) The study by Morreale et al. shows that oral CS needs to be administered for longer than diclofenac to produce a substantial reduction in the pain of knee OA, but that the effects of CS persist beyond treatment.23) Given that repeated treatment is needed for benefits to appear with oral CS therapy in OA, it is considered a slow-acting drug.24)
Meta-analyses of randomized placebo-controlled trials have demonstrated the efficacy of CS in relieving joint pain in knee OA.25–27) Furthermore, the clinical efficacy of CS has been shown in improving OA joint function and in reducing cartilage destruction.4–7,28–30) Singh et al. recently conducted a review of randomized trials of OA interventions in the Cochrane Database of Systemic Reviews and concluded that CS may improve pain, that it probably improves QOL, and that it probably slows down narrowing of the joint space in patients with knee OA.31) However, there have also been reports showing no effects of CS on pain or cartilage structure.6,32,33) It is possible that differences in disease severity among patients caused the discrepancy in the effect of CS on OA symptoms among studies. The large-scale study by Clegg et al.34) showed that the combination of CS and glucosamine was not effective on pain for all patients (mild-to-severe pain) when using the Western Ontario and McMaster Universities Osteoarthritis Index (WOMAC), but in post-hoc subgroup analyses showed that it was effective for patients with moderate-to-severe pain according to the WOMAC score.
The doses of orally administered CS, as a sodium salt, were equal to or more than 800 mg/d in all these clinical investigations of OA. In Japan, sodium CS has been used as to treat pain associated with arthritis, neuralgia, impaired healing, and vague symptoms such as fatigue and physical weariness.35) The dose range for these indications is from 900 to 3600 mg/d for single-ingredient tablets. In addition, sodium CS doses of 180–900 mg/d have been used for pain in combination preparations containing vitamin B1 or medicinal herb extracts. Given the slow-acting nature of CS, long-term treatment at a low-dose can be effective. However, the optimal dose of CS has not been thoroughly investigated.
The aim of the present study was to investigate the possible differences in efficacy between two doses of CS in Japanese patients with radiographically confirmed knee OA that is symptomatic. Therefore, in this one-year, randomized, double-blind study, we compared the effects of sodium CS at a standard dose used in combination preparations (260 mg/d), which is below the reported effective dose of 800 mg/d and is near the reported no effective dose of 200 mg/d in 90 d,36) with a standard dose used in single-ingredient preparations (1560 mg/d). Symptoms were evaluated using Lequesne’s index (LI)37) and a visual analog scale (VAS) for pain.38) In addition, because initial symptom severity can affect the efficacy of CS, we did post-hoc subgroup analyses by dividing patients into mild and severe symptom groups based on the LI score at baseline.
Biomarkers serve as surrogate endpoints in clinical trials of OA by providing useful diagnostic information about cartilage degradation, reflecting disease-relevant biological activity, and predicting disease progression. Cartilage oligomeric matrix protein (COMP) is a well-established biomarker for OA, with its serum level reportedly increasing as the disease progresses,39) whereas HA synthesis has been shown to be greater in inflamed synovium, resulting in an increase in the serum level of HA.40,41) Therefore, we evaluated serum levels of COMP and HA before and after CS therapy.
MATERIALS AND METHODS
Study DesignA randomized, double-blind, dose-comparison study was designed to investigate the efficacy and safety of CS (sodium chondroitin sulfate supplied from Zeria Pharmaceutical Co., Tokyo, Japan) in patients with symptomatic knee OA. The study was carried out in five medical centers in Aichi prefecture, Japan, and the protocol was approved by the institutional ethics committee of each organization. We conducted the study in accordance with the principles of the amended Declaration of Helsinki and obtained written informed consent from all participants before enrollment. The study consisted of a one-year intervention period preceded by a run-in period of approximately 4 weeks. Patients underwent full clinical and laboratory examinations at baseline, which included taking blood samples for general laboratory examination and measurement of baseline serum COMP and HA levels.
PatientsParticipants were included, regardless of gender, if they were at least 20 years old and had clinical and radiographic evidence of knee OA. They were recruited from among patients who visited Fujita Health University Hospital and cooperating hospitals in Japan. Other inclusion criteria were as follows: radiological severity of grade 2–3 on the Kellgren–Lawrence (KL) scale42) in affected knee joints, and a pain score of 30 or more on the VAS during the prior 24 h. Patients with bilateral knee OA were asked to specify the most affected knee at baseline, and this knee was evaluated throughout the study period. Rescue medications, including non-steroidal anti-inflammatory drugs (NSAIDs) and temporary HA injections, were permitted to relieve severe joint pain.
The exclusion criteria were as follows: expected to be unable to take the medicine for 12 consecutive months; use of other medicine or health foods containing CS within the 2 weeks before the intervention; CS allergy or a history of CS allergy; knee bone fracture or radiographic evidence of severe OA requiring surgery; severe complications; rheumatic arthritis; obvious joint damage resulting from diseases other than OA (e.g., psoriasis, metabolic bone diseases, or inflammatory diseases); and the presence of any medical/clinical condition judged, by the investigators, as sufficient to preclude inclusion in this study.
Intervention and Patient AssignmentPatients were randomly assigned to receive either 260 mg/d (low-dose) or 1560 mg/d (high-dose) CS by a controller in the double-blind, dose-comparison study. The active tablets contained 260 mg of sodium CS (CS-A type). Patients assigned to the high-dose group took two active tablets three times per day, whereas patients assigned to be in the low-dose group took one active and one placebo tablet in the morning and two placebo tablets another two times a day. For dosing purposes, two tablets were packed in small bags and three small bags were packed as a one-day medication supply in each dose group. Intervention was continued for one-year until the final visit.
BlindingThe investigators and patients were blinded to treatment allocation for the one-year study period. Three-month packs of daily medication were stored in a tamper-proof box, and the controller sent patients for resupply every third month.
Two hundred sixty milligrams per day CS had a similar shape and color to those of the 1560 mg/d CS. Packaging specifications of the 260 mg/d CS also was the same as 1560 mg/d CS.
Assessment of Symptoms and BiomarkersSymptomatic changes during the intervention period were based on the LI and pain VAS score. The pain VAS scores were measured from 0 to 100, with 0 indicating no pain and 100 indicating the worst experienced pain. Patients recorded their VAS score as the worst pain during the 24 h before assessment. Patients attended hospital for assessments before the study and after 3, 6, 9, and 12 months of treatment with CS. Serum was sampled at the start of the study and after 12 months, and was frozen until use. Serum COMP and HA levels were determined by sandwich enzyme-linked immunosorbent assay (AnaMar Medical, Sweden) and competitive assay (Seikagaku Biobusiness Corp., Tokyo, Japan), respectively.
Safety AssessmentSafety was assessed throughout the study based on the incidence and severity of intervention-related adverse effects.
Statistical AnalysesData are expressed as the mean±standard error of the mean (S.E.M.), unless otherwise stated. The baseline characteristics of participants were compared between the high- and low-dose groups by Student t-tests, except for the categorical variable of sex, which was analyzed by Fisher’s exact test. The LI and VAS scores were compared between the high- and low-dose groups by the non-parametric Mann–Whitney U test.
The LI and VAS scores in the high- and low-dose groups were compared between any time (3, 6, 9 and 12 months) and 0 month by Tukey–Kramer test.
The levels of COMP and HA were analyzed by parametric, two-way, repeated-measures ANOVA. p-values <0.05 were considered statistically significant. For the subgroup analyses, both the high- and low-dose groups were divided into two subgroups by the initial LI score: 1) patients with an initial LI ≥8 (severe symptoms); and 2) patients with an initial LI <8 (mild symptoms). Allocation of patients was done without regard to the post-hoc division into subgroups and per-protocol analyses were used.
RESULTS
Baseline CharacteristicsData from 73 patients, who fulfilled the eligibility criteria and completed the study, were analyzed for clinical efficacy. As shown in Table 1, there were no significant differences between the two groups in demographic characteristics (age and male/female ratio), physiological characteristics (height and body weight), or blood test data. The subgroups by LI score at baseline are summarized in Table 2. In patients with severe symptoms, there were no significant differences between the two groups in demographic characteristics (age and male/female ratio), physiological characteristics (height and body weight), or blood test data. In patients with mild symptoms, there were no significant differences between the two groups in demographic characteristics (age and male/female ratio), physiological characteristics (height and body weight), or blood test data.
Table 1. Demographic and Baseline Characteristics
| Low-dose (n=32) | High-dose (n=41) |
|---|
| Mean±S.E.M. | Mean±S.E.M. |
|---|
| Age | 66.8±1.9 | 69.1±1.5 |
| Height | 154.1±1.0 | 153.0±1.0 |
| Body weight | 55.9±1.4 | 57.1±1.5 |
| Sex | Male | 4 | 8 |
| Female | 28 | 33 |
| Blood test | RBC (×104/µL) | 428±7 | 431±8 |
| WBC (/µL) | 5659±269 | 6238±234 |
| Hb (g/dL) | 13.0±0.2 | 13.2±0.2 |
| Ht (%) | 39.5±0.6 | 39.6±0.5 |
| Platelet count (×104/µL) | 20.3±0.8 | 21.0±0.8 |
| AST (U/L) | 24.0±2.1 | 22.0±1.0 |
| ALT (U/L) | 25.4±4.9 | 19.4±1.8 |
| ALP (U/L) | 220.9±14.4 | 230.0±10.7 |
| BUN (mg/dL) | 16.3±0.7 | 17.0±0.8 |
| Serum creatinine (mg/dL) | 0.66±0.03 | 0.67±0.03 |
Values are expressed as mean±S.E.M. except for gender. There were no significant differences between two dose groups in these measurements. Abbreviations: ALP, alkaline phosphatase; ALT, alanine transaminase; AST, aspartate transaminase; BUN, blood urea-nitrogen; Hb, hemoglobin; Ht, hematocrit; RBC, red blood cell count; WBC, white blood cell count.
Table 2. Subgroup Analysis of the Clinical Efficacy of Chondroitin Sulfate
| LI≥8 | LI<8 |
|---|
| Low-dose (n=18) | High-dose (n=23) | Low-dose (n=14) | High-dose (n=18) |
|---|
| Mean±S.E.M. | Mean±S.E.M. | Mean±S.E.M. | Mean±S.E.M. |
|---|
| Age | 67.6±2.8 | 70.0±1.8 | 65.9±2.6 | 67.9±2.4 |
| Height | 154.8±1.6 | 151.4±1.2 | 153.2±1.3 | 155.2±1.8 |
| Body weight | 57.0±1.6 | 57.1±1.9 | 54.6±2.4 | 57.1±2.3 |
| Sex | Male | 3 | 4 | 1 | 4 |
| Female | 15 | 19 | 13 | 14 |
| Blood test | RBC (×104/µL) | 433±10 | 433±13 | 422±10 | 428±7.4 |
| WBC (/µL) | 5467±298 | 6259±324 | 5907±486 | 6212±345 |
| Hb (g/dL) | 13.1±0.3 | 13.0±0.3 | 13.0±0.2 | 13.3±0.3 |
| Ht (%) | 39.8±0.9 | 39.4±0.8 | 39.0±0.6 | 40.0±0.7 |
| Platelet count (×104/µL) | 20.9±1.1 | 21.0±0.8 | 19.5±1.0 | 21.0±1.4 |
| AST (U/L) | 26.4±3.7 | 22.2±1.4 | 20.8±0.9 | 21.7±1.3 |
| ALT (U/L) | 30.8±8.6 | 20.5±3.1 | 18.4±1.3 | 18.0±1.6 |
| ALP (U/L) | 221.7±18.6 | 250.1±11.6 | 219.8±23.2 | 205.4±17.7 |
| BUN (mg/dL) | 16.0±0.9 | 17.8±1.1 | 16.7±1.1 | 16.0±1.0 |
| Serum creatinine (mg/dL) | 0.68±0.03 | 0.68±0.04 | 0.63±0.04 | 0.66±0.04 |
Values are expressed as mean±S.E.M. except for gender. There were no significant differences between two dose groups in these measurements. Abbreviations: ALP, alkaline phosphatase; ALT, alanine transaminase; AST, aspartate transaminase; BUN, blood urea–nitrogen; Hb, hemoglobin; Ht, hematocrit; RBC, red blood cell count; WBC, white blood cell count. Severe symptoms defined here correspond to the severe, very severe, and extremely severe descriptions by Lequesne et al.,37) whereas mild symptoms correspond to minor and moderate. Abbreviation: LI, Lequesne’s index.
The changes in mean LI scores during the intervention period are shown in Fig. 1. In both groups, the LI score decreased rapidly during the first 3 months of treatment and then gradually decreased until the end of the study. There were significant differences in the low-dose group at any time compared to 0 month (Fig. 1). There were also significant differences in the high-dose group at any time compared to 0 month (Fig. 1). The baseline LI scores in the low- and high-dose groups were not significantly different, and there were no significant differences in the LI scores between the groups at 3, 6, 9, or 12 months; however, the high-dose group did maintain lower LI scores than the low-dose group throughout the treatment period. Figure 2 shows the changes in mean VAS score. There were significant differences in the low-dose group at any time compared to 0 month (Fig. 2). There were also significant differences in the high-dose group at any time compared to 0 month (Fig. 2). The baseline VAS scores in the low- and high-dose groups were not significantly different. Although the high-dose group maintained slightly lower VAS scores than the low-dose group from 3 to 12 months, the difference did not reach statistical significance at either time point (Fig. 2).
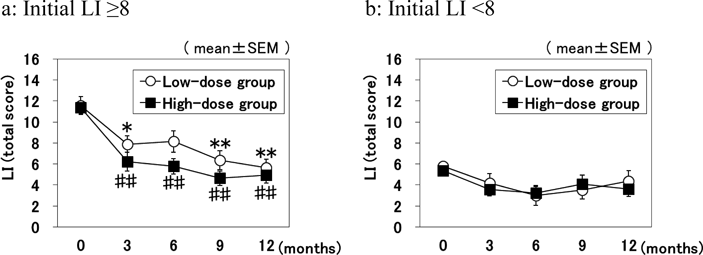
The responses of patients to the pain-relieving effect of CS may vary depending upon the type and/or severity of the symptom. To examine this possibility, each of high-dose and low-dose groups were divided into two subgroups according to the initial LI total score: one is a subgroup of patients with initial LI ≥8 (severe symptom) and the other with initial LI <8 (mild symptom) as shown in Table 2. In the subgroup analyses by LI score, the difference between the high- and low-dose groups was greater in patients with severe symptoms. As shown in Fig. 3, patients with severe symptoms tended to be more responsive to treatment, with the LI score in the high-dose group being much lower than that in the low-dose group at 3, 6, and 9 months, though without reaching statistical significance (Fig. 3a). There were significant differences in the low-dose group at any time compared to 0 month (Fig. 3a). There were also significant differences in the high-dose group at any time compared to 0 month (Fig. 3a). By contrast, in patients with mild symptoms, the mean LI scores of the high- and low-dose groups remained comparable at each assessment (Fig. 3b).
We checked the difference in dose for each component of the LI score. As shown in Fig. 4a, the subtotal scores for questions in Section I of the LI (pain or discomfort) were significantly improved at 6 and 9 months in the high-dose group compared with the low-dose group. We further examined changes in the scores for each question in Section I for patients with severe symptoms (Table 3). Excluding Section I-C (after standing), the scores were significantly lower in the high-dose than in the low-dose group at 9 months, while the scores for Section I-D (when ambulating) were significantly lower from as early as 6 months. By contrast, no differences treatments were obtained between the doses for either Section II (maximum distance walked) or Section III (activities of daily living) of the LI. The dose-related differences in Section I were only present in the patient subgroup with severe symptoms, and no such differences were present for patients with mild symptoms (Fig. 4b). In patients with severe symptoms, there were significant differences in the low-dose group at any time compared to 0 month (Fig. 4a). There were also significant differences in the high-dose group at any time compared to 0 month (Fig. 4a). In patients with mild symptoms, there were significant differences in the low-dose group at 6 and 12 months compared to 0 month (Fig. 4b). There were significant differences in the high-dose group at 12 months compared to 0 month (Fig. 4b). A similar difference between the two doses was also shown for the pain VAS scores in patients with severe symptoms. Pain VAS was significantly lower in the high-dose than in the low-dose patients at 6 months (Fig. 5a), and no significant difference was seen between the two doses for patients with mild symptoms (Fig. 5b). In patients with severe symptoms, there were significant differences in the low-dose group at any time compared to 0 month (Fig. 5a). There were also significant differences in the high-dose group at any time compared to 0 month (Fig. 5a). In patients with mild symptoms, there were significant differences in the low-dose group at any time compared to 0 month (Fig. 5b). There were also significant differences in the high-dose group at any time compared to 0 month (Fig. 5b).
Table 3. Pain-relieving Effects of Chondroitin Sulfate for Questions A–E in Section I of the LI among Patients with Severe Symptoms (Initial LI ≥8)
| I-A. Pain during nocturnal bedrest |
| Observation period | Before study | 3 months | 6 months | 9 months | 12 months |
| Low-dose | 1.00±0.18 | 0.22±0.10 | 0.44±0.15 | 0.29±0.11 | 0.33±0.11 |
| High-dose | 0.65±0.15 | 0.17±0.08 | 0.17±0.08 | 0.00±0.00* | 0.09±0.06 |
| I-B. Morning stiffness or regressive pain after rising |
| Observation period | Before study | 3 months | 6 months | 9 months | 12 months |
| Low-dose | 0.56±0.15 | 0.50±0.12 | 0.44±0.12 | 0.41±0.17 | 0.19±0.10 |
| High-dose | 0.61±0.14 | 0.26±0.09 | 0.22±0.11 | 0.04±0.04* | 0.09±0.06 |
| I-C. After standing for 30 min |
| Observation period | Before study | 3 months | 6 months | 9 months | 12 months |
| Low-dose | 0.67±0.11 | 0.44±0.12 | 0.5±0.12 | 0.28±0.11 | 0.24±0.11 |
| High-dose | 0.65±0.10 | 0.26±0.09 | 0.26±0.09 | 0.30±0.10 | 0.26±0.09 |
| I-D. While ambulating |
| Observation period | Before study | 3 months | 6 months | 9 months | 12 months |
| Low-dose | 1.28±0.11 | 0.94±0.06 | 0.94±0.10 | 0.76±0.11 | 0.56±0.13 |
| High-dose | 1.39±0.10 | 0.68±0.12 | 0.61±0.12* | 0.48±0.11* | 0.70±0.13 |
| I-E. While getting up from sitting without the help of arms |
| Observation period | Before study | 3 months | 6 months | 9 months | 12 months |
| Low-dose | 0.67±0.11 | 0.53±0.12 | 0.50±0.12 | 0.44±0.12 | 0.56±0.12 |
| High-dose | 0.87±0.07 | 0.45±0.11 | 0.35±0.10 | 0.17±0.08* | 0.27±0.10 |
| Total of section I |
| Observation period | Before study | 3 months | 6 months | 9 months | 12 months |
| Low-dose | 4.17±0.37 | 2.61±0.26 | 2.83±0.36 | 2.11±0.39 | 1.78±0.34 |
| High-dose | 4.17±0.26 | 1.78±0.35 | 1.61±0.31* | 1.00±0.24* | 1.39±0.30 |
Each value expressed as the mean±S.E.M. * p<0.05 indicates statistically significant difference between the low-dose and high-dose groups (Mann–Whitney U-test). Abbreviation: LI, Lequesne’s index.
The mean serum COMP levels in the subgroups with severe symptoms are shown in the left panel of Fig. 6. Two-way ANOVA revealed a significant effect of sampling time, but there was no effect of the CS dose and no interaction (F value=0.013). There were similar outcomes for the analyses of COMP levels for all subjects and for subgroups with mild symptoms (data not shown). These results indicate that serum COMP decreased during 12-month treatment periods, but that the CS dose did not affect serum COMP levels (Fig. 6). The serum levels of HA in the severe symptom subgroups were not affected by the CS dose or duration of treatment, and there was no significant interaction effect (right panel of Fig. 6). Similarly, there were no effects of sampling time, dose, or interaction on the serum levels of HA among all subjects or the subgroups with mild symptoms (data not shown).
SafetyAmong the 73 patients included in the analysis of clinical efficacy, only one patient treated at the high-dose developed nausea (a known side effect of CS). Other patients in both groups reported digestive discomfort, digestive irritation, or mild allergic reactions. All side effects that developed have been reported for CS, and no serious adverse effects were detected that could be attributed to CS. In total, 20 and 13 patients dropped out in the low- and high-dose groups, respectively; but, the drop-out rate was not higher in the high-dose group.
DISCUSSION
In this randomized, double-blind, dose-comparison study, we evaluated the clinical efficacy and safety of sodium CS in Japanese patients with radiographically confirmed knee OA of mild-to-moderate severity (KL grade 2–3). We compared oral doses of 1560 mg/d (high-dose) and 260 mg/d (low-dose), consistent with standard doses available OTC. The higher dose has an established safety and efficacy record over 50 years. By contrast, the lower dose is smaller than that reported to be beneficial in previous studies of knee OA, which typically recommend dosing in the region of 800 to 1200 mg/d.34)
The difference in symptom-relieving effect between the doses was not statistically significant in the analysis for all patients. However, in the subgroup analyses of patients with severe baseline symptoms (LI ≥8), high-dose CS had superior efficacy on reducing pain compared with low-dose CS. As shown in Fig. 4 and Table 2, the subtotal score for Section I of the LI showed a significant difference by dose for patients with severe symptoms at 6 and 9 months. Those differences persisted for individual questions about pain in the LI score. By 12 months, however, the scores of the low-dose group had improved to a level comparable to that in the high-dose group. Similar dose-related differences were obtained for the pain VAS pain scores in the subgroups of patients with severe symptoms. Thus, high-dose treatment was effective at improving pain faster than low-dose treatment in patients with severe knee OA symptoms.
In the subgroups of patients with mild symptoms (LI <8), no dose-related differences were shown in the LI and VAS scores, although the scales for mild symptoms tended to decrease rapidly, even in the low-dose group. It is beyond the scope of this study to discuss whether the observed improvement in the low-dose group reflects the effect of 260 mg/d of CS, the placebo effect, or the natural course of healing. In addition, rescue medications, such as NSAIDs and HA injections, could have diminished the dose effect of CS.43)
Our observations are consistent with the study by Clegg et al., who suggested that the combination of glucosamine and CS may be effective for a subgroup of patients with moderate-to-severe pain from knee OA based on the Western Ontario and McMaster Universities Osteoarthritis Index (WOMAC) pain subscale.34) Pavelka et al.36) also reported a dose-response study for oral sodium CS in patients with knee OA. They reported that CS at 200 mg/d for 90 d tended to improve LI and pain VAS scores more than placebo, but without being statistically significant. However, significant differences were shown between the CS and placebo groups in the LI and pain VAS scores at doses of 800 and 1200 mg/d. These doses were also shown to be superior to the 200 mg/d dose. Mean basal LI scores for the four doses in their study ranged from 10.97 to 12.17, which correspond to those of the severe subgroups in our study. Thus, together with the data produced by Pavelka et al., we conclude that there is a dose-response efficacy of CS in patients with severe knee OA symptoms.
In the present study, we found that 260 mg/d CS (low-dose group) were significant differences at any time compared to 0 month in patients with severe symptoms and mild symptoms (Figs. 1–5). It was reported that CS at 200 mg/d tended to improve LI and pain VAS scores more than placebo.36) Recently, Tsuji et al. reported that consumption of N-acetyl glucosamine (100 mg/d) and chondroitin sulfate (180 mg/d) for 12 weeks or longer has a positive effect on self-reported knee function and household physical activity in middle-age and older Japanese adults with knee pain.44) Therefore, CS as 260 mg/d at any time compared to 0 month may be an effective.
Concerning possible symptomatic efficacy, CS has been reported to reduce joint damage and slow disease progression in OA.4–7,28–31) Recently, various biomarkers have been developed to detect the articular alterations in OA, and accumulating evidence suggests that there are associations with changes in ECM protein components in the cartilage and synovium as disease progresses in knee OA.45,46) Finding the level of COMP in serum allows defining the degree of cartilage damage in OA47,48) and observing effectiveness of the treatment.49–52) In the serum of the normal population the COMP level is 5 µg/mL.53) Increase in serum level of HA has been suggested as a result of synovial inflammation and cartilage degradation, and thus, the measurement of the HA level in serum may be useful in assessing knee OA activity as well as determining predictive factors.54,55) It also has been reported that serum HA level was associated with the presence of radiographic knee OA.56–59) It has been reported normal human the HA level in the ranged from 53.9 to 55.2 ng/mL.60) In the present study, we used serum COMP and HA levels to evaluate these effects during CS therapy. Unexpectedly, however, the levels of these biomarkers did not differ between the dose groups at baseline or after 12 months’ treatment, which is inconsistent with the large improvements that we observed in the symptom scores. The lack of effect of CS on these two biomarkers may have resulted from the shorter one-year intervention period compared with the two-year study by Kahan et al., who demonstrated that CS slowed the rate of joint space narrowing in patients with symptomatic (radiographically confirmed) knee OA.7) It is also possible that more suitable biomarkers, which better reflect changes in the structure and function of the knee joint, are needed to demonstrate efficacy. Further study is clearly warranted to demonstrate the effects of CS on the biomarkers associated with pathophysiological changes in knee OA.
Many clinical trials have confirmed the excellent safety profile and good tolerability of CS.31,43,61) High-dose CS therapy was tolerable in the present study, and there was no increased drop-off rate compared to low-dose therapy. Also consistent with previous studies, we showed that there were no serious adverse effects attributable to CS and that tolerability was good.
The present clinical study has some limitations. Of note, we included a small number of subjects, which may have decreased the power to detect significant differences between the two groups. More frequent radiographic examinations may also have provided evidence for a structure-modifying effect of CS treatment. We anticipate that magnetic resonance imaging will serve as a better tool for detecting such effects of CS treatment in future studies.30,61)
In conclusion, we demonstrated oral treatment with sodium CS is tolerable, and that a dose of 1560 mg/d is more effective than 260 mg/d for pain relief in patients with knee OA. However, it was notable that this difference was only present for the subgroup of patients with severe symptoms. These results indicate that oral CS is a useful medication for pain control in knee OA. Although this study is limited by both the number of patients and items evaluated, our data warrant further investigation in larger studies to establish the clinical usefulness of CS.
Acknowledgments
We appreciated the clinical support received from Dr. Naoyuki Shizu, Dr. Kanae Shizu, Dr. Yuki Washimi, Dr. Shuntaro Hanamura, Dr. Arihiko Kanaji, Dr. Kazuyuki Maehara, Dr. Hirofusa Ichinose. We also appreciated the technical support received from Mrs. Kaori Tajima. We are grateful to Zeria Pharmaceutical Co., Ltd. for the gift of active and placebo tablets and for funding support.
Conflict of Interest
Kotaro Yamada and Hidetomo Sakurai are employees of Zeria Pharmaceutical Co., Ltd.
REFERENCES
- 1) Helmick CG, Felson DT, Lawrence RC, Gabriel S, Hirsch R, Kwoh CK, Liang MH, Kremers HM, Mayes MD, Merkel PA, Pillemer SR, Reveille JD, Stone JH. Estimates of the prevalence of arthritis and other rheumatic conditions in the United States. Part 1. Arthritis Rheum., 58, 15–25 (2008).
- 2) Issa SN, Sharma L. Epidemiology of osteoarthritis: an update. Curr. Rheumatol. Rep., 8, 7–15 (2006).
- 3) Zhang W, Moskowitz RW, Nuki G, Abramson S, Altman RD, Arden N, Bierma-Zeinstra S, Brandt KD, Croft P, Doherty M, Dougados M, Hochberg M, Hunter DJ, Kwoh K, Lohmander LS, Tugwell P. OARSI recommendations for the management of hip and knee osteoarthritis. Part II: OARSI evidence-based, expert consensus guidelines. Osteoarthritis Cartilage, 16, 137–162 (2008).
- 4) Uebelhart D, Thonar EJ, Delmas PD, Chantraine A, Vignon E. Effects of oral chondroitin sulfate on the progression of knee osteoarthritis: a pilot study. Osteoarthritis Cartilage, 6 (Suppl. A), 39–46 (1998).
- 5) Uebelhart D, Malaise M, Marcolongo R, DeVathaire F, Piperno M, Mailleux E, Fioravanti A, Matoso L, Vignon E. Intermittent treatment of knee osteoarthritis with oral chondroitin sulfate: a one-year, randomized, double-blind, multicenter study versus placebo. Osteoarthritis Cartilage, 12, 269–276 (2004).
- 6) Michel BA, Stucki G, Frey D, De Vathaire F, Vignon E, Bruehlmann P, Uebelhart D. Chondroitins 4 and 6 sulfate in osteoarthritis of the knee: a randomized, controlled trial. Arthritis Rheum., 52, 779–786 (2005).
- 7) Kahan A, Uebelhart D, De Vathaire F, Delmas PD, Reginster JY. Long-term effects of chondroitins 4 and 6 sulfate on knee osteoarthritis: the study on osteoarthritis progression prevention, a two-year, randomized, double-blind, placebo-controlled trial. Arthritis Rheum., 60, 524–533 (2009).
- 8) Reginster JY, Deroisy R, Rovati LC, Lee RL, Lejeune E, Bruyere O, Giacovelli G, Henrotin Y, Dacre JE, Gossett C. Long-term effects of glucosamine sulfate on osteoarthritis progression: a randomised, placebo-controlled clinical trial. Lancet, 357, 251–256 (2001).
- 9) Pavelká K, Gatterová J, Olejarová M, Machacek S, Giacovelli G, Rovati LC. Glucosamine sulfate use and delay of progression of knee osteoarthritis: a 3-year, randomized, placebo-controlled, double-blind study. Arch. Intern. Med., 162, 2113–2123 (2002).
- 10) Bruyere O, Pavelka K, Rovati LC, Gatterova J, Giacovelli G, Olejarova M, Deroisy R, Reginster JY. Total joint replacement after glucosamine sulfate treatment in knee osteoarthritis: results of a mean 8-year observation of patients from two previous 3-year, randomized, placebo-controlled trials. Osteoarthritis Cartilage, 16, 254–260 (2008).
- 11) Dougados M, Nguyen M, Berdah L, Maziéres B, Vignon E, Lequesne M. Evaluation of structure-modifying effects of diacerein in hip osteoarthritis: ECHODIOH, a three-year, placebo-controlled, trial. Evaluation of the chondromodulating effect of diacerein in OA of the hip. Arthritis Rheum., 44, 2539–2547 (2001).
- 12) Brandt KD, Mazzuca SA, Katz BP, Lane KA, Buckwalter KA, Yocum DE, Wolfe F, Schnitzer TJ, Moreland LW, Manzi S, Bradley JD, Sharma L, Oddis CV, Hugenberg ST, Heck LW. Effects of doxycycline on progression of osteoarthritis: results of a randomized, placebo-controlled, double-blind trial. Arthritis Rheum., 52, 2015–2025 (2005).
- 13) Raynauld JP, Martel-Pelletier J, Bias P, Laufer S, Haraoui B, Choquette D, Beaulieu AD, Abram F, Dorais M, Vignon E, Pelletier JP. Protective effects of licofelone, a lipoxygenase and cyclo-oxygenase inhibitor, versus naproxen on cartilage loss in knee osteoarthritis: a first multicentre clinical trial using quantitative MRI. Ann. Rheum. Dis., 68, 938–947 (2009).
- 14) Wieland HA, Michaelis M, Kirschbaum BJ, Rudolphi KA. Osteoarthritis: an untreatable disease? Nat. Rev. Drug Discov., 4, 331–344 (2005).
- 15) Rashad S, Revell P, Hemingway A, Low F, Rainsford K, Walker F. Effect of non-steroidal anti-inflammatory drugs on the course of osteoarthritis. Lancet, 334, 519–522 (1989).
- 16) Adams ME, Lussier AJ, Peyron JG. A risk-benefit assessment of injections of hyaluronan and its derivatives in the treatment of knee osteoarthritis. Drug Saf., 23, 115–130 (2000).
- 17) Omata T, Itokazu Y, Inoue N, Segawa Y. Effects of chondroitin sulfate-C on articular cartilage destruction in murine collagen-induced arthritis. Arzneimittelforschung, 50, 148–153 (2000).
- 18) Orth MW, Peters TL, Hawkins JN. Inhibition of articular cartilage degradation by glucosamine-HCl and chondroitin sulfate. Equine Vet. J. Suppl., 2002, 224–229 (2002).
- 19) Tat SK, Pelletier JP, Vergés J, Lajeunesse D, Montell E, Fahmi H, Lavigne M, Martel-Pelletier J. Chondroitin and glucosamine sulfate in combination decrease the pro-resorptive properties of human osteoarthritis subchondral bone osteoblasts: a basic science study. Arthritis Res. Ther., 9, R117 (2007).
- 20) Chan PS, Caron JP, Orth MW. Effect of glucosamine and chondroitin sulfate on regulation of gene expression of proteolytic enzymes and their inhibitors in interleukin-1-challenged bovine articular cartilage explants. Am. J. Vet. Res., 66, 1870–1876 (2005).
- 21) du Souich P, García AG, Vergés J, Montell E. Immunomodulatory and anti-inflammatory effects of chondroitin sulfate. J. Cell. Mol. Med., 13 (8A), 1451–1463 (2009).
- 22) Bishnoi M, Jain A, Hurkat P, Jain SK. Chondroitin sulphate: a focus on osteoarthritis. Glycoconj. J., 33, 693–705 (2016).
- 23) Morreale P, Manopulo R, Galati M, Boccanera L, Saponati G, Bocchi L. Comparison of the antiinflammatory efficacy of chondroitin sulfate and diclofenac sodium in patients with knee osteoarthritis. J. Rheumatol., 23, 1385–1391 (1996).
- 24) Jordan KM, Arden NK, Doherty M, Bannwarth B, Bijlsma JW, Dieppe P, Gunther K, Hauselmann H, Herrero-Beaumont G, Kaklamanis P, Lohmander S, Leeb B, Lequesne M, Mazieres B, Martin-Mola E, Pavelka K, Pendleton A, Punzi L, Serni U, Swoboda B, Verbruggen G, Zimmerman-Gorska I, Dougados M. EULAR recommendations 2003: an evidence based approach to the management of knee osteoarthritis: Report of a Task Force of the Standing Committee for International Clinical Studies Including Therapeutic Trials (ESCISTT). Ann. Rheum. Dis., 62, 1145–1155 (2003).
- 25) Leeb BF, Schweitzer H, Montag K, Smolen JS. A meta-analysis of chondroitin sulfate in the treatment of osteoarthritis. J. Rheumatol., 27, 205–211 (2000).
- 26) McAlindon TE, LaValley MP, Gulin JP, Felson DT. Glucosamine and chondroitin for treatment of osteoarthritis: a systematic quality assessment and meta-analysis. JAMA, 283, 1469–1475 (2000).
- 27) Richy F, Bruyere O, Ethgen O, Cucherat M, Henrotin Y, Reginster JY. Structural and symptomatic efficacy of glucosamine and chondroitin in knee osteoarthritis: a comprehensive meta-analysis. Arch. Intern. Med., 163, 1514–1522 (2003).
- 28) Hochberg MC, Zhan M, Langenberg P. The rate of decline of joint space width in patients with osteoarthritis of the knee: systematic review and meta-analysis of randomized placebo-controlled trials of chondroitin sulfate. Curr. Med. Res. Opin., 24, 3029–3035 (2008).
- 29) Lee YH, Woo JH, Choi SJ, Ji JD, Song GG. Effect of glucosamine or chondroitin sulfate on the osteoarthritis progression: a meta-analysis. Rheumatol. Int., 30, 357–363 (2010).
- 30) Pelletier JP, Raynauld JP, Beaulieu AD, Bessette L, Morin F, de Brum-Fernandes AJ, Delorme P, Dorais M, Paiement P, Abram F, Martel-Pelletier J. Chondroitin sulfate efficacy versus celecoxib on knee osteoarthritis structural changes using magnetic resonance imaging: a 2-year multicentre exploratory study. Arthritis Res. Ther., 18, 256 (2016).
- 31) Singh JA, Noorbaloochi S, MacDonald R, Maxwell LJ. Chondroitin for osteoarthritis. Cochrane Database Syst. Rev., 28, CD005614 (2015). doi: 10.1002/14651858.CD005614.pub2
- 32) Herrero-Beaumont G, Román-Blas J, Castañeda S, Largo R, Blanco FJ. Chondroitin sulfate plus glucosamine sulfate does not show superiority over placebo in a randomised, double blind, placebo-controlled clinical trial in patients with knee osteoarthritis. Osteoarthritis Cartilage, 24 (Suppl. 1), S48–S49 (2016).
- 33) Sawitzke AD, Shi H, Finco MF, Dunlop DD, Bingham CO 3rd, Harris CL, Singer NG, Bradley JD, Silver D, Jackson CG, Lane NE, Oddis CV, Wolfe F, Lisse J, Furst DE, Reda DJ, Moskowitz RW, Williams HJ, Clegg DO. The effect of glucosamine and/or chondroitin sulfate on the progression of knee osteoarthritis: a report from the glucosamine/chondroitin arthritis intervention trial. Arthritis Rheum., 58, 3183–3191 (2008).
- 34) Clegg DO, Reda DJ, Harris CL, Klein MA, O’dell JR, Hooper MM, Bradley JD, Bingham CO III, Weisman MH, Jackson CG, Lane NE, Cush JJ, Moreland LW, Schumacher HR Jr, Oddis CV, Wolfe F, Molitor JA, Yocum DE, Schnitzer TJ, Furst DE, Sawitzke AD, Shi H, Brandt KD, Moskowitz RW, Williams HJ. Glucosamine, chondroitin sulfate, and the two in combination for painful knee osteoarthritis. N. Engl. J. Med., 354, 795–808 (2006).
- 35) Miwa T. Clinical effect of chondroitin sulfate on Indefinite Symptoms. Clin. Rep., 21, 6239–6245 (1987).
- 36) Pavelka K, Manopulo R, Bucsi L. Double-blind, dose-effect study of oral CS 1200, 800, 200 mg and placebo in the treatment of knee osteoarthritis. Litera Pheumatologica, 24, 21–30 (1998).
- 37) Lequesne MG, Mery C, Samson M, Gerard P. Indexes of severity for osteoarthritis of the hip and knee. Validation—value in comparison with other assessment tests. Scand. J. Rheumatol. Suppl., 16, 85–89 (1987).
- 38) Huskisson EC. Measurement of pain. J. Rheumatol., 9, 768–769 (1982).
- 39) Tseng S, Reddi AH, Di Cesare PE. Cartilage oligomeric matrix protein (COMP): a biomarker of arthritis. Biomark. Insights, 4, 33–44 (2009).
- 40) Turan Y, Bal S, Gurgan A, Topac H, Koseoglu M. Serum hyaluronan levels in patients with knee osteoarthritis. Clin. Rheumatol., 26, 1293–1298 (2007).
- 41) Sharif M, George E, Shepstone L, Knudson W, Thonar EJ, Cushnaghan J, Dieppe P. Serum hyaluronic acid level as a predictor of disease progression in osteoarthritis of the knee. Arthritis Rheum., 38, 760–767 (1995).
- 42) Kellgren JH, Lawrence JS. Radiological assessment of osteo-arthrosis. Ann. Rheum. Dis., 16, 494–502 (1957).
- 43) Monfort J, Martel-Pelletier J, Pelletier JP. Chondroitin sulfate for symptomatic osteoarthritis: critical appraisal of meta-analyses. Curr. Med. Res. Opin., 24, 1303–1308 (2008).
- 44) Tsuji T, Yoon J, Kitano N, Okura T, Tanaka K. Effects of N-acetyl glucosamine and chondroitin sulfate supplementation on knee pain and self-reported knee function in middle-aged and older Japanese adults: a randomized, double-blind, placebo-controlled trial. Aging Clin. Exp. Res., 28, 197–205 (2016).
- 45) Belo JN, Berger MY, Reijman M, Koes BW, Bierma-Zeinstra SMA. Prognostic factors of progression of osteoarthritis of the knee: a systematic review of observational studies. Arthritis Rheum., 57, 13–26 (2007).
- 46) Sofat N. Analysing the role of endogenous matrix molecules in the development of osteoarthritis. Int. J. Exp. Pathol., 90, 463–479 (2009).
- 47) Petersson IF, Boegard T, Dahlstrom J, Svensson B, Heinegard D, Saxne T. Bone scan and serum markers of bone and cartilage in patients with knee pain and osteoarthritis. Osteoarthritis Cartilage, 6, 33–39 (1998).
- 48) Vilím V, Olejarova M, Machacek S, Gatterova J, Kraus VB, Pavelka K. Serum levels of cartilage oligomeric matrix protein (COMP) correlate with radiographic progression of knee osteoarthritis. Osteoarthritis Cartilage, 10, 707–713 (2002).
- 49) Haberhauer GF, Feyertag J, Kittl EM, Bauer K, Dunky A. Steroid treatment normalises the variability and levels of serum COMP in RA patients, indicating a possibility to monitor effect of cartilage protective drugs. Ann. Rheum. Dis., 61 (Suppl. 1), 200 (2002).
- 50) Haberhauer GF, Feyertag J, Kitti EM, Bauer K, Dunky A. Rapid decrease of COMP serum levels in patients with active RA undergoing IV steroid treatment. Ann. Rheum. Dis., 62 (Suppl. 1), 166 (2003).
- 51) Crnkic M, Månsson B, Larsson L, Geborek P, Heinegard D, Saxne T. Serum cartilage oligomeric matrix protein (COMP) decreased in rheumatoid arthritis patients treated with infliximab or etanercept. Arthritis Res. Ther., 5, R181–R185 (2003).
- 52) den Broeder AA, Joosten LA, Saxne T, Heinegård D, Fenner H, Miltenburg AM, Frasa WL, van Tits LJ, Buurman WA, van Riel PL, van de Putte LB, Barrera P. Long term anti-tumour necrosis factor alpha monotherapy in rheumatoid arthritis: effect on radiological course and prognostic value of markers of cartilage turnover and endothelial activation. Ann. Rheum. Dis., 61, 311–318 (2002).
- 53) Neidhart M, Hauser N, Paulsson M, DiCesare PE, Michel BA, Häuselmann HJ. Small fragments of cartilage oligomeric matrix protein in synovial fluid and serum as markers for cartilage degradation. Br. J. Rheumatol., 36, 1151–1160 (1997).
- 54) Turan Y, Bal S, Gurgan A, Topac H, Koseoglu M. Serum hyaluronan levels in patients with knee osteoarthritis. Clin. Rheumatol., 26, 1293–1298 (2007).
- 55) Sharif M, George E, Shepstone L, Knudson W, Thonar EJJ, Cushnaghan J, Dieppe P. Serum hyaluronic acid level as a predictor of disease progression in osteoarthritis of the knee. Arthritis Rheum., 38, 760–767 (1995).
- 56) Georges C, Vigneron H, Ayral X, Listrat V, Ravaud P, Dougados M, Sharif M, Dieppe P, Saxne T. Serum biologic markers as predictors of disease progression in osteoarthritis of the knee. Arthritis Rheum., 40, 590–591 (1997).
- 57) Pavelka K, Forejtová S, Olejárová M, Gatterová J, Senolt L, Spacek P, Braun M, Hulejová M, Stovícková J, Pavelková A. Hyaluronic acid levels may have predictive value for the progression of knee osteoarthritis. Osteoarthritis Cartilage, 12, 277–283 (2004).
- 58) Elliott AL, Kraus VB, Luta G, Stabler T, Renner JB, Woodard J, Dragomir AD, Helmick CG, Hochberg MC, Jordan JM. Serum hyaluronan levels and radiographic knee and hip osteoarthritis in African Americans and Caucasians in the Johnston County Osteoarthritis Project. Arthritis Rheum., 52, 105–111 (2005).
- 59) Goldberg RL, Huff JP, Lenz ME, Glickman P, Katz REJ, Thonar EJ. Elevated plasma levels of hyaluronate in patients with osteoarthritis and rheumatoid arthritis. Arthritis Rheum., 34, 799–807 (1991).
- 60) Inoue R, Ishibashi Y, Tsuda E, Yamamoto Y, Matsuzaka M, Takahashi I, Danjo K, Umeda T, Nakaji S, Toh S. Knee osteoarthritis, knee joint pain and aging in relation to increasing serum hyaluronan level in the Japanese population. Osteoarthritis Cartilage, 19, 51–57 (2011).
- 61) Wildi LM, Raynauld JP, Martel-Pelletier J, Beaulieu A, Bessette L, Morin F, Abram F, Dorais M, Pelletier JP. Chondroitin sulfate reduces both cartilage volume loss and bone marrow lesions in knee osteoarthritis patients starting as early as 6 months after initiation of therapy: a randomized, double-blind, placebo-controlled pilot study using MRI. Ann. Rheum. Dis., 70, 982–989 (2011).