Abstract
Upon differentiation of cells, remarkable changes in the structures of glycans linked to lipids on cell surface have been observed. Lactosylceramide (Lac-Cer) serves as a common precursor for a series of glycosphingolipids with diverse structures. In the present study, we examined the underlying mechanism for the biosynthesis of Lac-Cer upon differentiation of 3T3-L1 mouse preadipocytes to adipocytes. TLC analysis showed that the amounts of Lac-Cer decrease in 3T3-L1 adipocytes compared to 3T3-L1 preadipocytes. In accordance with this change, the gene expression level of β4-galactosyltransferase (β4GalT) 5, which was identified as Lac-Cer synthase, decreased drastically upon differentiation of 3T3-L1 preadipocytes. The analysis of the transcriptional mechanism of the β4GalT5 gene demonstrated that the core promoter region is identified between nucleotides −299 and −1 relative to the translational start site. During adipocyte differentiation, the expression levels and promoter activities of the β4GalT5 gene decreased dramatically. Since the Specificity protein 1 (Sp1)-binding sites in the promoter region were critical for the promoter activity, it is suggested that Sp1 plays an important role for the expression of the β4GalT5 gene in 3T3-L1 cells. The gene and protein expression of Sp1 decreased significantly upon differentiation of 3T3-L1 preadipocytes. Taken together, the present study suggest that the expression of the β4GalT5 gene decreases through reduced expression of the Sp1 gene and protein upon differentiation of 3T3-L1 peradipocytes to adipocytes, which may lead to the decreased amounts of Lac-Cer in 3T3-L1 adipocytes.
The prevalence of obesity is one of the serious problems in modern societies globally. Obesity has been shown to be closely associated with a number of pathological disorders, including hypertension, atherosclerosis, and non-insulin-dependent diabetes.1) Obesity is ascribed to the excessive accumulation of adipose tissues consisting of adipocytes with hyperplasia and hypertrophy.2) To develop a novel therapeutic treatment for obesity, the underlying mechanism of the regulation of the molecules related to the adipocyte differentiation needs to be clarified.
In association with the adipocyte differentiation, dramatic changes are induced in the morphology and physiology of the preadipocytes.1) One of the prominent physiological changes in the adipocyte differentiation model using mouse 3T3-L1 cell line is the increased synthesis of triglycerides and fatty acids in accompany with the elevated expression levels and activities of the enzymes such as glycerophosphate dehydrogenase and lipoprotein lipase, which are involved in the lipogenic capabilities of the cells.3,4) The gangliosides belonging to the glycosphingolipids (GSLs) consist of carbohydrate and ceramide (Cer) portions, the former of which is generally composed of glucose (Glc), galactose (Gal), N-acetylgalactosamine (GalNAc), and sialic acid (Sia). The gangliosides are involved in essential biological functions at cell surface such as cell growth and differentiation.5,6) The amounts of gangliosides, including GM3 (Siaα2→3Galβ1→4Glc-Cer), which was one of major components in the cells, decreased upon adipocyte differentiation.7) Lactosylceramide (Lac-Cer, Galβ1→4Glc-Cer), one of GSLs, is synthesized from glucosylceramide (Glc-Cer) by Lac-Cer synthase, which transfers Gal from uridine 5′-diphosphate-Gal to Glc residue of Glc-Cer, and serves as a common precursor for GSLs.8) In the previous studies, two cDNAs encoding human β4-galactosyltransfease (β4GalT) 5 and rat β4GalT6 were originally isolated,9,10) and they were identified to be Lac-Cer synthases in mammalian cells.11–13)
In our laboratory, the human and mouse cDNAs encoding β4GalT5 were isolated,9,14) and the relationships between β4GalT5 and cancer properties were analyzed so far.15–17) Since Lac-Cer is an important precursor for expressing a variety of GSLs, it is of interest to examine the relationship between β4GalT5 and diseases except for cancer. Although the amounts of some GSLs have been shown to decrease upon differentiation of 3T3-L1 preadipocytes,7) whether or not the amounts of Lac-Cer upon adipocyte differentiation change remains unknown. As the first step, we analyzed the amounts of Lac-Cer and the underlying mechanism of Lac-Cer biosynthesis upon adipocyte differentiation using 3T3-L1 mouse cell line, which is a well-characterized model for adipocyte differentiation.
MATERIALS AND METHODS
ChemicalsBovine insulin, dexamethasone (Dex), 3-isobutyl-1-methylxanthine (IBMX), and oil red O were obtained from Sigma-Aldrich (St. Louis, MO, U.S.A.). Rabbit anti- Specificity protein 1 (Sp1) and anti-β-actin antibodies were from Santa Cruz Biotechnology (Santa Cruz, CA, U.S.A.).
Cell Culture and Induction of Differentiation3T3-L1 mouse cell line was obtained from Human Science Research Resources Bank (Osaka, Japan). 3T3-L1 cells were grown in Dulbecco’s modified Eagle’s medium (DMEM) containing 10% fetal calf serum (FCS), 50 units/mL penicillin and 50 µg/mL streptomycin. 3T3-L1 cells were cultured until confluent, and two days later, the cells were induced to differentiation by the addition of 1 µM Dex, 0.5 mM IBMX, and 10 µg/mL insulin for eight days. The medium containing the above-mentioned differentiation inducers was changed every two days.
Oil Red O StainingThe 3T3-L1 preadipocytes and adipocytes at Day-8 were washed with 10 mM phosphate-buffered saline (pH 7.4) and fixed with 10% formaldehyde for 1 h. The fixed cells were washed with water and then stained with 0.3% oil red O for 15 min. After staining, the cells were washed with water, and then isopropanol was added to the cells to extract oil red O from the cells. The extracts were transferred to the 96-well microtiter plates, and the absorbance of each well at 540 nm was determined using a microtiter plate reader.
Neutral Glycolipid AnalysisTotal lipid fractions were prepared from 3T3-L1 preadipocytes and adipocytes at Day-8, and TLC analysis was performed as described previously.12,17) Lipid preparations whose amounts were equivalent to 800 µg of cellular proteins were applied to a high-performance TLC silica gel 60 plate (Merck KGaA, Darmstadt, Germany), and separated by TLC using chloroform–methanol–water (60 : 25 : 4, v/v/v) as a solvent. The neutral GSLs were detected with an anthrone-thiourea reagent by heating at 120°C. The bands of glycolipids were determined by comparison with the positions of authentic Glc-Cer, Lac-Cer, globotriaosylceramide (Gb3-Cer, Galα1→4Galβ1→4Glc-Cer), and globotetraosylceramide (Gb4-Cer, GalNAcβ1→3Galα1→4Galβ1→4Glc-Cer) migrated. Each band intensity of Lac-Cer was determined by ImageJ analysis (ver. 1.46r), and ratios between those of preadipocytes and adipocytes were calculated as described previously.12,17)
Quantitative Real-Time and Conventional RT-PCR AnalysesQuantitative real-time RT-PCR analysis was performed as described previously.17–20) In brief, total RNA samples were prepared from 3T3-L1 preadipocytes and adipocytes, and used for first-strand cDNA synthesis. The gene-specific primers were used as follows: β4GalT5, F: 5′-AGA TTT CAC CTA CTT TGC CAA CCA C-3′, R: 5′-GCT TAA TGG CCG GGT CTC TG-3′; β4GalT6, F: 5′-AGA CTG CAA GCC CAG ATG GAA-3′, R: 5′-CAT CGG AAT CAG GTG CAG GA-3′; Sp1, 5′-TCA TGG ATC TGG TGG TGA TGG G-3′, R: 5′-GCT CTT CCC TCA CTG TCT TTG C-3′; aP2, F: 5′-GCG TGG AAT TCG ATG AAA TCA-3′, R: 5′-CCC GCC ATC TAG GGT TAT GA-3′; 18S ribosomal RNA (18S), F: 5′-ACC GCA GCT AGG AAT AAT GGA-3′, R: 5′-GCC TCA GTT CCG AAA ACC A-3′. The amplification efficiency of the β4GalT5 and β4GalT6 mRNAs using each primer pairs was calculated as described previously.20)
Conventional RT-PCR analysis was carried out by the method as described previously.12,16) The gene-specific primers were used as follows: β4GalT5, F: 5′-ACT TGG ATT GGG ATT GTC TGA T-3′, R: 5′-CGC AGA GTA GTT CAG GTT GTT G-3′; β4GalT6, F: 5′-CAT CAG CTC TTC TCC AAG GAC T-3′, R: 5′-ACT CTG TTC CAA AGG TCA TCG T-3′; elongation factor (EF)-1α, F: 5′-CCA TGA AGC TTT GAG TGA AGC TCT-3′; R: 5′-TAG CCT TCT GAG CTT TCT GGG CAG-3′.
Isolation of 5′-Flanking Region of Mouse β4GalT5 GeneThe DNA fragment with the 5′-flanking and partial coding regions of the mouse β4GalT5 gene was cloned by PCR using the mouse genomic DNA prepared from whole blood cells as a template.21) Based on the mouse DNA sequence from the clone RP23-465I6 on chromosome 2 (accession no. AL591762), the following 5′- and 3′-primer pairs were designed and used: TS27-57 (5′-CTG GCC ATG TCC CTT TCC TTA CCA G-3′) and TS137 (5′-TGC CGG GCG CCA CAT AGA CGA AGT A-3′) for the amplification of the region −1980 to +112 relative to the translational start site.
Reporter Plasmid ConstructionTo analyze the promoter activities of the β4GalT5 gene, several deletion constructs of the 5′-flanking regions with different length were generated by insertion of the PCR fragments between NheI and BglII sites of pGL3-Basic vector (Promega, Madison, WI, U.S.A.) containing the firefly luciferase gene as a reporter. The NheI-BglII fragment was cloned by PCR with the 5′- and 3′-primer pairs, in which NheI and BglII sites are underlined, respectively, as described below. The numbers indicate the nucleotide positions relative to the translational start site. 1) pGL(−1980/−1), TS27-63 (5′-CGGCTAGCCTG GCC ATG TCC CTT TCC TTA C-3′) and TS27-64 (5′-GAAGATCTGCT GAG CCG GCG GCC GCT CGA G-3′) were used. 2) pGL(−1513/−1), TS27-72 (5′-CGGCTAGCGAT GGG AAA GTC GAG GCT TGG A-3′) and TS27-64 were used. 3) pGL(−1048/−1), TS27-73 (5′-CGGCTAGCGAG AGG CTT CCC CCT CAA TCT C-3′) and TS27-64 were used. 4) pGL(−480/−1), TS27-74 (5′-CGGCTAGCCGC AAA ATG CTT GTT ATG CTC C-3′) and TS27-64 were used. 5) pGL(−299/−1), pGL(−480/−1) was digested with KpnI. The plasmid was then self-ligated with T4 DNA ligase. 6) pGL(−218/−1), TS28-25 (5′-CGGCTAGCCCT AAC AGG CCC CGC CCC GCC C-3′) and TS27-64 were used. 7) pGL(−132/−1), pGL(−480/−1) was digested with KpnI and SacII. The ends were blunted with T4 DNA polymerase, and the plasmid was then self-ligated. 8) pGL-Sp1m1, two Sp1-binding sites of pGL(−299/−1) were mutated using a KOD –Plus– Mutagenesis Kit (TOYOBO, Osaka, Japan). The mutations are underlined in nucleotides −240 to −231 and −228 to −219 relative to the translational start site (ACC CCGAACC and ACC CCGAACT in place of the wild-type sequences, ACC CCG CCC C and ACC CCG CCC T, respectively). 9) pGL-Sp1m2, one Sp1-binding site of pGL(−218/−1) was mutated as described above. The mutation is underlined in nucleotides −210 to −201 relative to the translational start site (GCC CCGAACC in place of the wild-type sequence, GCC CCG CCC C). The correct sequences of the plasmids used in this study were confirmed by nucleotide sequencing.
Luciferase AssayThe promoter activities of the reporter plasmid constructs were evaluated by luciferase assay as described previously.18,20–22)
Establishment of 3T3-L1 Cells Containing β4GalT5 Gene PromoterThe reporter plasmid pGL4-mGT5-0.3 was prepared by the insertion of the 0.3 kb promoter region (−299/−1) into upstream of the firefly luciferase gene in pGL4.15 vector [luc2p/Hygro] (Promega) containing the hygromycin-resistant gene. To establish the 3T3-L1 cells having the luciferase gene under the control of the mouse β4GalT5 gene promoter, named as mGT5-0.3-sensor cells, pGL4-mGT5-0.3 (4 µg) was transfected by electroporation (960 µF and 160 V) into 3T3-L1 cells (1.0×10⁶ cells in 0.2 cm cuvette) using a Gene Pulser Xcell CE system (Bio-Rad Laboratories Inc., Hercules, CA, U.S.A.). After being cultured for 72 h, the plasmid-transfected cells were selected by the treatment with DMEM containing 5% FCS and hygromycin B (400 µg/mL) for two weeks. To induce the adipocyte differentiation, the sensor cells were treated with 1 µM Dex, 0.5 mM IBMX, and 10 µg/mL insulin as described above.
Immunoblot AnalysisThe cell lysates were prepared from 3T3-L1 preadipocytes and adipocytes. Immunoblot analysis with the antibodies against Sp1 and β-actin was conducted as described previously.21,23)
Statistical AnalysisAll experiments were conducted three times, and the mean values with standard deviations were shown. A significant difference in the experiments was determined with Student’s t-test for the comparison of the means of two independent, and with one-way ANOVA followed by Bonferroni’s test for the comparison of the means of more than two independent groups.
RESULTS
Differentiation of 3T3-L1 Preadipocytes to Adipocytes3T3-L1 mouse cell line is used as a well-characterized model system to study on the adipocyte differentiation.24,25) The cells at confluency were cultured in the presence of Dex, IBMX, and insulin for eight days. As shown in Fig. 1A, the cell morphology drastically changed after eight days. The adipocytes at Day-8 accumulated the oil droplets, while the preadiocytes did not (Fig. 1A). In order to confirm the differentiation of 3T3-L1 preadipocytes to adipocytes, oil red O staining was performed. 3T3-L1 preadipocytes were not stained with oil red O, but the cells by the treatment with Dex, IBMX, and insulin were strongly stained with oil red O. When the lipid accumulation in the differentiated 3T3-L1 adipocytes was evaluated quantitatively by measurement of oil red O staining, about two-fold higher accumulation was observed for 3T3-L1 adipocytes compared to 3T3-L1 preadipocytes (Fig. 1B), suggesting that the cells differentiate to adipocytes by the treatment with Dex, IBMX, and insulin. Furthermore, the gene expression of aP2, which is a fatty acid binding protein and one of the markers for adipocytes,26) increased dramatically in 3T3-L1 adipocytes when compared with preadipocytes (Fig. 1C). These results indicate that upon treatment with Dex, IBMX, and insulin, 3T3-L1 preadipocytes differentiates into cells showing the morphological and biochemical characteristic of adipocytes.
Neutral Glycolipid Components of 3T3-L1 Preadipocytes and AdipocytesTo examine whether or not the amounts of Lac-Cer changed upon differentiation of 3T3-L1 preadipocytes to adipocytes, TLC analysis was performed using total lipid fractions. Upon detection of neutral glycolipids with an anthrone-thiourea reagent, the amounts of Lac-Cer in 3T3-L1 adipocytes decreased when compared with that of 3T3-L1 preadipocytes (Fig. 2). On the other hand, the amounts of Glc-Cer appeared to be similar between preadipocytes and adipocytes (Fig. 2). These results suggest that the biosynthesis of Lac-Cer is inhibited upon differentiation of 3T3-L1 preadipocytes.
Expression of the β4GalT5 Gene in 3T3-L1 Preadipocytes and AdipocytesSince β4GalT5 and β4GalT6 are involved in the biosynthesis of Lac-Cer,10–13) the expression levels of both genes were analyzed. The results of RT-PCR showed that significant amplification of the β4GalT5 gene is detected, but the amplification of the β4GalT6 gene can not be detected in 3T3-L1 preadipocytes and adipocytes under the same PCR condition (Fig. 3A), suggesting that β4GalT6 is not expressed in 3T3-L1 cells, and β4GalT5 is responsible for the biosynthesis of Lac-Cer in 3T3-L1 cells. Quantitative real-time RT-PCR analysis revealed that the expression of the β4GalT5 gene decreases to 22% of that of 3T3-L1 preadipocytes (Fig. 3B). The amplification efficiency was 88.9% and 94.5% for the amplicons of the β4GalT5 and β4GalT6 mRNAs, respectively. However, the expression of the β4GalT6 gene could not be also detected by quantitative real-time RT-PCR even though much higher amplification efficiency was associated with the amplification of the β4GalT6 gene.
Transcriptional Mechanism of the β4GalT5 Gene in 3T3-L1 PreadipocytesTo clarify the mechanism for decreased expression of the β4GalT5 gene upon adipocyte differentiation, the 5′-flanking region of the β4GalT5 gene was isolated, and the transcriptional regulation was analyzed using the deletion constructs. Luciferase assay showed that significant promoter activity is associated with pGL(−299/−1) in spite of deleting the region between −1980 and −300 (Fig. 4). Furthermore, the promoter activities of pGL(−218/−1) and pGL(−132/−1) were significantly reduced to 49 and 16% of pGL(−1980/−1) (Fig. 4-lower panel). These results indicate that the core promoter region is identified between nucleotides −299 and −1, and contains the crucial positive regulatory elements.
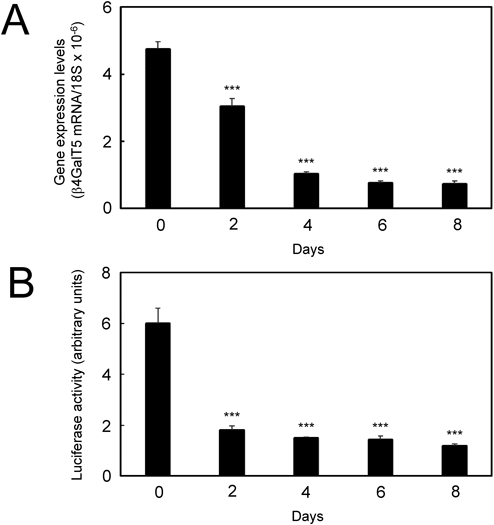
Expression and Promoter Activity of the β4GalT5 Gene during Adipocyte DifferentiationDuring differentiation of 3T3-L1 preadipocytes, the expression levels of the β4GalT5 gene decreased gradually in time-dependent manner (Fig. 5A). By the treatment with Dex, IBMX, and insulin, the expression levels of the β4GalT5 gene decreased to 64% at Day-2, 22% at Day-4, 16% at Day-6, and 15% at Day-8 when compared with those of the β4GalT5 gene in 3T3-L1 preadipocytes at Day-0 (Fig. 5A). To analyze the promoter activity of the β4GalT5 gene during adipocyte differentiation, the mGT5-0.3-sensor cells having the luciferase reporter driven by the β4GalT5 gene promoter were established. By the treatment with Dex, IBMX, and insulin, the promoter activities decreased to 30% at Day-2, 25% at Day-4, 24% at Day-6, and 20% at Day-8 when compared with those of the mGT5-0.3-sensor cells at Day-0 (Fig. 5B). These results indicate that the promoter activity of the β4GalT5 gene decreases during adipocyte differentiation. Taken together, these results indicated that the expression of the β4GalT5 gene decreases upon differentiation of 3T3-L1 preadipocytes to adipocytes, which may lead to decreased amounts of Lac-Cer.
Involvement of the Sp1-Binding Sites in the Promoter Activity of the β4GalT5 GeneIn mammalian glycosyltransferase genes, the GC-rich promoter lacking the TATA and CCAAT boxes were typically found, and the consensus Sp1-binding sites were included in the promoter regions of the glycosyltransferase genes.22) In the previous study, we showed that the expression of the human β4GalT5 gene is regulated by Sp1.22) These findings suggest that the expression of the mouse β4GalT5 gene is also regulated by Sp1. By using the TFBIND program for prediction of the putative binding sites for transcription factors,27) three Sp1-binding sites were found to be located at nucleotide positions −240/−231, −228/−219, and −210/−201 in the core promoter region (Table 1). Upon introduction of the mutations in the Sp1-binding sites, the promoter activities of pGL-Sp1m1 and pGL-Sp1m2 decreased to 50% and 14% of pGL(−299/−1) (Fig. 6). By introducing these mutations in the Sp1-binding sites, the Sp1-binding to the promoter region and promoter activities could be reduced.22) Taken together, these results suggest that Sp1 is involved in the transcriptional regulation of the β4GalT5 gene in 3T3-L1 cells.
Table 1. Consensus Sequences for Sp1-Binding Sites in the Core Promoter Region of the Mouse β4GalT5 Gene
| Consensus core sequence | β4GalT5 sequence (position) |
|---|
| GRGGCRGGGW | ACCCCGCCCC (−240/−231) |
| ACCCCGCCCT (−228/−219) |
| GCCCCGCCCC (−210/−201) |
The positions of the nucleotide are indicated relative to the translational start site of the gene.
Next, we examined the expression levels of the Sp1 gene in 3T3-L1 preadipocytes and adipocytes by quantitative real-time RT-PCR analysis. By the treatment with Dex, IBMX, and insulin, the expression level of the Sp1 gene decreased to 61% at Day-8 when compared with that of the Sp1 gene in 3T3-L1 preadipocytes at Day-8 (Fig. 7A). Moreover, immunoblot analysis with anti-Sp1 antibody demonstrated that the expression of Sp1 also decreases in adipocytes as compared to that in preadipocytes (Fig. 7B). The results indicate that the expression of the Sp1 gene and protein decreases in 3T3-L1 adipocytes (Figs. 7A, 7B), which is similar to the expression of the β4GalT5 gene (Fig. 3B). These results suggest that the expression of the β4GalT5 gene decreases through reduced expression of the Sp1 gene upon differentiation of 3T3-L1 preadipocytes to adipocytes.
DISCUSSION
Dramatic changes in glycosylation have been observed for the development of a variety of diseases such as cardiovascular disorders and diabetes. For instance, in the retina from diabetic rats, the activities of fucosyltransferase and sialyltransferase decreased, suggesting that the altered glycosylation is associated with diabetic retinopathy.28) Tumor necrosis factor-α-induced insulin resistance in 3T3-L1 adipocytes lead to elevated GM3 synthesis.29) On the other hand, the targeted disruption of the gene encoding GM3 synthase, which is Lac-Cer α-2,3-sialyltransferase, in mice showed the protection from high-fat diet-induced insulin resistance.30) The dysregulation of O-linked β-N-acetylglucosamine modification was involved in the causes of cardiovascular disorders and type-2 diabetes.31) Furthermore, the expression of the N-acetylglucosaminyltransferase 4a gene has been shown to decrease in the pancreatic β cells from the mice fed a high-fat diet and the human donors with type 2 diabetes.32) Since these diseases are closely associated with obesity, the glycans, which play important roles in adipocyte differentiation, are also considered to change dramatically upon adipocyte differentiation.
The present study demonstrated that the amounts of Lac-Cer decrease in accordance with the decreased expression of the β4GalT5 gene upon differentiation of 3T3-L1 preadipocytes. Since Lac-Cer plays an important role as a precursor of gangliosides,8) the amounts of gangliosides were also expected to decrease upon differentiation of 3T3-L1 peadipocytes, which was reported by the previous study.7) The analysis of the transcriptional mechanism suggests that the promoter activity of the β4GalT5 gene is regulated by Sp1 in 3T3-L1 cells, and the decreased expression of the β4GalT5 gene is brought about by the reduced gene and protein expression of Sp1 upon adipocyte differentiation. In support of this finding, the expression of Sp1 has been shown to decrease upon differentiation of 3T3-L1 preadipocytes.33) Sp1 belongs to Sp transcription factor family with C2H2-type zinc finger and is involved in the regulation of the housekeeping genes.34) IBMX, which is a cAMP phosphodiesterase inhibitor and one of the differentiation inducers, suppressed the expression of Sp1 by increasing the cellular cAMP level.35) Since the transcription of the Sp1 gene has been shown to be auto-regulated by Sp1,36) the expression of the Sp1 gene and protein decreased synergistically upon differentiation of 3T3-L1 preadipocytes, thereby decreasing the expression of the β4GalT5 gene drastically. As our previous study demonstrated that the transcription of the human β4GalT5 gene is regulated by Sp1,22) the transcription of the mouse β4GalT5 gene has been shown to be also regulated by Sp1, suggesting that the transcription of the β4GalT5 gene is regulated by similar mechanism across species. Besides β4GalT5, the reduced expression of Sp1 may affect another glycosyltransferase genes. If the promoter regions of the glycosyltransferase genes contain the Sp1-binding sites, which regulate the promoter activities positively, the expression of the genes decreases due to reduced expression of Sp1 during adipocyte differentiation.
Lipid rafts are plasma membrane microdomains, in which cholesterol and GSLs are enriched, and signaling molecules and growth factor receptors become concentrated.37) In adipocytes, the binding of insulin to its receptor stimulates Glc uptake by recruiting Glc transporter (GLUT) 4 to cell surface.38) Lipid rafts were shown to be required for the insulin receptor signaling, and the translocation and internalization of GLUT4.39,40) By disrupting the integrity of lipid rafts with cholesterol binding reagent, thereby preventing the signaling, the differentiation of 3T3-L1 preadipocytes was inhibited.41) These studies indicate that lipid rafts play crucial roles in insulin receptor signaling and adipocyte differentiation. On the other hand, obesity shows the deleterious effects on the structures and functions of hippocampus leading to cognitive impairment.42) The analysis of the lipid rafts from hippocampus revealed that significant decreases of insulin receptor and its downstream signaling molecule AKT are observed for obese mice when compared with wild-type mice.43) The findings suggest that the obesity-induced changes in lipid rafts cause the dysfunction of hippocampus in obesity.
In adipocyte differentiation, CCA AT/enhancer-binding protein (C/EBP) family transcription factors and peroxisome proliferation-activated receptor γ play key roles in the regulation of the adipogenic genes.1) Although the activation of mitogen-activated protein kinase (MAPK) signaling was not necessary for 3T3-L1 adipocyte differentiation,44) the phosphorylation of C/EBPβ by MAPK has been shown to be critical for the early stage of adipocyte differentiation.45) Therefore, the suppression of MAPK signaling at early stage is considered to be useful strategy to the regulation of adipocyte differentiation. In fact, the compounds, dioscin and theobromine, both of which are derived from plants, inhibited the differentiation of 3T3-L1 preadipocytes to adipocytes through suppression of the phosphorylation of extracellular-regulated kinase 1/2 (ERK1/2) in MAPK signaling pathway.46,47) On the other hand, Lac-Cer in lipid rafts has been shown to be involved in a variety of transmembrane signals and increase the phosphorylation of ERK proteins in MAPK signaling pathway.48–51) Our previous study showed that the expression of the β4GalT5 gene increases upon malignant transformation of cells,15) and a subsequent study demonstrated that by decreasing the expression of the β4GalT5 gene in B16-F10 mouse melanoma cells, tumorigenic potentials were inhibited through attenuation of MAPK signaling as the results of the decreased expression of Lac-Cer.17) The genetic manipulation of β4GalT5 could affect to the proliferation and differentiation of 3T3-L1 preadipocytes due to changes in the phosphorylation status of MAPK. Quite recently, the gene expression of β-galactoside α2,6-sialyltransferase-1 (ST6Gal1), which is involved in α2,6-sialylation of N-glycans, has been shown to decrease in visceral adipose tissues from obese mice and in 3T3-L1 adipocytes as compared with controls.52) Furthermore, the differentiation of 3T3-L1 preadipocytes to adipocytes was suppressed by regulating the ST6Gal1 gene.52)
In summary, the present study reports novel findings that the expression of the β4GalT5 gene decreases through reduced expression of the Sp1 gene and protein upon differentiation of 3T3-L1 preadipocytes to adipocytes, which may lead to the reduced amounts of Lac-Cer in 3T3-L1 adipocytes. During the process of this study, we established the mGT5-0.3-sensor cells having the luciferase reporter driven by the mouse β4GalT5 gene promoter from 3T3-L1 cells. By using the sensor cells, the compounds that regulate the expression of the β4GalT5 gene can be discovered from compound libraries, which may influence the proliferation and differentiation of 3T3-L1 preadipocytes and may apply to the control of obesity.
Acknowledgments
This work was supported by Presidential Research Grant from Nagaoka University of Technology to TS.
Conflict of Interest
The authors declare no conflict of interest.
REFERENCES
- 1) Gregoire FM, Smas CM, Sul HS. Understanding adipocyte differentiation. Physiol. Rev., 78, 783–809 (1998).
- 2) Jo J, Gavrilova O, Pack S, Jou W, Mullen S, Sumner AE, Cushman SW, Periwal V. Hypertrophy and/or hyperplasia: dynamics of adipose tissue growth. PLoS Comput. Biol., 5, e1000324 (2009).
- 3) Wise LS, Green H. Participation of one isozyme of cytosolic glycerophosphate dehydrogenase in the adipose conversion of 3T3 cells. J. Biol. Chem., 254, 273–275 (1979).
- 4) Spooner PM, Chernick SS, Garrison MM, Scow RO. Development of lipoprotein lipase activity and accumulation of triacylglycerol in differentiating 3T3-L1 adipocytes. J. Biol. Chem., 254, 1305–1311 (1979).
- 5) Hakomori S, Igarashi Y. Functional role of glycosphingolipids in cell recognition and signaling. J. Biochem., 118, 1091–1103 (1995).
- 6) Yamashita T, Wada R, Sasaki T, Deng C, Bierfreund U, Sandhoff K, Proia RL. A vital role for glycosphingolipid synthesis during development and differentiation. Proc. Natl. Acad. Sci. U.S.A., 96, 9142–9147 (1999).
- 7) Reed BC, Moss J, Fishman PH, Lane MD. Loss of choleragen receptors and ganglioside upon differentiation of 3T3-L1 preadipocytes. J. Biol. Chem., 255, 1711–1715 (1980).
- 8) Chatterjee S, Pandey A. The Yin and Yang of lactosylceramide metabolism: implication in cell function. Biochim. Biophys. Acta, 1780, 370–382 (2008).
- 9) Sato T, Furukawa K, Bakker H, van den Eijnden DH, van Die I. Molecular cloning of a human cDNA encoding a β-1,4-galactosyltransferase with 37% identity to mammalian UDP-Gal:GlcNAc β-1,4-galactosyltransferase. Proc. Natl. Acad. Sci. U.S.A., 95, 472–477 (1998).
- 10) Nomura T, Takizawa M, Aoki J, Arai H, Inoue K, Wakisaka E, Yoshizuka N, Imokawa G, Dohmae N, Takio K, Hattori M, Matsuo N. Purification, cDNA cloning, and expression of UDP-Gal: glucosylceramide β-1,4-galactosyltransferase from rat brain. J. Biol. Chem., 273, 13570–13577 (1998).
- 11) Sato T, Guo S, Furukawa K. Involvement of recombinant human β-1,4-galactosyltransferase V in lactosylceramide biosynthesis. Res. Commun. Biochem. Cell Mol. Biol., 4, 3–10 (2000).
- 12) Kumagai T, Sato T, Natsuka S, Kobayashi Y, Zhou D, Shinkai T, Hayakawa S, Furukawa K. Involvement of murine β-1,4-galactosyltransferase V in lactosylceramide biosynthesis. Glycoconj. J., 27, 685–695 (2010).
- 13) Nishie T, Hikimochi Y, Zama K, Fukusumi Y, Ito M, Yokoyama H, Naruse C, Ito M, Asano M. β4-galactosyltransferase-5 is a lactosylceramide synthase essential for mouse extra-embryonic development. Glycobiology, 20, 1311–1322 (2010).
- 14) Nakamura N, Yamakawa N, Sato T, Tojo H, Tachi C, Furukawa K. Differential gene expression of β-1,4-galactosyltransferases I, II and V during mouse brain development. J. Neurochem., 76, 29–38 (2001).
- 15) Shirane K, Sato T, Segawa K, Furukawa K. Involvement of β-1,4-galactosyltransferase V in malignant transformation associated changes in glycosylation. Biochem. Biophys. Res. Commun., 265, 434–438 (1999).
- 16) Sato T, Shirane K, Kido M, Furukawa K. Correlated gene expression between β-1,4-galactosyltransferase V and N-acetylglucosaminyltransferase V in human cancer cell lines. Biochem. Biophys. Res. Commun., 276, 1019–1023 (2000).
- 17) Shirane K, Kuji R, Tareyanagi C, Sato T, Kobayashi Y, Furukawa S, Murata T, Kubota S, Ishikawa Y, Segawa K, Furukawa K. Gene expression levels of β4-galactosyltransferase 5 correlate with the tumorigenic potentials of B16-F10 mouse melanoma cells. Glycobiology, 24, 532–541 (2014).
- 18) Muramoto K, Tange R, Ishii T, Miyauchi K, Sato T. Downregulation of transcription factor Sp1 suppresses malignant properties of A549 human lung cancer cell line with decreased β4-galactosylation of highly branched N-glycans. Biol. Pharm. Bull., 40, 1282–1288 (2017).
- 19) Zhang J, Tang H, Zhang Y, Deng R, Shao L, Liu Y, Li F, Wang X, Zhou L. Identification of suitable reference genes for quantitative RT-PCR during 3T3-L1 adipocyte differentiation. Int. J. Mol. Med., 33, 1209–1218 (2014).
- 20) Sugiyama A, Fukushima N, Sato T. Transcriptional mechanism of the β4-galactosyltransferase 4 gene in SW480 human colon cancer cell line. Biol. Pharm. Bull., 40, 733–737 (2017).
- 21) Sato T, Furukawa K. Sequential action of Ets-1 and Sp1 in the activation of the human β-1,4-galactosyltransferase V gene involved in abnormal glycosylation characteristic of cancer cells. J. Biol. Chem., 282, 27702–27712 (2007).
- 22) Sato T, Furukawa K. Transcriptional regulation of the human β-1,4-galactosyltransferase V gene in cancer cells: essential role of transcription factor Sp1. J. Biol. Chem., 279, 39574–39583 (2004).
- 23) Sato T, Takahashi M, Kawado T, Takayama E, Furukawa K. Effect of staurosporine on N-glycosylation and cell adhesion to fibronectin of SW480 human colorectal adenocarcinoma cells. Eur. J. Pharm. Sci., 25, 221–227 (2005).
- 24) Imagawa M, Tsuchiya T, Nishihara T. Identification of inducible genes at the early stage of adipocyte differentiation of 3T3-L1 cells. Biochem. Biophys. Res. Commun., 254, 299–305 (1999).
- 25) Jiang W, Miyamoto T, Kakizawa T, Sakuma T, Nishio S, Takeda T, Suzuki S, Hashizume K. Expression of thyroid hormone receptor α in 3T3-L1 adipocytes; triiodothyronine increases the expression of lipogenic enzyme and triglyceride accumulation. J. Endocrinol., 182, 295–302 (2004).
- 26) Bernlohr DA, Bolanowski MA, Kelly TJ Jr, Lane MD. Evidence for an increase in transcription of specific mRNAs during differentiation of 3T3-L1 preadipocytes. J. Biol. Chem., 260, 5563–5567 (1985).
- 27) Tsunoda T, Takagi T. Estimating transcription factor bindability on DNA. Bioinformatics, 15, 622–630 (1999).
- 28) Rellier N, Ruggiero-Lopez D, Lecomte M, Lagarde M, Wiernsperger N. In vitro and in vivo alterations of enzymatic glycosylation in diabetes. Life Sci., 64, 1571–1583 (1999).
- 29) Tagami S, Inokuchi J, Kabayama K, Yoshimura H, Kitamura F, Uemura S, Ogawa C, Ishii A, Saito M, Ohtsuka Y, Sakaue S, Igarashi Y. Ganglioside GM3 participates in the pathological conditions of insulin resistance. J. Biol. Chem., 277, 3085–3092 (2002).
- 30) Yamashita T, Hashiramoto A, Haluzik M, Mizukami H, Beck S, Norton A, Kono M, Tsuji S, Daniotti JL, Werth N, Sandhoff R, Sandhoff K, Proia RL. Enhanced insulin sensitivity in mice lacking ganglioside GM3. Proc. Natl. Acad. Sci. U.S.A., 100, 3445–3449 (2003).
- 31) Lefebvre T, Dehennaut V, Guinez C, Olivier S, Drougat L, Mir AM, Mortuaire M, Vercoutter-Edouart AS, Michalski JC. Dysregulation of the nutrient/stress sensor O-GlcNAcylation is involved in the etiology of cardiovascular disorders, type-2 diabetes and Alzheimer’s disease. Biochim. Biophys. Acta, 1800, 67–79 (2010).
- 32) Ohtsubo K, Chen MZ, Olefsky JM, Marth JD. Pathway to diabetes through attenuation of pancreatic β cell glycosylation and glucose transport. Nat. Med., 17, 1067–1075 (2011).
- 33) Cole LK, Vance DE. A role for Sp1 in transcriptional regulation of phosphatidylethanolamine N-methyltransferase in liver and 3T3-L1 adipocytes. J. Biol. Chem., 285, 11880–11891 (2010).
- 34) Beishline K, Azizkhan-Clifford J. Sp1 and the ‘hallmarks of cancer.’ FEBS J., 282, 224–258 (2015).
- 35) Tang QQ, Jiang MS, Lane MD. Repressive effect of Sp1 on the C/EBPα gene promoter: role in adipocyte differentiation. Mol. Cell. Biol., 19, 4855–4865 (1999).
- 36) Nicolás M, Noé V, Jensen KB, Ciudad CJ. Cloning and characterization of the 5′-flanking region of the human transcription factor Sp1 gene. J. Biol. Chem., 276, 22126–22132 (2001).
- 37) Sezgin E, Levental I, Mayor S, Eggeling C. The mystery of membrane organization: composition, regulation and roles of lipid rafts. Nat. Rev. Mol. Cell Biol., 18, 361–374 (2017).
- 38) Summers SA, Yin VP, Whiteman EL, Garza LA, Cho H, Tuttle RL, Birnbaum MJ. Signaling pathways mediating insulin-stimulated glucose transport. Ann. N. Y. Acad. Sci., 892 (1 THE METABOLIC), 169–186 (1999).
- 39) Baumann CA, Ribon V, Kanzaki M, Thurmond DC, Mora S, Shigematsu S, Bickel PE, Pessin JE, Saltiel AR. CAP defines a second signalling pathway required for insulin-stimulated glucose transport. Nature, 407, 202–207 (2000).
- 40) Ros-Baro A, Lopez-Iglesias C, Peiro S, Bellido D, Palacin M, Zorzano A, Camps M. Lipid rafts are required for GLUT4 internalization in adipose cells. Proc. Natl. Acad. Sci. U.S.A., 98, 12050–12055 (2001).
- 41) Huo H, Guo X, Hong S, Jiang M, Liu X, Liao K. Lipid rafts/caveolae are essential for insulin-like growth factor-1 receptor signaling during 3T3-L1 preadipocyte differentiation induction. J. Biol. Chem., 278, 11561–11569 (2003).
- 42) Miller AA, Spencer SJ. Obesity and neuroinflammation: a pathway to cognitive impairment. Brain Behav. Immun., 42, 10–21 (2014).
- 43) Delint-Ramirez I, Maldonado Ruiz R, Torre-Villalvazo I, Fuentes-Mera L, Garza Ocañas L, Tovar A, Camacho A. Genetic obesity alters recruitment of TANK-binding kinase 1 and AKT into hypothalamic lipid rafts domains. Neurochem. Int., 80, 23–32 (2015).
- 44) Font de Mora J, Porras A, Ahn N, Santos E. Mitogen-activated protein kinase activation is not necessary for, but antagonizes, 3T3-L1 adipocytic differentiation. Mol. Cell. Biol., 17, 6068–6075 (1997).
- 45) Tang QQ, Grønborg M, Huang H, Kim JW, Otto TC, Pandey A, Lane MD. Sequential phosphorylation of CCAAT enhancer-binding protein β by MAPK and glycogen synthase kinase 3β is required for adipogenesis. Proc. Natl. Acad. Sci. U.S.A., 102, 9766–9771 (2005).
- 46) Poudel B, Lim SW, Ki HH, Nepali S, Lee YM, Kim DK. Dioscin inhibits adipogenesis through the AMPK/MAPK pathway in 3T3-L1 cells and modulates fat accumulation in obese mice. Int. J. Mol. Med., 34, 1401–1408 (2014).
- 47) Jang YJ, Koo HJ, Sohn EH, Kang SC, Rhee DK, Pyo S. Theobromine inhibits differentiation of 3T3-L1 cells during the early stage of adipogenesis via AMPK and MAPK signaling pathways. Food Funct., 6, 2365–2374 (2015).
- 48) Bhunia AK, Han H, Snowden A, Chatterjee S. Lactosylceramide stimulates Ras-GTP loading, kinases (MEK, Raf), p44 mitogen-activated protein kinase, and c-fos expression in human aortic smooth muscle cells. J. Biol. Chem., 271, 10660–10666 (1996).
- 49) Prinetti A, Iwabuchi K, Hakomori S. Glycosphingolipid-enriched signaling domain in mouse neuroblastoma Neuro2a cells. Mechanism of ganglioside-dependent neuritogenesis. J. Biol. Chem., 274, 20916–20924 (1999).
- 50) Iwabuchi K, Nagaoka I. Lactosylceramide-enriched glycosphingolipid signaling domain mediates superoxide generation from human neutrophils. Blood, 100, 1454–1464 (2002).
- 51) Mu H, Wang X, Wang H, Lin P, Yao Q, Chen C. Lactosylceramide promotes cell migration and proliferation through activation of ERK1/2 in human aortic smooth muscle cells. Am. J. Physiol. Heart Circ. Physiol., 297, H400–H408 (2009).
- 52) Kaburagi T, Kizuka Y, Kitazume S, Taniguchi N. The inhibitory role of α2,6-sialylation in adipogenesis. J. Biol. Chem., 292, 2278–2286 (2017).