Regular Articles
Dexmedetomidine Protects SK-N-SH Nerve Cells from Oxidative Injury by Maintaining Iron Homeostasis
2020 Volume 43 Issue 3 Pages 424-431

Details
2020 Volume 43 Issue 3 Pages 424-431
Ferroptosis is characterized by the accumulation of iron-derived reactive oxygen species (ROS). Ferroptosis causes neuronal death in multiple neurological disorders. Dexmedetomidine (Dex), an extensively used anesthetic, has neuroprotective effects against ROS, but its effect on iron metabolism remains unknown. In this study, SK-N-SH cells were treated with Dex for 24 h before treatment with 100 µM tert-butyl hydroperoxide (t-BHP; an ROS inducer) for 1 h. Afterward, intracellular ROS and labile ferrous iron [Fe(II)] levels were assessed. Dex hindered the increase in cellular ROS and labile Fe(II) levels caused by t-BHP, although Dex alone had no effect on labile Fe(II) level. t-BHP increased the expression of iron importers, transferrin receptor-1 and divalent metal transporter-1, and iron regulatory protein 1 and 2. These effects were abrogated by Dex treatment and SP-1 knockdown. t-BHP increased the phosphorylation of c-Jun N-terminal kinase (JNK) and signal transducer and activator of transcription 4 (STAT4), the primary up-stream activators of SP-1, but Dex decreased this. This study, for the first time, revealed that the antioxidative effect of Dex is partly associated to the inhibition of intracellular iron accumulation induced by t-BHP. Dex regulates iron metabolism by regulating iron importers and exporters through JNK/Sp1 and Stat4/Sp1 signaling. It is worth investigating whether Dex can protect neurons from ferroptosis.
Neuronal cells are easily challenged by oxidative stress in cerebral ischemia/reperfusion injury (e.g. stroke), neurodegenerative disorders, and infective diseases.1–3) Oxidative stress involves excessive production of reactive oxygen species (ROS), which have the capacity to cause cell damages through oxidation and nitration of lipids, proteins, DNA, and RNA, as well as important cellular components. It is well-accepted that excess ROS mediates neuronal dysfunction and death. Ferroptosis is a recently discovered form of programmed cell death that is distinct from apoptosis, necrosis and autophagy. This process is characterized by the accumulation of lipid ROS in an iron-dependent manner. Recent studies have revealed that ferroptosis occurs during multiple neuronal diseases.4,5) For example, ferroptosis has been found as a new form of neuronal cell death after exposure to arsenite.4) In addition, ferroptosis involves the loss of dopaminergic neurons in multiple brain regions in Parkinson’s disease. Thus, inhibition of ferroptosis can protect neurons in cerebral hemorrhage and ischemic stroke.5) All these data indicate that ferroptosis accounts for neuronal death in various pathological conditions.
Iron is essential for the execution of ferroptosis, because using iron chelators to reduce intracellular free iron blocks ferroptosis.6) It has been confirmed that ferrous ion [Fe2+ or Fe(II)] catalyzes the formation of highly ROS, namely the hydroxyl radical (OH·): O2·− + H2O2 → O2 + OH− + OH·. This is the famous Fenton-type reaction. Highly reactive hydroxyl radicals further cause extensive lipid peroxidation in the cell membrane, leading to devastating consequences, such as ferroptosis.7) The brain is particularly vulnerable to lipid peroxidation damage because it is rich in polyunsaturated fatty acids and iron, but relatively poor in antioxidant defenses. Intracellular free iron is controlled by a series of proteins that is responsible for the iron uptake, iron storage, and iron efflux. Transferrin receptor-1 (TfR-1) is responsible for the transferrin-mediated iron uptake in neurons and glia by receptor-mediated endocytosis.8) Finally, iron is released from transferrin and is transported out of the endosome into the cytoplasm by divalent metal transporter-1 (DMT1).8) Fe(II) in the cytoplasm can be converted to Fe3+ by the ferroxidase activity of ferritin H-chain (Ft-H) before storage in the ferritin mineral core (Ft-H and Ft-L). As long as iron is bound to ferritin, cytotoxic reactions are not expected to occur. However, iron can be released from ferritin under various stressful conditions.9) The released iron is theoretically exported from the cytoplasm by ferroportin (Fpn1) in the cell membrane, otherwise excess Fe(II) undergoes Fenton-type reaction, thus inflicting cytotoxic damage.
Dexmedetomidine (Dex), a selective agonist of α2-AR, has been extensively used during or after surgery for its sedative, analgesic, and sympatholytic effects. In addition to these effects, accumulating evidence suggest that Dex confers neuroprotective effects against oxidative injury.10–12) In a rat model of cerebral ischemia–reperfusion, application of Dex reduced the production of oxidative injury, inflammatory response and neuronal cell death. These protective effects of Dex were primarily due to its regulation of signaling molecules, such as nuclear factor-E2-related factor 2 (Nrf-2), nuclear factor-kappaB (NF-κB), extracellular signal-regulated kinase (ERK)1/2, and protein kinase A (PKA) through the activation of α2-AR.10,11) However, it is unclear whether Dex can protect neuronal cells from ferroptosis upon oxidative stress. Given Fe(II) plays critical role in ferroptosis, the study aimed to investigate the effect of Dex on intracellular free iron levels. The result was supposed to provide important clue as to the regulatory effect of Dex on the ferroptosis of neuronal cells.
Nerve cell line, SK-N-SH, was obtained from American Type Culture Collection (ATC C, U.S.A.). The cells were cultured in a Dulbecco’s modified Eagle’s medium (DMEM, high glucose; GIBCO, cat. 10565-018, Life Technologies) at 37°C under 5% CO2. The medium was additionally supplemented with 10% (v/v) fetal bovine serum (Thermo Scientific, MA, U.S.A.) and penicillin (100 units/mL) plus streptomycin (100 µg/mL; cat 10378016, Life Technologies), but 12 h before the treatment, the supplementation with fetal bovine serum was decreased to 3%.
tert-Butyl hydroperoxide (t-BHP) is an inducer of oxidative stress stimuli, which has been added to induce ferroptosis in rat pheochromocytoma-derived PC12 cells that share numerous characteristics with neurons.13) Ferric ammonium citrate (FAC) has been commonly used to construct an iron overload model, and numerous studies have confirmed that iron overload results in excessive generation of ROS in neuron cells.14) In the present study, SK-N-SH cells were treated with 100 µM t-BHP (Sigma-Aldrich Chemical Co., St. Louis, MO, U.S.A.) or 5 mM FAC (Sigma) for 1 h to induce the oxidative stress. Dex (1, 5, and 25 µM) was added to SK-N-SH cells for 24 h incubation. The cells were subsequently treated with t-BHP, FAC or not.
Cell Viability AssayThe cell viability was evaluated using a cell counting kit-8 (CCK-8; Dojindo Molecular Technologies, Inc., Kumamoto, Japan). Cells were seeded in 96-well plates at 1 × 10⁴ cells/well. CCK-8 solution (10 µL) was added to each well followed by a 5–8 h of incubation at 37°C. The optical density was then measured using a microplate reader (ELx800; BioTek Instruments, Inc., Winooski, VT, U.S.A.) at a wavelength of 450 nm.
Measurement of the Labile Iron PoolThe cellular labile iron was measured with a fluorescence technique using the iron sensor calcein (CA). After treatment for 24 h, the cultures were washed three times with phosphate buffer solution (PBS) to remove the extracellular iron and then loaded with 0.25 µmol/L calcein acetomethoxy (CA-AM) (Molecular Probes, Carlsbad, CA, U.S.A.) for 30 min at 37°C in the dark. After loading, the cultures were washed twice with PBS to remove the excess CA-AM, and the cellular CA fluorescence intensity was measured using a PerkinElmer, Inc. microplate reader at an excitation wavelength of 485 nm and an emission wavelength of 535 nm. The changes in the CA fluorescence intensities were equivalent to the amounts of cellular iron that were originally bound to the CA and proportional to the labile iron level.
Measurement of ROS by Flow CytometryTotal ROS in cells was measured by using 2′,7′-dichlorodihydrofluorescein diacetate (H2DCFDA, Cat# D-399, Life Technologies). H2DCFDA (10 µM) was added to the culture medium and incubated for 1 h. H2DCFDA is oxidized by ROS into the highly fluorescent 2′,7′-dichlorofluorescein (DCF), and the produced DCF is proportional to ROS generation. Excess H2DCFDA was removed by washing the cells twice with PBS. Labeled cells were trypsinized and resuspended in PBS plus 5% FBS and then analyzed using a flow cytometer (Fortessa, BD Biosciences, NJ, U.S.A.). A minimum of 10000 cells was analyzed per condition.
RT-Quantitative (q) PCR AnalysisRNA was extracted using TRIzol/chloroform (15596-018, Invitrogen, Carlsbad, CA, U.S.A.) according to the manufacturer’s instructions. cDNA (1 µg) was reverse-transcribed from RNA using a reverse transcription kit (Applied Biosystems, Foster City, CA, U.S.A.) and mixed with the primers (Table 1) and Fast universal master mix (Applied Biosystems). Gene expression was examined by RT-qPCR. Data were analyzed by the comparative 2−ΔΔCt method, with the housekeeping gene glyceraldehyde-3-phosphate dehydrogenase (GAPDH) as an internal control. Results are presented as gene expression relative to control (fold change).
| Name | Sequence (5′–3′) | Tm (°C) | Amplicon size (bp) | |
|---|---|---|---|---|
| TfR1 | Forward | ACCATTGTCATATACCCGGTTCA | 61 | 219 |
| Reverse | CAATAGCCCAAGTAGCCAATCAT | |||
| DMT1 | Forward | TGGAGATCATGGGGAGTCTG | 60 | 193 |
| Reverse | AAGAAAACCTGGTCCGGTGAA | |||
| Fpn1 | Forward | CTACTTGGGGAGATCGGATGT | 60 | 176 |
| Reverse | CTGGGCCACTTTAAGTCTAGC | |||
| IRP1 | Forward | AACCCATTCGCACACCTTG | 60 | 103 |
| Reverse | ATGGTAAGCGCCCATATCTTG | |||
| IRP2 | Forward | TCGATGTATCTAAACTTGGCACC | 61 | 89 |
| Reverse | GCCATCACAATTTCGTACAGCAG | |||
| GAPDH | Forward | GGAGCGAGATCCCTCCAAAAT | 60 | 197 |
| Reverse | GGCTGTTGTCATACTTCTCATGG |
Cell lysates were collected at the indicated times in 1% NP-40 lysis buffer with complete protease inhibitor tablet (Roche, Basel, Switzerland), 1 mM phenylmethanesulfonylfluoride (PMSF), and 2 mM sodium orthovanadate (New England BioLabs, Ipswich, MA, U.S.A.). Protein levels were quantified with a Pierce BCA Kit (Thermo Fisher Scientific) according to the manufacturer’s instructions. Samples were run on 8–10% polyacrylamide gels and transferred onto nitrocellulose membranes (Bio-Rad, Hercules, CA, U.S.A.) blocked in 5% milk in Tris-buffered saline with Tween (TBS-T). The membranes were incubated with antibodies against phosphorylated (p) c-Jun N-terminal kinase (JNK), JNK, p-signal transducer and activator of transcription 4 (Stat4) and Stat4 (Abcam, Cambridge, U.K.) as per the antibody manufacturer’s suggestions. Secondary antibodies were goat anti-rabbit-HRP or anti-mouse-HRP (Bio-Rad). Detection of protein was done with Pierce ECL or Pierce Supersignal Pico (Thermo Fisher Scientific) reagents.
Chromatin Immunoprecipitation (ChIP) AssayChIP assay was performed using Magna ChIP Chromatin Immunoprecipitation Kit according to the manual (Millipore, Billerica, MA, U.S.A.) according to the manufacturer’s instructions. SK-N-SH cells were lysed using a Dounce homogenizer followed by centrifugation. Chromatin was fragmented using enzymatic shearing. A fraction of the mixture of protein-DNA complex was used as “input DNA.” Sheared chromatin (1 µg) was then incubated with anti-Sp1 antibody (ab59257, Abcam) or normal immunoglobulin G (IgG) (ab171870, Abcam) overnight at 4 °C. Immuno-precipitated DNA was eluted using protein G agarose beads, then the cross-linking was reversed and the DNA was purified. Recovered DNA samples were analyzed by PCR.
Statistical AnalysisAll experiments were independently repeated at least three times. All data were analyzed by GraphPad Prism 6.0 (GraphPad Software, La Jolla, CA, U.S.A.). Student’s t-test was performed to compare the means of two groups. One-way ANOVA with post-hoc testing was used for comparisons of three or more groups. p-Values less than 0.05 (p < 0.05) are considered significant.
As indicated by CCK-8 test, 1 and 5 µM Dex increased the viability of SK-N-SH cells (p < 0.05, Fig. 1A), whereas the effect of 25 µM Dex was not significant. t-BHP decreased the viability of SK-N-SH cells (p < 0.01, Fig. 1B), but pretreatment with 1 and 5 µM Dex prevented the reduction in SK-N-SH cell viability (p < 0.05 vs. SK-N-SH group), in a dose-dependent manner.
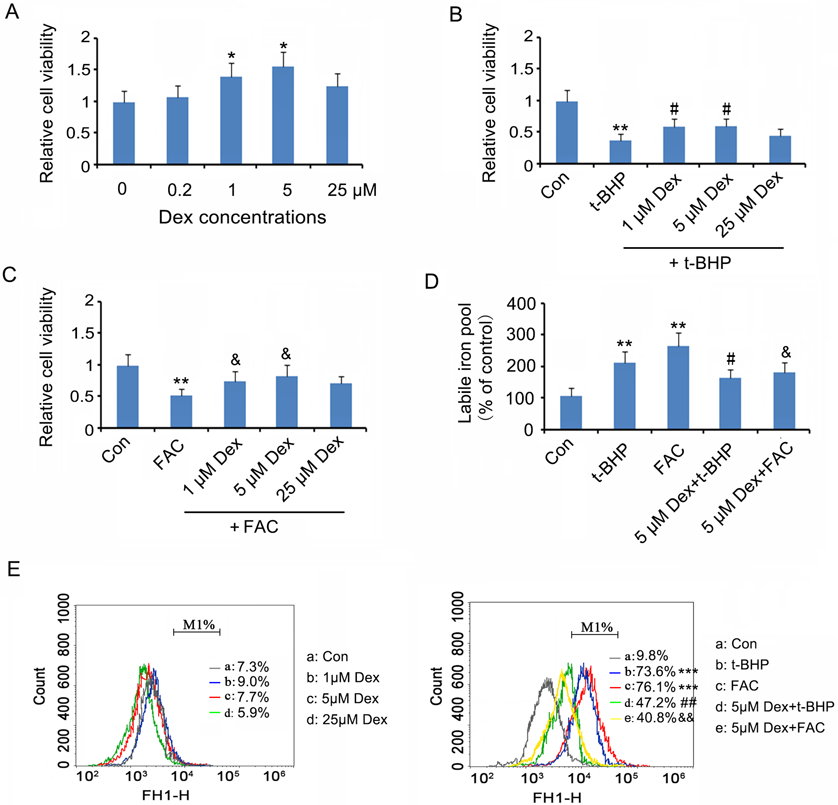
Dex (1, 5, and 25 µM) was added to SK-N-SH cells for 24 h incubation. The cells were subsequently treated with t-BHP, FAC or not. (A) Cell viability was tested 24h after the Dex treatments using CCK-8 kit. (B) and (C) Cell viability was tested after treatment with t-BHP and FAC, respectively. (D) Liable iron levels in cells were evaluated after the above-mentioned treatments. (E) Total ROS in cells was measured using H2DCFDA probe with analysis of a flow cytometer. * p < 0.05, ** p < 0.01, and *** p < 0.001 vs. control group; #p < 0.05, ##p < 0.01 vs. t-BHP group; &p < 0.05, &&p < 0.01 vs. FAC group. Con: control. (Color figure can be accessed in the online version.)
To determine whether the antioxidative protection due to Dex is related to the regulation of iron metabolism, the effect of Dex treatment on FAC-induced oxidative stress was evaluated. This study showed that FAC attenuated the viability of SK-N-SH cells (p < 0.01, Fig. 1C), but pretreatment with 1 and 5 µM Dex prevented the reduction in SK-N-SH cell viability.
This study further evaluated the change of labile Fe(II) level in SK-N-SH cells following treatment with Dex alone or in combination with t-BHP or FAC. Labile Fe(II) level in SK-N-SH cells was not changed after treatment with Dex at dosages of 1, 5, and 25 µM Dex (data not shown). Both t-BHP and FAC remarkably increased labile Fe(II) level in SK-N-SH cells (p < 0.01, Fig. 1D). However, the increased labile Fe(II) levels in SK-N-SH cells caused by both t-BHP and FAC (p < 0.05) were inhibited by 5 µM Dex (p < 0.05 vs. t-BHP and FAC groups).
As demonstrated by Fig. 1E, ROS in SK-N-SH cells was not altered by Dex at dosages of 1, 5, and 25 µM Dex. Both t-BHP and FAC remarkably increased ROS in SK-N-SH cells (p < 0.001), which were disrupted with 5 µM Dex treatment (p < 0.01 vs. t-BHP and FAC groups).
Pre-treatment with Dex Hindered the Increase in TfR1, DMT1, Iron Regulatory Protein 1 (IRP1) and IRP2 Levels Caused by t-BHP in SK-N-SH CellsTo understand how Dex regulated intracellular free iron level, we investigated the effects of Dex on the expression of some proteins that modulate iron levels. As indicated by the PCR assay, treatment with Dex alone decreased mRNA levels of TfR1 (p < 0.05, Fig. 2), DMT1 (p < 0.05), Fpn1 (p < 0.05), IRP1 (p < 0.01) and IRP2 (p < 0.05). In contrast, t-BHP treatment increased TfR1 (p < 0.05), DMT1 (p < 0.01), IRP1 (p < 0.01) and IRP2 (p < 0.05), but not Fpn1. Pre-treatment with Dex hindered the increase in TfR1 (p < 0.05 vs. t-BHP group), DMT1 (p < 0.01 vs. t-BHP group), IRP1 (p < 0.01 vs. t-BHP group) and IRP2 (p < 0.05 vs. t-BHP group) caused by t-BHP. Fpn1 mRNA level was not changed by treatment with Dex and t-BHP in combination.

SK-N-SH cells were treated with Dex and t-BHP, alone or in combination. mRNA levels of TfR1, DMT1, Fpn1, IRP1 and IRP2 were assessed using PCR assay. * p < 0.05 and ** p < 0.01 vs. control group; #p < 0.05 and ##p < 0.01 vs. t-BHP group.
Bioinformatics analysis using Jasper (jaspardev.genereg) and Promo (http://alggen.lsi.upc.es/cgi-bin/promo_v3/promo/promoinit.cgi?dirDB=TF_8.3) revealed that the transcriptional factor SP-1 is likely an important regulator of IRP1, IRP2 and Fpn1 genes, as SP-1 achieved very high scores during the analysis. Figure 3A shows SP-1 binding motif and many potential binding sites of SP-1 in the promoter regions of IRP1, IRP2, and Fpn1 genes. This prediction was further identified by ChIP assay (Fig. 3B). In the assay, SP-1 antibody was used to obtain SP-1 protein-DNA complex. PCR identified the promoter sequences of IRP1, IRP2, and Fpn1 genes in the protein-DNA complex. Transfection of small interfering RNA (siRNA)-SP-1 down-regulated SP-1 mRNA expression in SK-N-SH cells (p < 0.01, Fig. 3C). Knockdown of SP-1 caused the reduction of IRP1 (p < 0.01), IRP2 (p < 0.05), Fpn1 (p < 0.05), TfR1 (p < 0.05), and DMT1 (p < 0.01) gene expression levels (Fig. 3D). In addition, SP-1 knockdown abrogated T-BHP-induced increase in IRP1 (p < 0.01 vs. t-BHP group), IRP2 (p < 0.05 vs. t-BHP group), TfR1 (p < 0.05 vs. t-BHP group), and DMT1 (p < 0.01 vs. t-BHP group) gene expression levels.
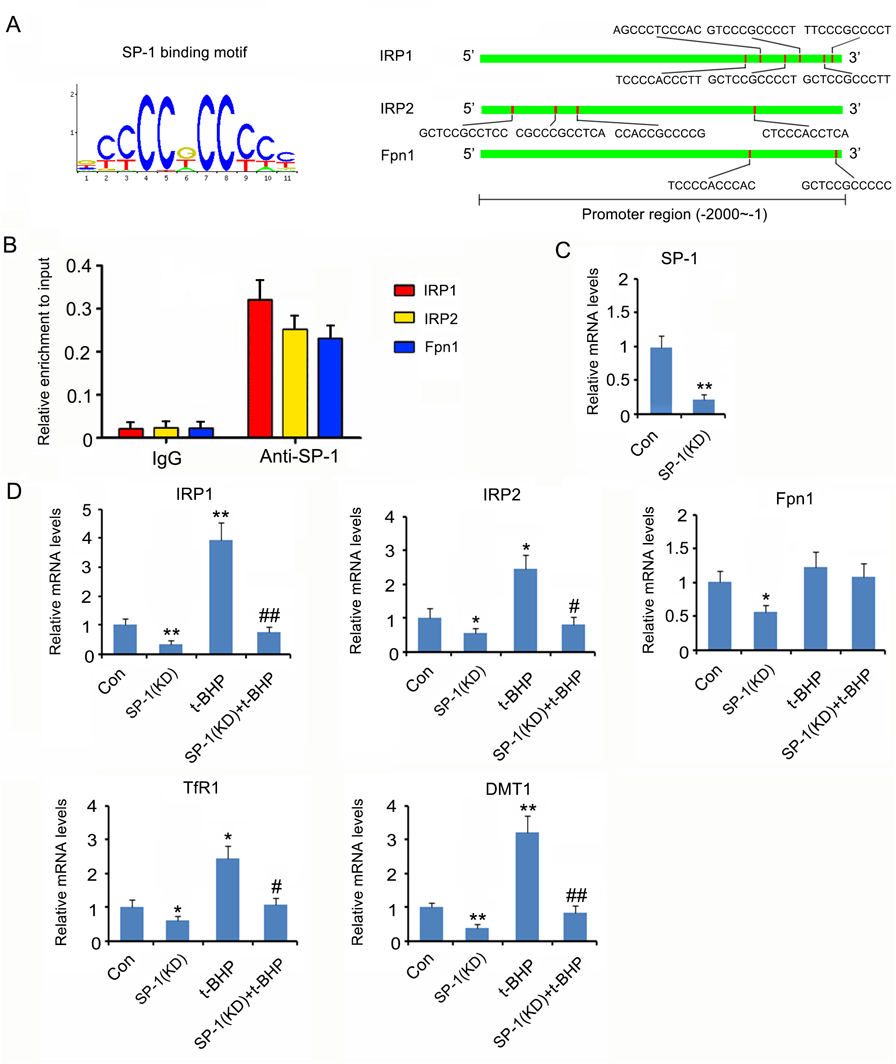
Bioinformatics analysis using Jasper (jaspardev.genereg) and Promo (http://alggen.lsi.upc.es/cgi-bin/promo_v3/promo/promoinit.cgi?dirDB = TF_8.3) revealed that the transcriptional factor SP-1 is likely an important regulator of IRP1, IRP2 and Fpn1 genes. The left panel of Fig. 3A showed SP-1 binding motif. The right panel of Fig. 3A showed many potential binding sites of SP-1 in the promoter regions of IRP1, IRP2, and Fpn1 genes. (B) ChIP assay was performed to identify the binding of SP-1 to the promoter regions of IRP1, IRP2, and Fpn1 genes. (C) Transfection of siRNA-SP-1 downregulated SP-1 mRNA expression in SK-N-SH cells. (D) SP-1 was knocked down in SK-N-SH cells before t-BHP treatment. mRNA levels of TfR1, DMT1, Fpn1, IRP1 and IRP2 were assessed using PCR assay. * p < 0.05 and ** p < 0.01 vs. control group; #p < 0.05 and ##p < 0.01 vs. t-BHP group. (Color figure can be accessed in the online version.)
To understand the effects of Dex and t-BHP on the function of SP-1, JNK and STAT4, SP-1 up-stream regulators, were evaluated. Treatment with t-BHP increased phosphorylation levels of both JNK and STAT4 (p < 0.05, Fig. 4), but not the protein levels. Dex conversely decreased phosphorylation levels of both JNK and STAT4 (p < 0.05). Moreover, pretreatment with Dex hindered the increase in JNK and STAT4 phosphorylation levels caused by t-BHP.

SK-N-SH cells were treated with Dex and t-BHP, alone or in combination. Protein levels of JNK, p-JNK, p-STAT4and STAT4 were assessed using Western blot assay. * p < 0.05 and ** p < 0.01 vs. control group; #p < 0.05 and ##p < 0.01 vs. t-BHP group.
Dysregulation of iron metabolism has been well-documented in stroke and multiple neurodegenerative diseases. Fe(II) functions as a pivotal contributor to ROS-induced injury, such as mitochondrial dysfunction and ferroptosis.7) Although neuroprotective effect of Dex against ROS has been extensively reported in various in vitro and in vivo studies, the underlying protective mechanism is not completely understood. Additionally, Dex does not possess any direct anti-oxidative property, hence the anti-oxidative protection is more likely related to the molecule-regulatory effects of Dex. The present study revealed that the antioxidative effect of Dex is related to its regulatory effect on iron metabolism. FAC leads to oxidative stress through induction of cellular iron overloading and subsequently promoting Fe(II)-mediated oxidizing reaction.14) Dex prevented the accumulation of Fe(II) and ROS in the cells caused by FAC, consequently restoring the cell viability. In a recent study, Hu et al. treated SK-N-SH cells with FeCl2 to induce intracellular iron overload. FeCl2 treatment also attenuated cell viability and triggered apoptosis. However, Dex treatment protected SK-N-SH cells from FeCl2-induced toxic effects partly by suppressing NF-κB pathway.15) Suppression of NF-κB reduced pro-inflammatory cytokine expression caused by FeCl2. t-BHP directly releases ROS into cells, thus it can work as an oxidative stress stimulus. Treatment with Dex prior to t-BHP lowered the Fe(II) level in neuronal cells, which was correlated with decreased cellular ROS and improved cell viability compared to t-BHP treatment alone. This suggested that decreasing intracellular Fe(II) is able to disrupt the generation of oxidative stress and attenuate the oxidative damage. This concept is supported by the fact that various iron chelating agents depleted intracellular free Fe(II) concentration and yielded promising clinical outcome in the protection of neuron cells from oxidative injury.16,17)
Iron uptake is controlled by two major iron importers, TfR1 and DMT1. Upregulation of DMT1 expression has been observed in age-associated Parkinson’s and Alzheimer’s rat models.18) The age-dependent increase in DMT1 expression is partly associated with increased brain iron. Both TfR1 and DMT1 expression levels are increased in neurons in response to hypoxia and pro-inflammatory cytokines, such as interleukin-1 beta (IL-1β) and tumor necrosis factor alpha (TNF-α), thereby leading to increased Fe(II) influx.19,20) The present study showed that t-BHP also increased the expression of TfR1 and DMT1, resulting in the accumulation of intracellular Fe(II). This suggested that t-BHP not only released ROS but also increased Fe(II) content to enhance ROS-mediated oxidative damage. A previous study confirmed that treatment with t-BHP alone induces ferroptosis of neurons, which is probably associated with promoting intracellular content of labile Fe(II).13) This study showed that pretreatment with Dex hindered the increase in TfR1 and DMT1 protein levels and Fe(II) content caused by t-BHP. The inhibitory effect of Dex on TfR1 and DMT1 expression has been proposed to confer strong protection against oxidative stress in various neurological diseases. Interestingly, herein, treatment with Dex alone did not impact intracellular Fe(II) despite the reduction of TfR1 and DMT1. This is likely associated with the Dex-induced down-regulation of iron exporter Fpn1, the only known mammalian iron exporter. This indicates that Dex likely blocks iron efflux by decreasing Fpn1, while inhibiting its influx by decreasing TfR1 and DMT1, thereby maintaining the iron homeostasis.
Iron homeostasis is primarily regulated by the iron regulatory proteins (IRPs)-iron response element (IRE) system. IRP1 and IRP2 are two important IRPs, which interact with IRE either within the 3′-UTR (untranslated region) or 5′-UTR regions of a specific mRNA, because the former and the latter regulate mRNA stability and translation, respectively.21–23) IRPs act as inhibitors of ferritin and Fpn1 transcripts by binding IRE in their 5′-UTRs but as enhancers of TfR and DMT1 transcripts by binding IRPs in their 3′-UTRs.21–23) IRP1 RNA binding activity is regulated by cellular iron levels. The elevation of iron in cells decreases IRP1 RNA binding activity, thereby increasing ferritin and Fpn expression levels but decreasing TfR and DMT1 expression levels. The outcome is the reduction of free iron in cells because the binding and export of iron by ferritin and Fpn1, respectively, are strengthened as well as the import of iron by TfR and DMT1 is inhibited. However, the present study revealed that t-BHP treatment increased the levels of IRP1 and IRP2. This could increase the function of IRP1 and IRP2, resulting in increased TfR and DMT1 and decreased Fpn1 and ferritin. PCR analysis in this study showed that t-BHP treatment indeed resulted in an increase in TfR and DMT1 levels. Pre-treatment with Dex disrupted the increase in IRP1 and IRP2 protein levels, with the restoration of TfR and DMT1 levels. Therefore, the effect of Dex on reduction of intracellular iron level is partly through the prevention of t-BHP-induced increase in IRP1 and IRP2 expression levels.
This study found that the transcriptional factor Sp1 is involved in the expression of IRP1, IRP2 and Fpn1. Sp1 knockdown decreased IRP1, IRP2 and Fpn1 mRNA levels and abolished the positive effect of t-BHP on IRP1 and IRP2 expression levels. This interesting phenomenon suggests that Fpn1 mRNA level is probably pre-transcriptionally regulated by Sp1 and also post-transcriptionally regulated by Sp1 through IRP1 and IRP2. Sp1 knockdown inhibited the transcription of Fpn1, thereby reducing Fpn1 level. Although t-BHP enhanced Sp1 function by JNK and Stat4 signals, it had no effect on Fpn1 mRNA level, which might be because Sp1 increased the transcription of Fpn1, meanwhile increasing the transcription of IRP1 and IRP2 that can induce the rapid degradation of Fpn1.
Dex and t-BHP respectively showed inhibitory and promoting effects on JNK/Sp1 and Stat4/Sp1 signals. Previous studies demonstrated that the anti-inflammatory effect of Dex is also associated with the inhibition of JNK and Stat4 signals.24–26) JNK and Stat4 signals are easily activated by ROS. Given that t-BHP is a potent inducer of ROS generation, the promoting effects of t-BHP on JNK and Stat4 signals are likely partly through ROS generation. Dex is a classic agonist of the α2 adrenergic receptor, but it can also induce activation of imidazoline receptors. Both α2 adrenergic and imidazoline receptors were involved in the modulation of JNK signaling. BRL44408 is an α2A-AR antagonist, which suppressed JNK activation in septic rats.27) Stimulation of I1-imidazoline receptor by moxonidine increased JNK activation in PC12 pheochromocytoma cells.28) However, rilmenidine, a selective imidazoline I1 receptor agonist, suppresses proliferation and promotes apoptosis of human leukemic K562 cells partly through deactivation of JNK pathway.29) These evidence suggest that the regulatory effect on JNK pathway is condition-dependant. Further study was warranted to elucidate how Dex affects JNK and Stat4 pathways by α2 adrenergic and imidazoline receptors.
In summary, this study, for the first time, revealed that the antioxidative effect of Dex is partly related to the inhibition of intracellular iron accumulation induced by t-BHP. The regulatory effect of Dex on iron metabolism is linked to the regulation of iron importer and exporter through its effect on JNK/Sp1 and Stat4/Sp1 signaling, as shown in Fig. 5.

Dex and t-BHP respectively exert inhibitory and promoting effects on JNK/Sp1 and Stat4/Sp1 signals. The transcriptional factor Sp1 is involved in the expression of IRP1, IRP2 and Fpn1. IRP1/2 acts as inhibitors of Fpn1 but as enhancers of TfR and DMT1 transcripts by regulating the IRE in their mRNA. TfR and DMT1 are responsible for the import of iron, while Fpn1 functions as the exporter of iron. The accumulation of iron contributes to the generation of ROS. (Color figure can be accessed in the online version.)
The authors declare no conflict of interest.