Abstract
The epithelial–mesenchymal transition (EMT) is a phenomenon, in which epithelial cells acquire a mesenchymal cell phenotype. It is important during wound healing; however, chronic inflammation leads to excessive EMT and causes tissue barrier dysfunction with hyperplasia. EMT is induced by several cytokines, such as interleukin (IL)-4 and IL-13. Additionally, IL-4 and IL-13 are known to increase in atopic dermatitis (AD) characterized by intense itching and eczema. Therefore, we assumed that there was commonality between the respective EMT and AD phenotypes. Herein, we evaluated EMT marker expression in AD skin and demonstrated that EMT-maker Snai1 and Twist expression were increased in AD mice model and patients with AD. Moreover, the epithelial-marker keratin 5 and mesenchymal marker Vimentin were co-expressed in the skin epidermis of mice with AD, suggesting the existence of hybrid epithelial–mesenchymal (E/M) cells possessing both epithelial and mesenchymal characteristics. In fact, we found that ΔNp63a, a stabilizing factor for hybrid E/M cells, was upregulated in the skin epidermis of the AD model mouse. Interestingly, increased expression of EMT markers was observed even at a nonlesion site in a patient with AD without initial inflammation or scratching. Therefore, EMT-like phenomena may occur independently of wound healing in skin of patients with AD.
INTRODUCTION
The epithelial–mesenchymal transition (EMT) is a phenomenon in which epithelial cells acquire a mesenchymal cell phenotype and it is an important process in wound healing.1,2) During the EMT process, epithelial cells express EMT markers, Snai1 and Twist.3) EMT marker-expressing epithelial cells repress the expression of epithelium-associated proteins, such as tight-junction proteins and E-cadherin, and they acquire mesenchymal features, such as migration, collagen fiber production, and proliferation.4,5) Subsequently, epithelial cells that transform into mesenchymal cells can repair injured tissue; however, chronic inflammation results in excessive EMT, which causes tissue barrier dysfunction with hyperplasia.1) EMT that occurs during chronic inflammation is induced by various cytokines; in particular, interleukin (IL)-4 and IL-13, which belong to the T-helper 2 (Th2)-type anti-inflammatory cytokines that are increased in Th2-type allergic inflammatory disease, induce EMT.6,7)
Atopic dermatitis (AD) is a Th2-type allergy dermatitis, which is hallmarked by intensely itchy skin eczema, skin barrier collapse, and increased IL-4 and IL-13 expression in the acute and chronic phases.8–13) AD phenotypes include decreased expression of tight-junction proteins and E-cadherin, skin barrier dysfunction with hyperplasia, and fibrosis.14–18) We found similarities between the characteristics of AD and EMT; however, there are no reports of this association in AD.
In this study, we determined the expression levels of the EMT markers, Twist and Snai1, in AD model mice and patients with AD. We used the AD mice model as mite antigen-treated NC/Nga mice, which are known to exhibit elevated IL-4 and IL-13 levels.19) In EMT-induced epithelial cells, the expression of EMT markers and mesenchymal marker Vimentin increases; whereas, the expression of an epithelial marker, keratin decreases.20,21) However, in skin of patients with AD, in addition to the expression of Twist and Snai1, the epithelial cell marker Keratin 5 (K5) and mesenchymal cell marker Vimentin were co-expressed, suggesting the existence of hybrid epithelial–mesenchymal (E/M) cells with both epithelial and mesenchymal cell phenotypes. In addition, the expression of EMT markers was observed at nonlesion sites in patients with AD without initial inflammation or scratching. Therefore, an EMT-like phenomena unrelated to wound healing may occur in AD.
MATERIALS AND METHODS
ReagentsThe mouse thymus and activation-regulated chemokine (TARC) enzyme-linked immunosorbent assay (ELISA) kit and mouse immunoglobulin E (IgE) ELISA kit were purchased from R&D Systems, Inc. (Minneapolis, MN, U.S.A.) and FUJIFILM Wako Pure Chemical Corporation (Osaka, Japan), respectively. An extract of the Dermatophagoides farina body was used as a mite antigen and purchased from Biostir Inc. (Osaka, Japan). Other reagents were purchased from FUJIFILM Wako Pure Chemical Corporation and NACALAI TESQUE, Inc. (Kyoto, Japan).
PatientsSkin biopsies were obtained from lesions and nonlesions of the skin of adult patients with AD (two males, two females; age: 19–46 years, median age: 33 years) diagnosed according to the criteria of Hanifin and Rajka22) as well as three healthy volunteers. A dermatologist determined the lesion and nonlesion areas and performed the biopsy. The evaluation of lesion and nonlesion in skin of patient with AD were determined by the dermatologist based on the presence or absence of AD symptoms, such as itching, pruritus, edema, erythema, and crusting. Skin biopsies were fixed in Mildform® 10NM (FUJIFILM Wako Pure Chemical Corporation) for immunohistochemistry. The use of human skin samples for research purposes was approved by the Asai Dermatology Institutional Review Board (clinical approval number; Ex 707). Informed consent was obtained from all individual participants included in the study.
AnimalsNC mice (9-week-old males) were purchased from The Jackson Laboratory Japan, Inc. (Kanagawa, Japan). The mice were acclimated to a conventional area of the Innovation Center of NanoMedicine (iCONM) animal room and maintained with a standard mouse/rat chow diet and a 12-h light/12-h dark cycle for 1 week. All experiments were conducted according to the institutional ethical guidelines for animal experiments and safety guidelines for gene manipulation experiments of iCONM. All animal experimental procedures were approved by the Animal Experiment Committee at iCONM, Kawasaki Institute of Industrial Promotion (Animal Studies Approval Number: A22-0040-2).
Induction of AD Skin Lesions in NC MiceAD induction in NC mice was performed based on the method of Yamamoto et al.23) Mice were anesthetized with isoflurane and their dorsal back hair was shaved. Sodium dodecyl sulfate (SDS, 4% (w/v)) was applied to the shaved dorsal skin and ear, followed by 100 mg of mite antigen. SDS solution and 100 mg mite antigen were applied to the mouse once per day, twice per week for 1, 2, and 3 weeks, and the untreated mouse group was used as a control. The skin of mice was collected at 7, 14, and 21 d, respectively.
Under anesthesia, the mice were photographed with a digital camera, transepidermal water loss (TEWL) was measured using a TEWA meter (Courage + Khazaka Electronic GmbH, Cologne, Germany), and blood was collected. After euthanasia by cervical dislocation, the mouse skin was collected for histology, immunohistochemistry, and protein extraction.
Evaluation of Skin LesionDermatitis severity was scored according to the method of Yamamoto et al.23) Four parameters, 1) erythema/hemorrhage, 2) scarring/dryness, 3) edema, and 4) excoriation/erosion, were scored at four levels: 0 (none), 1 (mild), 2 (moderate), and 3 (severe). The sum of the individual scores was considered the dermatitis score.
Hematoxylin and Eosin StainTissues were fixed in Mildform® 10NM overnight at room temperature, embedded in paraffin, and sectioned at 5 µm. Paraffin-embedded tissue sections were stained with hematoxylin and eosin after deparaffinization. Images were captured using a Keyence BZ-X710 All-in-One Fluorescence Microscope (KEYENCE CORPORATION, Osaka, Japan).
ImmunohistochemistryParaffin tissue sections were deparaffinization and autoclaved at 120 °C for 10 min in Tris–ethylenediaminetetraacetic acid (EDTA) buffer (pH 9.0) or 0.1 M citrate buffer (pH 6.0). The sections were stained using anti-vimentin antibody (dilution ratio 1 : 250; Cell Signaling Technology, Danvers, MA, U.S.A.), anti-Snai1 antibody (dilution ratio 1 : 100; Santa Cruz Biotechnology), anti-Twist antibody (dilution ratio 1 : 50; Abcam, Cambridge, U.K.), anti-E-cadherin antibody (dilution ratio 1 : 250; Merck KGaA, Darmstadt, Germany), anti-filaggrin antibody (dilution ratio 1 : 250; Biolegend, San Diego, CA, U.S.A.), anti-cytokeratin 5 antibody (dilution ratio 1 : 250; OriGene Technologies, Inc., Rockville, MD, U.S.A.), anti-filaggrin antibody (dilution ratio 1 : 500; Biolegend), anti-OVOL1 antibody (dilution ratio 1 : 250; Thermo Fisher Scientific, Waltham, MA, U.S.A.), anti ΔNp63α antibody (dilution ratio 1 : 250; OriGene Technologies, Inc.), or anti-GRHL2 antibody (dilution ratio 1 : 250; Abcam) at 4 °C overnight. For visualization, the sections were incubated with Alexa 488 anti-guinea pig antibody (Thermo Fisher Scientific, Waltham, MA, U.S.A.), Alexa 594 anti-mouse antibody, or Dylight 564 anti-rabbit antibody (RayBiotech, Peachtree Corners, GA, U.S.A.) for 1 h at room temperature and embedded with mounting medium supplemented with 4′-6-diamidino-2-phenylindole (DAPI) (Vector Laboratories, Inc., Mowry Ave Newark, CA, U.S.A.). Images were acquired with a Keyence BZ-X710 All-in-One Fluorescence Microscope (KEYENCE CORPORATION). The percentage of EMT-marker-positive cells was calculated by counting them in the K5-positive layer. The quantification of epithelial markers was achieved by measuring the fluorescence intensity of the skin epidermis and correcting it for the area of the epidermis.
Quantitative Real-Time PCRTotal RNA was isolated from the mouse skin using a FastGene™ RNA Premium Kit (NIPPON Genetics, Co., Ltd., Tokyo, Japan), followed by reverse transcription using the FastGene™ ScriptaseII cDNA Synthesis 5× ReadyMix (NIPPON Genetics). Quantitative PCR was performed using Taqman probes (Thermo Fisher Scientific) on a StepOnePlus™ real-time PCR System (Applied Biosystems, Waltham, MA, U.S.A.). The Taqman probes used were as follows: Il4 (Mm00445259_m1), Il13 (Mm00434204_m1; Thermo Fisher Scientific), and GAPDH (Mm99999915_g1; Thermo Fisher Scientific). The expression levels of the target genes were calculated via normalization to the expression of the GAPDH gene, followed by application of the comparative cycle threshold Ct method (2−ΔΔCt).
Western Blot AnalysisMouse skin was incubated with 2 N sodium bromide solution at 37 °C for 2 h followed by separation into the epidermis and dermis. The skin epidermis was solubilized in lysis buffer [1% NP-40, 20 mM Tris–HCl (pH 7.4), 0.15 M NaCl, 1 mM EDTA, phosphatase inhibitor cocktail (Merck KGaA), and protein inhibitor cocktail (Merck KGaA)]. The protein concentration of the lysate was determined using the protein assay BCA kit (Nacalai Tesque). Lysate samples containing 4 µg of protein were separated by sodium dodecyl sulfate polyacrylamide gel electrophoresis (SDS-PAGE) and transferred to a polyvinylidene fluoride membrane (Merck KGaA). The membranes were blocked in Blocking one (Nakalai Tesque) and incubated first with anti-vimentin antibody (dilution ratio 1 : 5000), anti-Snai1 antibody (dilution ratio 1 : 1500; GeneTex), anti-Twist antibody (dilution ratio 1 : 500) or anti-E-cadherin antibody (dilution ratio 1 : 5000; Cell Signaling Technology) at 4 °C overnight, followed by incubation with horseradish peroxidase-conjugated secondary anti-rabbit (dilution ratio 1 : 10000; Abcam) or mouse immunoglobulin G (dilution ratio 1 : 10000; Cell Signaling Technology) antibody at room temperature for 1 h. Signals were detected by Chemi-Lumi One super (Nacalai Tesque) or Chemi-Lumi One ultra (Nacalai Tesque).
Determination of Plasma IgE and Plasma TARCMouse blood was incubated with heparin, centrifuged for 10 min at 4 °C, and the supernatant was collected and used as plasma. The IgE and TARC in mouse plasma were detected using a mouse TARC ELISA kit and mouse IgE ELISA kit, respectively.
Statistical AnalysisData were expressed as the mean ± standard deviation (S.D.). The statistical significance of differences between multiple groups was evaluated using ANOVA, followed by the Tukey–Kramer test for multiple comparisons. Comparisons between the two groups were evaluated using a paired t-test. Correlation coefficients were calculated using Pearson’s correlation test. The p value of the correlation coefficients was determined using the test of no correlation. A p-value <0.05 was considered statistically significant.
RESULTS
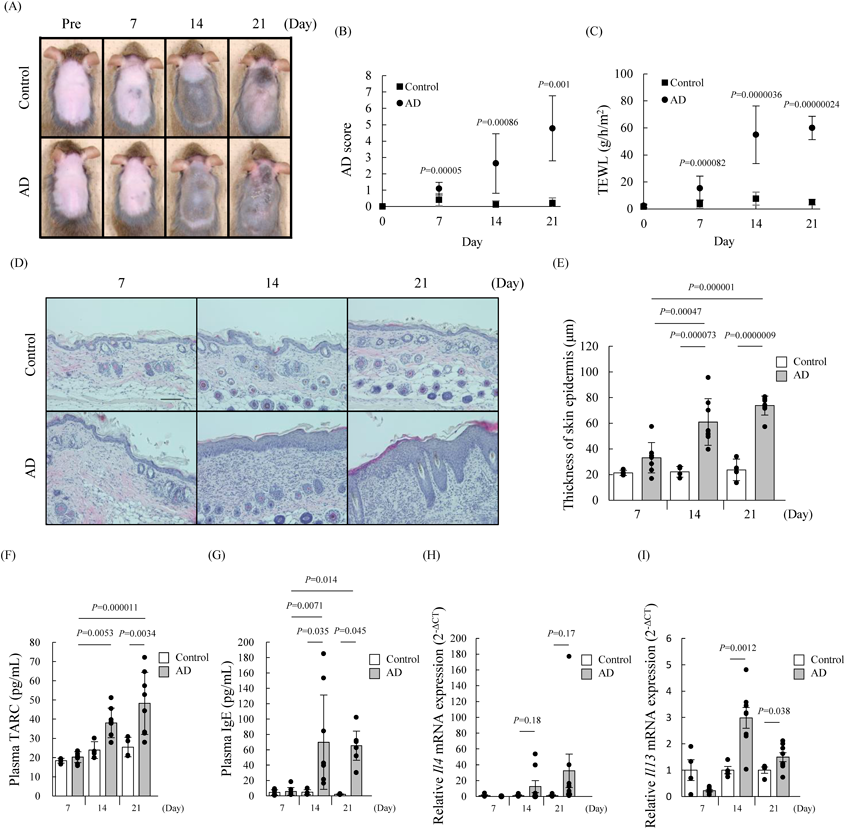
Promotion of Cytokine IL-4 and IL-13 Production in AD Mouse ModelPatients with AD are characterized by a phenotype that includes epidermal hyperplasia, elevated skin barrier function index TEWL, and increased plasma TARC, and IgE levels.24–26) We first confirmed whether these phenotypes of AD symptoms alter in AD mice. These AD phenotypes were significantly increased in the AD mice at 14 and 21 d, but not at 7 d, compared with control mice (Figs. 1A–G). These phenotypes in AD mice showed a tendency to worsen depending on the duration of antigen application. Additionally, we analyzed the levels of EMT-inducing cytokines IL-4 and IL-13 in skin of AD mice by using real-time PCR. Consequently, IL-4 and IL-13 increased in AD mice at 14 and 21 d after treatment of mite-antigen compared with control mice (Figs. 1H, I). Therefore, this mouse was used as a model for subsequent studies.
Expression of EMT Markers in the Skin Epidermis of an AD Mouse ModelDownregulation of E-cadherin is an indicator of EMT.4) Thus, to investigate whether the expression of E-cadherin is reduced in the epidermal skin of AD mice model, we compared it with that of E-cadherin in severely conditioned AD and control mice on day 21 of mite-antigen treatment using an immunoblot assay and immunochemistry. Consequently, the expression of E-cadherin was significantly decreased in skin epidermal lesions of AD mice (Fig. 2). This result indicated that there may be a relationship between EMT and AD. Therefore, to investigate whether EMT occurs in AD mice model, we performed an immunoblot assay in this study for comparing the expression levels of other EMT markers Twist, Vimentin, and Snai1 in the skin epidermis of AD and control mice at 7, 14, and 21 d. Immunoblot analysis data showed 1.1, 2.8 and 3.8-fold increases in Twist; 4.1, 3.2 and 2.6-fold increases in Snai1; and 1.7, 3.8 and 2.1-fold increases in Vimentin in AD mice at 7, 14, and 21 d, respectively, compared with control mice (Figs. 3A–C). The expression levels of Twist, Snai1, and Vimentin tended to depend on the number of applications of mite antigen (Figs. 3A–C). Furthermore, the increased expression of Vimentin, Twist, and Snai1 in the skin epidermis of AD mice corresponded to the results of immunohistochemistry (Figs. 3D–U). The expression of Snai1 and Twist in mice was highly correlated with AD score, plasma IgE levels, epidermal thickness, and TEWL, respectively (Supplementary Fig. 1).
The expression level of Snai1 is inversely correlated to that of OVOL.27) Additionally, OVOL1 is known as one of the transcription factors that regulate the expression of filaggrin (FLG), a skin barrier constituent protein.28) When the expression of OVOL1 and FLG were observed in AD mouse model skin by immunohistochemistry, we clarified decreased expression of OVOL1 and FLG in Snai1-expressed epidermis skin in AD mouse (Fig. 4).
These results indicate that EMT is induced in the skin epidermis of AD mice and is related to AD symptoms.
Expression of Phenotype Stability Factors in the Skin of AD MiceSeveral studies involving EMT have suggested that it is a multi-state process that leads to a pure mesenchymal phenotype from a pure epithelial phenotype through an intermediate phenotype.29–33) These EMT intermediate phenotype cells are known as hybrid epithelial–mesenchymal (E/M) cells and exhibit both epithelial and mesenchymal characteristics.34)
Interestingly, we demonstrated that the epithelial marker K5 was co-expressed with Snai1, Twist, and Vimentin (Figs. 3D–U, Supplementary Fig. 2A).
Additionally, it is known that the hybrid E/M cells are stabilized by expressing phenotype stability factors (PSFs), such as ΔNp63a, GRHL2, and OVOL.35,36) Therefore, we next investigated whether the PSFs were expressed in the skin of AD mice. The expression levels of OVOL1 and GRHL2 tended to decrease according to the number of allergen treatments applied to the skin epidermis of AD mice (Figs. 5G–R). Conversely, the expression of ΔNp63a tended to increase according to the number of allergen treatments applied to the skin epidermis of AD mice (Figs. 5A–F). These results indicate that ΔNp63 may be involved in the stabilization of hybrid E/M cells in AD mouse skin.
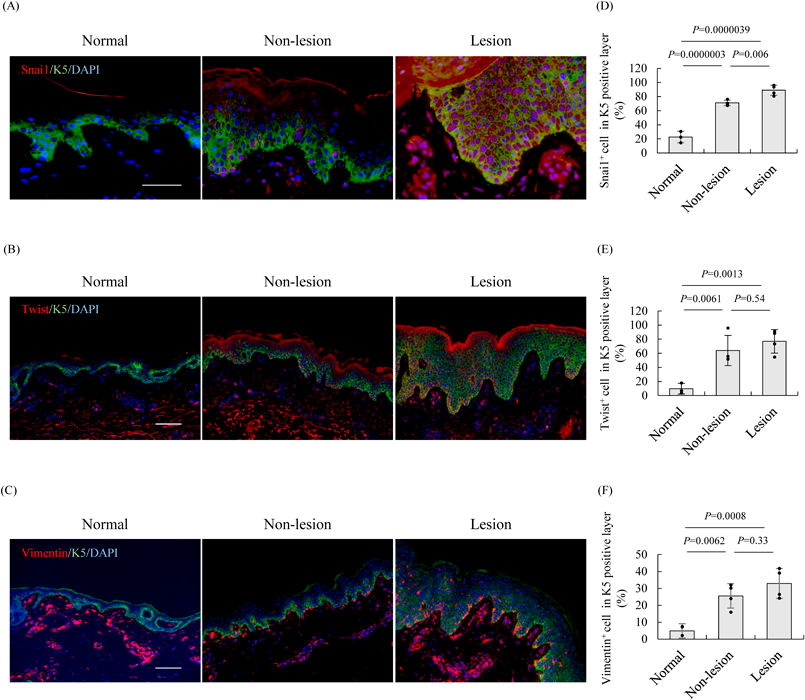
The Expression of EMT Markers in Patients with ADThe expression of E-cadherin and FLG were decreased in the skin of AD mice with increase in IL-4 and IL-13 (Figs. 2, 4). Since it has been reported that IL-4 and IL-13 are increased in patients with AD,10) we additionally investigated the expression of E-cadherin and FLG in the skin epidermis of patients with AD. Consequently, the expression of E-cadherin and FLG was decreased in the skin section of patients with AD (Fig. 6). Therefore, to verify whether the expression of EMT markers was increased in the epidermis of patients with AD as well as in AD mice model, we performed immunohistochemistry using normal and AD skin. In the nonlesion AD epidermis, Twist and Snai1 expression was significantly increased by 6.6- and 3.1-fold, respectively, and was expressed in the basal layer compared with the normal epidermis. Similarly, although the expression of these markers in the lesions of the AD epidermis was also significantly increased by 7.9- and 3.9-fold, respectively, compared with normal epidermis, they were expressed in the whole epidermis (Figs. 7A–D). Twist and Snai1 were correlated with the thickness of the skin epidermis, an AD severity indicator37) (Supplementary Figs. 3C, D).
In addition, the expression level of Vimentin was significantly increased 5.2- and 6.7-fold compared with the normal epidermis in nonlesions and lesions of the AD epidermis (Figs. 7E, F). Consistent with Snai1 and Twist, Vimentin was also correlated with the thickness of the skin epidermis (Supplementary Fig. 3E). Immunostaining images revealed that Vimentin was hardly observed in the epidermal basal layer of normal subjects, but was expressed in the basal layer in non-AD lesions and in the whole epidermis of AD lesions (Fig. 7, Supplementary Fig. 2). Moreover, cells co-expressing K5 and Vimentin were observed in the AD skin, similar to the epidermis of AD model mice (Supplementary Fig. 2B). These results suggest that EMT is induced in the skin of patients with AD, with an increased expression of EMT markers, regardless of the lesion or nonlesion area.
DISCUSSION
During the wound healing process, EMT causes decreased expressions of epithelial adhesion molecules and is induced by several cytokines, such as IL-4 and IL-13.4–7) AD is a chronic dermatitis involving skin barrier collapse caused by the downregulation of epithelial adhesion molecules and increase of IL-4 and IL13 in the skin.8–13) Thus, we thought that there was a commonality between the respective phenotypes of EMT and AD in the collapse of barrier function. To prove our hypothesis in this study, we investigated whether the expression levels of several EMT-related markers are altered in an AD mouse model and patients with AD. In both the AD mouse and patients, we demonstrated that the EMT markers, Twist and Snai1, are highly expressed in the skin. Because these EMT marker levels correlated with AD phenotype and severity, EMT may be involved in the onset of AD symptoms. In addition, our data show that Vimentin and K5 are co-expressed in skin epidermal cells at the site of AD lesions. Further, the PSFs ΔNp63a was increased in the skin epidermis of AD mice model. Although the mechanism is unclear, EMT-like phenomena may occur in AD skin.
EMT plays a role in promoting the migratory capacity of keratinocytes for re-epithelialization during wound healing.38) During the EMT process of wound healing, epithelial cells express Snai1 and Twist, which suppress the expression of epithelial adhesion molecules, such as tight junctions and E-cadherin.4,5) EMT marker-positive cells migrate during re-epithelialization at the wound margin and expand into the epithelium to cover the wound bed.39) EMT-induced epithelial cells then repair the tissue. Chronic inflammation results in excessive EMT and abnormal tissue morphology, such as disruption of tissue barrier function and hyperplasia.1) Because previous studies have reported that skin of patient with AD exhibits hyperplasia and disrupted skin barrier function resulting from suppressed tight-junction expression,14,15) we hypothesized that the development of the AD phenotype may be involved in EMT. In AD skin with hyperplasia, increased Snai1 and Twist and decreased E-cadherin were detected (Figs. 3, 7). Since the expression of EMT markers increased according to the number of mite-antigen treatments and correlated with AD phenotype, their expressions may increase with the worsening of AD symptoms. These findings suggest that EMT may occur during AD.
In general, EMT increases the expression of the mesenchymal marker Vimentin in epithelial cells, but not in skin re-epithelialization during wound healing.40) However, in the present study, we observed increased Vimentin expression in the skin of patients with AD. Furthermore, EMT markers, including Snai1-, Twist-, and Vimentin-positive cells were detected in the nonlesion sites of patients with AD, despite the absence of scratching and inflammation (Fig. 7). This indicates that EMT in AD may not be derived from a common wound healing process. Vimentin is an intermediate diameter filament that contributes to EMT by altering cell morphology and mobility. The changes in cell morphology and increased mobility due to increased Vimentin may be involved in the disruption of tissue structure in AD skin.
EMT in AD may be caused by physiological factors, such as chronic inflammation, rather than traumatic factors. Chronic inflammatory dermatitis includes hypertrophic scars, keloids, and psoriasis, all of which have been observed in EMT within the epidermis. EMT occurring in these chronic skin diseases is induced by the Th1-type cytokines, tumor necrosis factor α (TNF-α) and transforming growth factor β (TGF-β). Psoriasis and keloids develop EMT in the upper layer, above the basal layer, whereas hypertrophic scars develop EMT primarily in the basal layer.41–43) This localization of EMT in hypertrophic scars is similar to that at nonlesion sites of AD based on our data. However, in contrast to hypertrophic scars, EMT markers including Snai1, Twist and Vimentin were expressed in the whole epidermis at the AD lesion site. In AD, Th2-type cytokines are increased in the acute phase, whereas Th1-type cytokine expression is also increased during the chronic phase.39) Although hypothetical, it is possible that alterations in specialized Th cell subtypes may result in differences in EMT localization between other forms of chronic dermatitis and AD. Thus, unlike other chronic skin diseases, EMT in AD may be associated with both Th2-type and Th1-type cytokines. In addition, Th2-type cytokines may be important for the development of EMT at both lesion and nonlesion sites, because it has been suggested that Th2 cells are present at non-symptomatic sites in AD. Particularly, the Th2 type cytokines IL-4 and IL-13 that are elevated in AD are EMT induction factors and abnormally expressed during acute and chronic inflammatory phases and induce skin barrier collapse as well as itching.11,12) Both IL-4 and IL-13 have two effects: the induction of EMT and the inhibition of FLG, a skin barrier component protein.6,7,44) FLG expression is regulated by the transcription factor OVOL, which is indirectly inhibited by Snai1 in EMT-induced epithelial cells.27,38) Our data indicate that FLG and OVOL is reduced in the skin of AD with Snai1 expression and the expression of EMT markers is correlated with indicators of skin barrier function, TEWL, and epidermal thickness (Figs. 4, 6, Supplementary Figs. 1, 3). There is no reported direct relationship between Snai1 and FLG; however, it is possible that IL-4 and I L-13 induce EMT and reduce FLG expression. Based on these findings, we hypothesize that skin barrier collapse may be caused by the suppression of several epithelium-associated proteins associated with EMT in AD.
Conversely, we observed that the epithelial cell marker K5 is not lost in AD skin and is co-expressed with mesenchymal markers Vimentin (Supplementary Fig. 2). The co-expression of epithelial and mesenchymal markers was very similar to the characteristics of hybrid E/M cells, which are stabilized by expressing PSFs, such as ΔNp63α and GRHL2.35,36) In this study, ΔNp63α was upregulated in the AD mice model (Fig. 5). Additionally, ΔNp63α is upregulated in the skin of patients with AD and induced a severe skin phenotype consisting of epidermal hyperplasia, diminished terminal differentiation, and Th2 inflammation.45) The expression level of ΔNp63α was downregulated during keratinocyte differentiation, but the downregulation was inhibited by IL-4 and IL-13.46) Therefore, the induction of expression of ΔNp63α in AD may also involve the Th2 cytokines IL-4 and IL-13. These findings suggested that IL-4 and IL-13 may stabilize the hybrid E/M cells, which are an intermediate stage of EMT, by simultaneously inducing EMT and expression of ΔNP63α. On the contrary, the expression of GRHL2 was decreased in the AD skin (Figs. 5G–L). It has been reported that ΔNP63α downregulates the expression of GRHL2.47) This suggested that GRHL2 was downregulated in the skin of AD mouse, due to an increase in ΔNP63α. These findings suggest that ΔNP63α, but not GRHL2, induces hybrid E/M cells in the skin of AD mouse.
The hybrid E/M cells, including EMT marker-positive cells, were also observed in nonlesion sites of AD epidermal skin (Fig. 7), and the expression of EMT markers was correlated with several AD phenotypes (Supplementary Figs. 1, 3). Furthermore, in AD mice model, the number of hybrid E/M cells increased according to the number of mite antigen treatments, which was very similar to the trend observed for IL-4 and IL-13 expression. These findings revealed that the hybrid E/M cells may be correlated with the expression levels of IL-4 and IL-13 in the skin of AD mice. A previous study has reported abnormalities, such as uprgulation of Th2 cytokines IL-4 and IL-13, in the nonlesion skin of patients with AD, although they were not as common as those occurring in the skin lesion of patients with AD.48,49) Therefore, the hybrid E/M cells present in the nonlesion skin of patients with AD may be induced by this slight increase in Th2 cytokines. However, the expression level of the Th1 cytokine interferon-γ (IFN-γ) is increased in the nonlesion skin of patients with AD.49) Therefore, it is possible that the upregulation of Th2 cytokines is not the only cause of EMT in nonlesion skin of patients with AD, as IFN-γ also induces EMT.50) The detailed mechanism underlying this phenomenon requires clarification in the future.
AD symptoms can readily flare up, even at nonlesion sites without inflammatory findings because of the presence of subclinical inflammation.51) During AD, it is important to continue treatment until this subclinical inflammation disappears52); however, there is no marker that reflects this subclinical inflammation. Therefore, the EMT markers, Snai1 and Twist, and Vimentin, may be indicators of radical AD treatment and reflects the sensitivity to subclinical inflammation. Alternatively, if EMT is caused by an AD-specific underlying cause, then EMT markers may be used as markers for the definitive diagnosis of AD.
Overall, we found for the first time that the expression of EMT markers was involved in the development of AD phenotypes; however, because the detailed mechanism of EMT occurring in AD is unknown, the elucidation of more detailed mechanisms may result in the discovery of novel drug targets. In addition, we showed that EMT markers may be indicators of subclinical inflammation in AD, but we did not compare their expression with other types of chronic dermatitis. In the future, we will compare the expression of EMT markers in other types of chronic dermatitis to demonstrate that EMT markers represent definitive diagnostic markers for AD.
Acknowledgments
We gratefully acknowledge the work of past and present members of NANOEGG® Research Laboratories, Inc.
Conflict of Interest
This research was conducted with funding from “NANOEGG® Research Laboratories, Inc.,” to which the author belongs. The patent (Japanese Patent Application No. 2022-162538) on this study is being inspected. Y. Yamaguchi is the representative director of NANOEGG® Research Laboratories, Inc. K. Kitazawa, K. Tanaka, M. Musashi, and Y. Kubota are employees of NANOEGG® Research Laboratories, Inc. T. Nagasawa was an employee of NANOEGG® Research Laboratories, Inc. at the time this research was performed. There are no other conflicts of interest to declare.
Supplementary Materials
This article contains supplementary materials.
REFERENCES
- 1) Ijaz T, Pazdrak K, Kalita M, Konig R, Choudhary S, Tian B, Boldogh I, Brasier AR. Systems biology approaches to understanding epithelial mesenchymal transition (EMT) in mucosal remodeling and signaling in asthma. World Allergy Organ. J., 7, 13 (2014).
- 2) Weber CE, Li NY, Wai PY, Kuo PC. Epithelial-mesenchymal transition, TGF-β, and osteopontin in wound healing and tissue remodeling after injury. J. Burn Care Res., 33, 311–318 (2012).
- 3) Lamouille S, Xu J, Derynck R. Molecular mechanisms of epithelial-mesenchymal transition. Nat. Rev. Mol. Cell Biol., 15, 178–196 (2014).
- 4) Huang RYJ, Guilford P, Thiery JP. Early events in cell adhesion and polarity during epithelial-mesenchymal transition. J. Cell Sci., 125, 4417–4422 (2012).
- 5) Marconi GD, Fonticoli L, Rajan TS, Pierdomenico SD, Trubiani O, Pizzicannella J, Diomede F. Epithelial-mesenchymal transition (EMT): the Type-2 EMT in wound healing, tissue regeneration and organ fibrosis. Cells, 10, 1587 (2021).
- 6) Chen J, Gong C, Mao H, Li Z, Fang Z, Chen Q, Lin M, Jiang X, Hu Y, Wang W, Zhang X, Chen X, Li H. E2F1/SP3/STAT6 axis is required for IL-4-induced epithelial–mesenchymal transition of colorectal cancer cells. Int. J. Oncol., 53, 567–578 (2018).
- 7) Cao H, Zhang J, Liu H, Wan L, Zhang H, Huang Q, Xu E, Lai M. IL-13/STAT6 signaling plays a critical role in the epithelial–mesenchymal transition of colorectal cancer cells. Oncotarget, 7, 61183–61198 (2016).
- 8) Bieber T. Atopic dermatitis: an expanding therapeutic pipeline for a complex disease. Nat. Rev. Drug Discov., 21, 21–40 (2022).
- 9) Novak N. New insights into the mechanism and management of allergic diseases: atopic dermatitis. Allergy, 64, 265–275 (2009).
- 10) Kim K, Kim H, Sung GY. An interleukin-4 and interleukin-13 induced atopic dermatitis human skin equivalent model by a skin-On-A-chip. Int. J. Mol. Sci., 23, 2116 (2022).
- 11) Gittler JK, Shemer A, Suárez-Fariñas M, Fuentes-Duculan J, Gulewicz KJ, Wang CQ, Mitsui H, Cardinale I, de Guzman Strong C, Krueger JG, Guttman-Yassky E. Progressive activation of TH2/TH22 cytokines and selective epidermal proteins characterizes acute and chronic atopic dermatitis. J. Allergy Clin. Immunol., 130, 1344–1354 (2012).
- 12) Hamid Q, Boguniewicz M, Leung DY. Differential in situ cytokine gene expression in acute versus chronic atopic dermatitis. J. Clin. Invest., 94, 870–876 (1994).
- 13) Hamid Q, Naseer T, Minshall EM, Song YL, Boguniewicz M, Leung DY. In vivo expression of IL-12 and IL-13 in atopic dermatitis. J. Allergy Clin. Immunol., 98, 225–231 (1996).
- 14) Noda S, Suárez-Fariñas M, Ungar B, Kim SJ, de Guzman Strong C, Xu H, Peng X, Estrada YD, Nakajima S, Honda T, Shin JU, Lee H, Krueger JG, Lee KH, Kabashima K, Guttman-Yassky E. The Asian atopic dermatitis phenotype combines features of atopic dermatitis and psoriasis with increased TH17 polarization. J. Allergy Clin. Immunol., 136, 1254–1264 (2015).
- 15) De Benedetto A, Rafaels NM, McGirt LY, et al. Tight junction defects in patients with atopic dermatitis. J. Allergy Clin. Immunol., 127, 773–786.e7 (2011).
- 16) Salimi M, Barlow JL, Saunders SP, Xue L, Gutowska-Owsiak D, Wang X, Huang LC, Johnson D, Scanlon ST, McKenzie AN, Fallon PG, Ogg GS. A role for IL-25 and IL-33-driven type-2 innate lymphoid cells in atopic dermatitis. J. Exp. Med., 210, 2939–2950 (2013).
- 17) Gallegos-Alcalá P, Jiménez M, Cervantes-García D, Salinas E. The keratinocyte as a crucial cell in the predisposition, onset, progression, therapy and study of the atopic dermatitis. Int. J. Mol. Sci., 22, 10661 (2021).
- 18) Beck LA, Cork MJ, Amagai M, De Benedetto A, Kabashima K, Hamilton JD, Rossi AB. Type 2 inflammation contributes to skin barrier dysfunction in atopic dermatitis. JID Innov., 2, 100131 (2022).
- 19) Sung YY, Kim HK. Crocin ameliorates atopic dermatitis symptoms by down regulation of Th2 response via blocking of NF-κB/STAT6 signaling pathways in mice. Nutrients, 10, 1625 (2018).
- 20) Kalluri R, Weinberg RA. The basics of epithelial-mesenchymal transition. J. Clin. Invest., 119, 1420–1428 (2009).
- 21) Pastushenko I, Brisebarre A, Sifrim A, et al. Identification of the tumour transition states occurring during EMT. Nature, 556, 463–468 (2018).
- 22) Hanifin JM, Rajka G. Diagnostic features of atopic dermatitis. Acta Derm. Venereol. (Stockh), 60 (Suppl. 92), 44–47 (1980).
- 23) Yamamoto M, Haruna T, Yasui K, Takahashi H, Iduhara M, Takaki S, Deguchi M, Arimura A. A novel atopic dermatitis model induced by topical application with Dermatophagoides farinae extract in NC/Nga mice. Allergol. Int., 56, 139–148 (2007).
- 24) Holm JG, Agner T, Clausen ML, Thomsen SF. Determinants of disease severity among patients with atopic dermatitis: association with components of the atopic march. Arch. Dermatol. Res., 311, 173–182 (2019).
- 25) Hijnen D, Bruin-Weller M, Oosting B. Serum thymus and activation-regulated chemokine (TARC) and cutaneous T cell- attracting chemokine (CTACK) levels in allergic diseases: TARC and CTACK are disease-specific markers for atopic dermatitis. J. Allergy Clin. Immunol., 113, 334–340 (2004).
- 26) Jensen JM, Fölster-Holst R, Baranowsky A, Schunck M, Winoto-Morbach S, Neumann C, Schütze S, Proksch E. Impaired sphingomyelinase activity and epidermal differentiation in atopic dermatitis. J. Invest. Dermatol., 122, 1423–1431 (2004).
- 27) Jia D, Jolly MK, Boareto M, Parsana P, Mooney SM, Pienta KJ, Levine H, Ben-Jacob E. OVOL guides the epithelial-hybrid-mesenchymal transition. Oncotarget, 6, 15436–15448 (2015).
- 28) Tsuji G, Ito T, Chiba T, Mitoma C, Nakahara T, Uchi H, Furue M. The role of the OVOL1-OVOL2 axis in normal and diseased human skin. J. Dermatol. Sci., 90, 227–231 (2018).
- 29) Dongre A, Weinberg RA. New insights into the mechanisms of epithelial–mesenchymal transition and implications for cancer. Nat. Rev. Mol. Cell Biol., 20, 69–84 (2019).
- 30) Yang J, Antin P, Berx G, et al. Guidelines and definitions for research on epithelial-mesenchymal transition. Nat. Rev. Mol. Cell Biol., 21, 341–352 (2020).
- 31) Di Gregorio J, Robuffo I, Spalletta S, Giambuzzi G, De Iuliis V, Toniato E, Martinotti S, Conti P, Flati V. The epithelial-to-mesenchymal transition as a possible therapeutic target in fibrotic disorders. Front. Cell Dev. Biol., 8, 607483 (2020).
- 32) Liao TT, Yang MH. Revisiting epithelial-mesenchymal transition in cancer metastasis: the connection between epithelial plasticity and stemness. Mol. Oncol., 11, 792–804 (2017).
- 33) Stone RC, Pastar I, Ojeh N, Chen V, Liu S, Garzon KI, Tomic-Canic M. Epithelial–mesenchymal transition in tissue repair and fibrosis. Cell Tissue Res., 365, 495–506 (2016).
- 34) Pasani S, Sahoo S, Jolly MK. Hybrid E/M phenotype(s) and stemness: a mechanistic connection embedded in network topology. J. Clin. Med., 10, 60 (2020).
- 35) Dang TT, Esparza MA, Maine EA, Westcott JM, Pearson GW. ΔNp63α promotes breast cancer cell motility through the selective activation of components of the epithelial-to-mesenchymal transition program. Cancer Res., 75, 3925–3935 (2015).
- 36) Mohit KJ, Satyendra CT, Dongya J, Steven MM, Muge C, Samir MH, Sendurai AM, Kenneth JP, Eshel BJ, Herbert L. Stability of the hybrid epithelial/mesenchymal phenotype. Oncotarget, 7, 27067–27084 (2016).
- 37) Nemoto-Hasebe I, Akiyama M, Nomura T, Sandilands A, McLean WHI, Shimizu H. A clinical severity correlates with impaired barrier in filaggrin-related eczema. J. Invest. Dermatol., 129, 682–689 (2009).
- 38) Yan C, Grimm WA, Garner WL, Qin L, Travis T, Tan N, Han YP. Epithelial to mesenchymal transition in human skin wound healing is induced by tumor necrosis factor-alpha through bone morphogenic protein-2. Am. J. Pathol., 176, 2247–2258 (2010).
- 39) Gawronska-Kozak B, Grabowska A, Kur-Piotrowska A, Kopcewicz M. Foxn1 transcription factor regulates wound healing of skin through promoting epithelial-mesenchymal transition. PLOS ONE, 11, e0150635 (2016).
- 40) Schäfer M, Werner S. Cancer as an overhealing wound: an old hypothesis revisited. Nat. Rev. Mol. Cell Biol., 9, 628–638 (2008).
- 41) Hahn JM, McFarland KL, Combs KA, Supp DM. Partial epithelial-mesenchymal transition in keloid scars: regulation of keloid keratinocyte gene expression by transforming growth factor-β1. Burns Trauma, 4, 30 (2016).
- 42) Man XY, Chen XB, Li W, Landeck L, Dou TT, Chen JQ, Zhou J, Cai SQ, Zheng M. Analysis of epithelial-mesenchymal transition markers in psoriatic epidermal keratinocytes. Open Biol., 5, 150032 (2015).
- 43) Grewe M, Bruijnzeel-Koomen CA, Schöpf E, Thepen T, Langeveld-Wildschut AG, Ruzicka T, Krutmann J. A role for Th1 and Th2 cells in the immunopathogenesis of atopic dermatitis. Immunol. Today, 19, 359–361 (1998).
- 44) Furue M. Regulation of filaggrin, loricrin, and involucrin by IL-4, IL-13, IL-17A, IL-22, AHR, and NRF2: pathogenic implications in atopic dermatitis. Int. J. Mol. Sci., 21, 5382 (2020).
- 45) Rizzo JM, Oyelakin A, Min S, Smalley K, Bard J, Luo W, Nyquist J, Guttman-Yassky E, Yoshida T, De Benedetto A, Beck LA, Sinha S, Romano RA. ΔNp63 regulates IL-33 and IL-31 signaling in atopic dermatitis. Cell Death Differ., 23, 1073–1085 (2016).
- 46) Kubo T, Sato S, Hida T, Minowa T, Hirohashi Y, Tsukahara T, Kanaseki T, Murata K, Uhara H, Torigoe T. IL-13 modulates ∆Np63 levels causing altered expression of barrier- and inflammation-related molecules in human keratinocytes: A possible explanation for chronicity of atopic dermatitis. Immun. Inflamm. Dis., 9, 734–745 (2021).
- 47) Mehrazarin S, Chen W, Oh JE, Liu ZX, Kang KL, Yi JK, Kim RH, Shin KH, Park NH, Kang MK. The p63 gene is regulated by Grainyhead-like 2 (GRHL2) through reciprocal feedback and determines the epithelial phenotype in human keratinocytes. J. Biol. Chem., 290, 19999–20008 (2015).
- 48) Horsmanhetmo L, Harvima IT, Järvikallio A, Harvima RJ, Naukkarinen A, Horsmanheimo M. Mast cells are one major source of interleukin-4 in atopic dermatitis. Br. J. Dermatol., 131, 348–353 (1994).
- 49) Suárez-Fariñas M, Tintle SJ, Shemer A, Chiricozzi A, Nograles K, Cardinale I, Duan S, Bowcock AM, Krueger JG, Guttman-Yassky E. Nonlesional atopic dermatitis skin is characterized by broad terminal differentiation defects and variable immune abnormalities. J. Allergy Clin. Immunol., 127, 954–964.e4 (2011).
- 50) Imai D, Yoshizumi T, Okano S, Itoh S, Ikegami T, Harada N, Aishima S, Oda Y, Maehara Y. IFN-γ promotes epithelial-mesenchymal transition and the expression of PD-L1 in pancreatic cancer. J. Surg. Res., 240, 115–123 (2019).
- 51) Tang TS, Bieber T, Williams HC. Are the concepts of induction of remission and treatment of subclinical inflammation in atopic dermatitis clinically useful? J. Allergy Clin. Immunol., 133, 1615–1625.e1 (2014).
- 52) Melnik BC. Does therapeutic intervention in atopic dermatitis normalize epidermal Notch deficiency? Exp. Dermatol., 23, 696–700 (2014).