Report
The Potential of Virgin and Calcined Gibbsite for the Removal of Dyes from Aqueous Media
2022 年 5 巻 3 号 p. 42-44
詳細
2022 年 5 巻 3 号 p. 42-44
Virgin gibbsite (GB) and calcined gibbsite (denoted as GB200, GB400, GB600, GB800, and GB1000), were prepared at 200°C, 400°C, 600°C, 800°C, and 1000°C, and the characteristics of prepared GB samples were investigated. The amount of the hydroxyl group, the specific surface area, and the micropore volume of GB400 were higher than those of other GB samples. Additionally, the crystal structure of GB changed significantly from the gibbsite phase to transitional states at our calcination temperatures. Furthermore, we showed the adsorption capacity of various dyes using GB samples. The prepared GB400, GB600, and GB800 showed adsorption capacity of Red, Blue, and Green, respectively. However, other GB samples did not show a dye adsorption capacity. Moreover, the adsorption mechanism of Red and Blue using GB400 and GB600 was related to the number of hydroxyl groups, specific surface area, and micropore volumes in this study. Finally, the relationship between the amount of Red and Blue adsorbed and the number of total organic carbons decreased was positively correlated with the values of 0.974 and 0.935, respectively. In our prepared GB sample, both dyes and organic carbons were simultaneously removed during the adsorption treatment.
Industrial wastewater, including dyes from different industries such as textiles, paper, leather, and plastics1) is a significant source of aquatic pollution.2) Additionally, these dyes are objectionable pollutants because they are toxic, carcinogenic, and cause skin and eye irritation when consumed or inhaled.3–5) More than 100,000 dyes with different chemical structures are now available commercially with approximately 1,000,000 tons produced per year.6) These dyes are classified using Color Index’s (C.I.) principal system. Previous research has classified dyes based on their usage, such as acid dyes, cationic (basic) dyes, disperse dyes, direct dyes, reactive dyes, solvent dyes, sulfur dyes, and vat dyes.3)
Adsorption is a desirable technique for removing dyes from effluent discharged into water bodies from different industries.7,8) Many researchers have reported the removal treatment techniques of dyes based on mineral adsorption treatment.9,10) Additionally, we have reported that minerals, such as gibbsite can absorb heavy metals and useful materials from aqueous media.11,12) Moreover, the physicochemical characteristics of virgin and calcined gibbsite were evaluated, and the interaction mechanism was demonstrated.
However, to the best of our knowledge, there have not been sufficient reports on the preparation and characterization of calcined gibbsite at different temperatures, and the adsorption capacity of dyes using it from aqueous media. Additionally, some studies have reported the relationship between the properties of adsorbents and the number of dyes adsorbed, but not the relationship between those and total organic carbon removal in detail.13) Dye decolorization is due to the decomposition of its chromophore, indicating a decrease in chromaticity. However, these phenomena imply that the degradation products are not removed after the decolorization treatment. Therefore, increasing the amount of total organic carbon that decreases with the number of dyes adsorbed is critical. The effect of calcination temperatures on the physicochemical characteristics of gibbsite was investigated, and the adsorption capacity, including the removal of total organic carbons from different types of dyes in the water phase, was evaluated in this study.
Kayanol Milling Turquoise Blue3G (C.I. Acid Blue 185), Kayanol Milling Red BW (C.I. Acid Blue 138), Kayamol Milling Scarlet FGW (C.I. Acid Red 111), Kayanol Milling Yellow 5GW (C.I. Acid Yellow 127), and Kayanoll Cyanine Green G (C.I. Acid Green 25) was used as an adsorbate in this study. These dyes were purchased from Shinko Co. These samples were denoted as Blue, Red, Scarlet, Yellow, and Green.
Gibbsite (GB; aluminum hydroxide, Al(OH)3) was used as an adsorbent. Calcined GB was prepared by calcining at 200°C, 400°C, 600°C, 800°C, and 1000°C for 2 h in a muffle furnace (Each sample was denoted as GB200, GB400, GB600, GB800, and GB1000). Properties, such as physical and chemical characteristics, have been reported in our previous study.14) Briefly, the specific surface area and pore volumes were measured using a NOVA4200e instrument (Yuasa Ionics, Tokyo, Japan). The number of hydroxyl groups was determined using the fluoride ion adsorption methods.15) The pH of the adsorbent was measured using the following procedures. At 25°C, 0.1-g adsorbent and 50-mL distilled water at 7.0 pH was mixed and reacted for 2 min. Subsequently, the reaction solution was filtered through a 0.45-μm membrane filter, and the pH of the sample solution was measured using a digital pH meter (Mettler-Toledo, Tokyo, Japan).
Adsorption Capacity of Dyes Using Prepared GBsThe adsorption treatment was demonstrated using the following procedure. Each 0.05-g sample and 50-mL dye solution at different concentrations (1, 5, 10, 30, 50, 70, and 100 mg/L) were mixed and reacted at 100 rpm for 24 h at 25°C. After the reaction, the sample solution was filtered through a 0.45-μm membrane filter, then the concentration of dye was determined using a spectrophotometer UV-1200 (Shimadzu Co., Ltd., Kyoto, Japan). The amount of dye adsorbed was calculated using the initial and equilibrium concentrations. The adsorption wavelength and calibration curve range were confirmed in the preliminary experiments.
Adsorption wavelengths for Blue, Red, Scarlet, Yellow, and Green were 622 nm, 514 nm, 512 nm, 399 nm, and 642 nm, respectively. Additionally, a calibration curve was prepared over a range of 1–100 mg/L and the correlation coefficient was greater than 0.996. The amount of total organic carbon was measured using a TOC-500 (Shimadzu Co., Ltd.).
Table 1 shows the effect of calcination temperature on the physicochemical characteristics of GB. The number of hydroxyl groups (0.46 mmol/g), specific surface area (295.3 m2/g), and micropore volumes (0.036 µL/g) of GB400, which parameters directly affect the adsorption capacity, were higher compared to the other samples. After calcination of GB at 400°C, the number of hydroxyl groups, specific surface area, and micropore volumes decreased with increasing calcination temperatures. The changes in crystal structures have already been reported.16) These changes showed that the crystal structure of GB changed from the gibbsite phase to transitional states (boehmite phase, χ–form, γ–form, δ–form, θ–form), and finally became stable α–form under our experimental conditions (data not shown in this study). Large changes in crystal structure occurred at calcination temperatures between 200°C and 300°C. Additionally, large structure changes occurred at calcination temperatures between 900°C and 1000°C. Similar trends were also reported in previous studies.17,18)
| Samples | pH | Number of hydroxyl group (mmol/g) | Specific surface area (m2/g) |
Mean pore diameter (Å) |
Pore volume (mL/g) | ||
|---|---|---|---|---|---|---|---|
| Micropore γ ≤ 10 |
Mesopore 10 < γ ≤ 250 |
Macropore 250 < γ |
|||||
| GB | 6.8 | 0.17 | 4.2 | 514.0 | 0.001 | 0.013 | 0.015 |
| GB200 | 7.5 | 0.09 | 4.6 | 68.6 | 0.001 | 0.01 | 0.008 |
| GB400 | 8.1 | 0.46 | 295.3 | 13.0 | 0.036 | 0.10 | 0.012 |
| GB600 | 9.2 | 0.42 | 176.1 | 38.0 | 0.006 | 0.26 | 0.014 |
| GB800 | 9.3 | 0.38 | 128.1 | 48.2 | 0.002 | 0.26 | 0.018 |
| GB1000 | 9.6 | 0.21 | 36.8 | 140.9 | 0.001 | 0.22 | 0.027 |
Furthermore, we evaluated the adsorption capacity of each dye using the prepared samples (Fig. 1). The prepared GB samples show a relatively low adsorption capacity of Yellow and Scarlet under our experimental conditions. Therefore, these dyes were not removed using the prepared GB samples in aqueous media. Conversely, the amount of Red and Blue adsorbed onto GB400 and GB600 was greater than that adsorbed onto the other GB samples. Particularly, GB400 showed the highest adsorption capacity. Furthermore, the amount of Green adsorbed onto GB600 was higher than that absorbed onto other prepared GB samples. Subsequently, the relationship between the amount of dye adsorbed and physicochemical characteristics of the prepared GB samples was demonstrated. The correlation coefficients between Red and the number of hydroxyl groups, specific surface area, and micropore volume were 0.808, 0.953, and 0.928, respectively. Additionally, the correlations between Blue and the number of hydroxyl groups, specific surface areas, and micropore volume were also 0.755, 0.876, and 0.811, respectively. These results indicate that these factors affect the adsorption capacity of Red and Blue using GB samples. However, these factors were not related to the adsorption of Green in this study. Therefore, further investigations must be performed to evaluate the adsorption mechanism of each dye using the prepared GB samples.

Amounts of Dyes Adsorbed
Initial concentration: 100 mg/L, sample volume: 50 mL, adsorbent: 0.05 g, temperature: 25°C, contact time: 24 h, agitation speed: 100 rpm.
Finally, we evaluated the relationship between the number of dyes (Red and Blue) adsorbed and the number of total organic carbons decreased (Fig. 2). The correlation coefficients between the amount of Red and Blue adsorbed and the numbers of total organic carbons decreased were 0.974 and 0.935, respectively. The decolorization of dyes is attributed to the decomposition of the chromophore of each dye, indicating a decrease in chromaticity; however, the degradation products were not removed after treatment. Therefore, increasing the amount of total organic carbon decreased with an increase in the number of dyes adsorbed is critical. Under our experimental conditions, dyes and organic carbons were removed simultaneously using GB adsorption technology. Finally, further study must be performed to elucidate the adsorption mechanism of dyes, including total organic carbons, using the prepared GB samples.
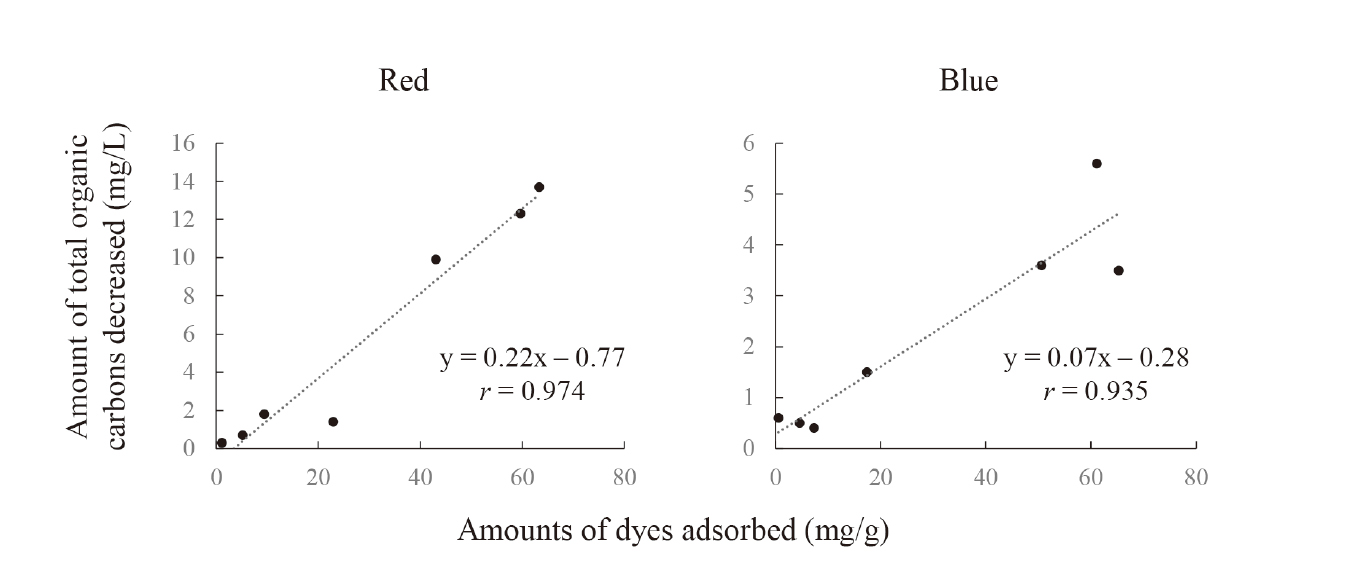
Relationship Between Amounts of Dyes Adsorbed and Amount of Total Organic Carbons Decreased
Initial concentration: 1, 5, 10, 30, 50, 70, and 100 mg/L, sample volume: 50 mL, adsorbent: 0.05 g, temperature: 25°C, contact time: 24 h, agitation speed: 100 rpm.
In this study, we prepared GB samples, which are used to demonstrate the adsorption capacity of different types of dyes. Under our experimental conditions, GB400 and GB600 showed high Red and Blue adsorption capacity. Additionally, we elucidated that the dye adsorption using GB samples was related to GB sample characteristics, such as the number of hydroxyl groups, specific surface area, and micropore volumes in this study. Finally, the adsorption treatment of dyes using GB samples is attributed to the decrease in total organic carbon in the aqueous media.
Conflict of interestThe authors declare no conflict of interest.