Abstract
Background:
Clinical and experimental studies have shown the existence of an arrhythmogenic substrate in the right ventricular outflow tract (RVOT) in patients with Brugada syndrome (BrS). To evaluate the importance of the RVOT, we evaluated the activation pattern of induced ventricular tachyarrhythmias using body surface mapping (BSM) in patients with BrS.
Methods and Results:
We examined 14 patients with BrS in whom ventricular tachyarrhythmias were induced by programmed electrical stimulation. The 87-lead BSM was recorded during induced ventricular tachyarrhythmias, and an activation map and an isopotential map of QRS complexes every 5 ms were constructed to evaluate the activation pattern of ventricular tachyarrhythmias. BSM during 20 episodes of ventricular tachyarrhythmias induced at the RVOT showed that repetitive excitation was generated at the RVOT and propagated to the inferior RV and left ventricle, and then returned to the RVOT. Polymorphic QRS change during ventricular tachyarrhythmias was associated with migration of the earliest activation site and rotor. BSM during 4 episodes of ventricular fibrillation (VF) showed that the excitation front moved randomly with formation of multiple wavefronts.
Conclusions:
Programmed stimulation initiated repetitive firing from the RVOT. Migration and competition of the earliest activation site and rotor and local conduction delay changed the QRS morphology. Degeneration of the reentrant circuit into multiple wavefronts resulted in VF. (Circ J 2016; 80: 1734–1743)
The right ventricular outflow tract (RVOT) has an important role in the initiation of ventricular fibrillation (VF) in patients with Brugada syndrome (BrS). The characteristic type 1 ST elevation1,2
represents an electrophysiological abnormality in the RVOT,3
and delayed potential has been frequently recorded in this area.4–6
Moreover, premature ventricular contractions followed by VF frequently originate from this area.7,8
Although the mechanisms of ST elevation and occurrence of ventricular tachyarrhythmias in BrS are controversial, experimental studies have shown that epicardial repolarization abnormality at the RVOT causes ST elevation and promotes VF.9–11
The theory of repolarization abnormality explains the ST elevation and its fluctuation, but depolarization abnormality is also an important finding in patients with BrS.5,8,12,13
Elimination of VF attacks and normalization of ST elevation by radiofrequency catheter ablation directly targeting the abnormal potentials at the RVOT epicardium have demonstrated that the abnormal electrical substrate that initiates the ventricular tachyarrhythmias exists in the epicardium of the RVOT.6
The electrophysiological abnormality in the RVOT epicardium should contribute to the initiation of ventricular tachyarrhythmia. Both the mechanism of maintenance and polymorphic QRS change of the ventricular arrhythmias are still unknown because it is difficult to map electrical activation during ventricular tachyarrhythmias that immediately cause collapse of the patient’s hemodynamics.
The objective of this study was to determine the mechanism of the maintenance of ventricular tachyarrhythmias in BrS. For this purpose, we analyzed an activation map of ventricular tachyarrhythmias induced by programmed electrical stimulation (PES) using an 87-lead body surface mapping (BSM) system.
Methods
Study Subjects
The subjects of this study comprised 14 male patients (mean age: 47±10 years) with spontaneous type 1 ECG defined by the Expert Consensus Statement.14
Of them, 2 patients experienced aborted cardiac arrest, 5 patients experienced syncope and 7 patients did not have any episodes at the time of the electrophysiological study (EPS). There were no patients from the same family. Echocardiography and chest roentgenography were performed in all patients, and no abnormalities were found. Coronary angiography and left and right ventriculography showed no sign of coronary artery disease or ventricular abnormality.
An EPS was performed in all patients. The risks were explained to each patient, and written informed consent was given before the study. Induction of ventricular arrhythmia was attempted without the use of any antiarrhythmic drugs. PES was performed at the RV apex (RVA), RVOT or left ventricle (LV) using extra stimuli at 2 cycle lengths (600 and 400 ms) to induce polymorphic ventricular tachycardia (VT) or VF. We analyzed the BSM recording of the induced ventricular arrhythmias with ≥15 beats.
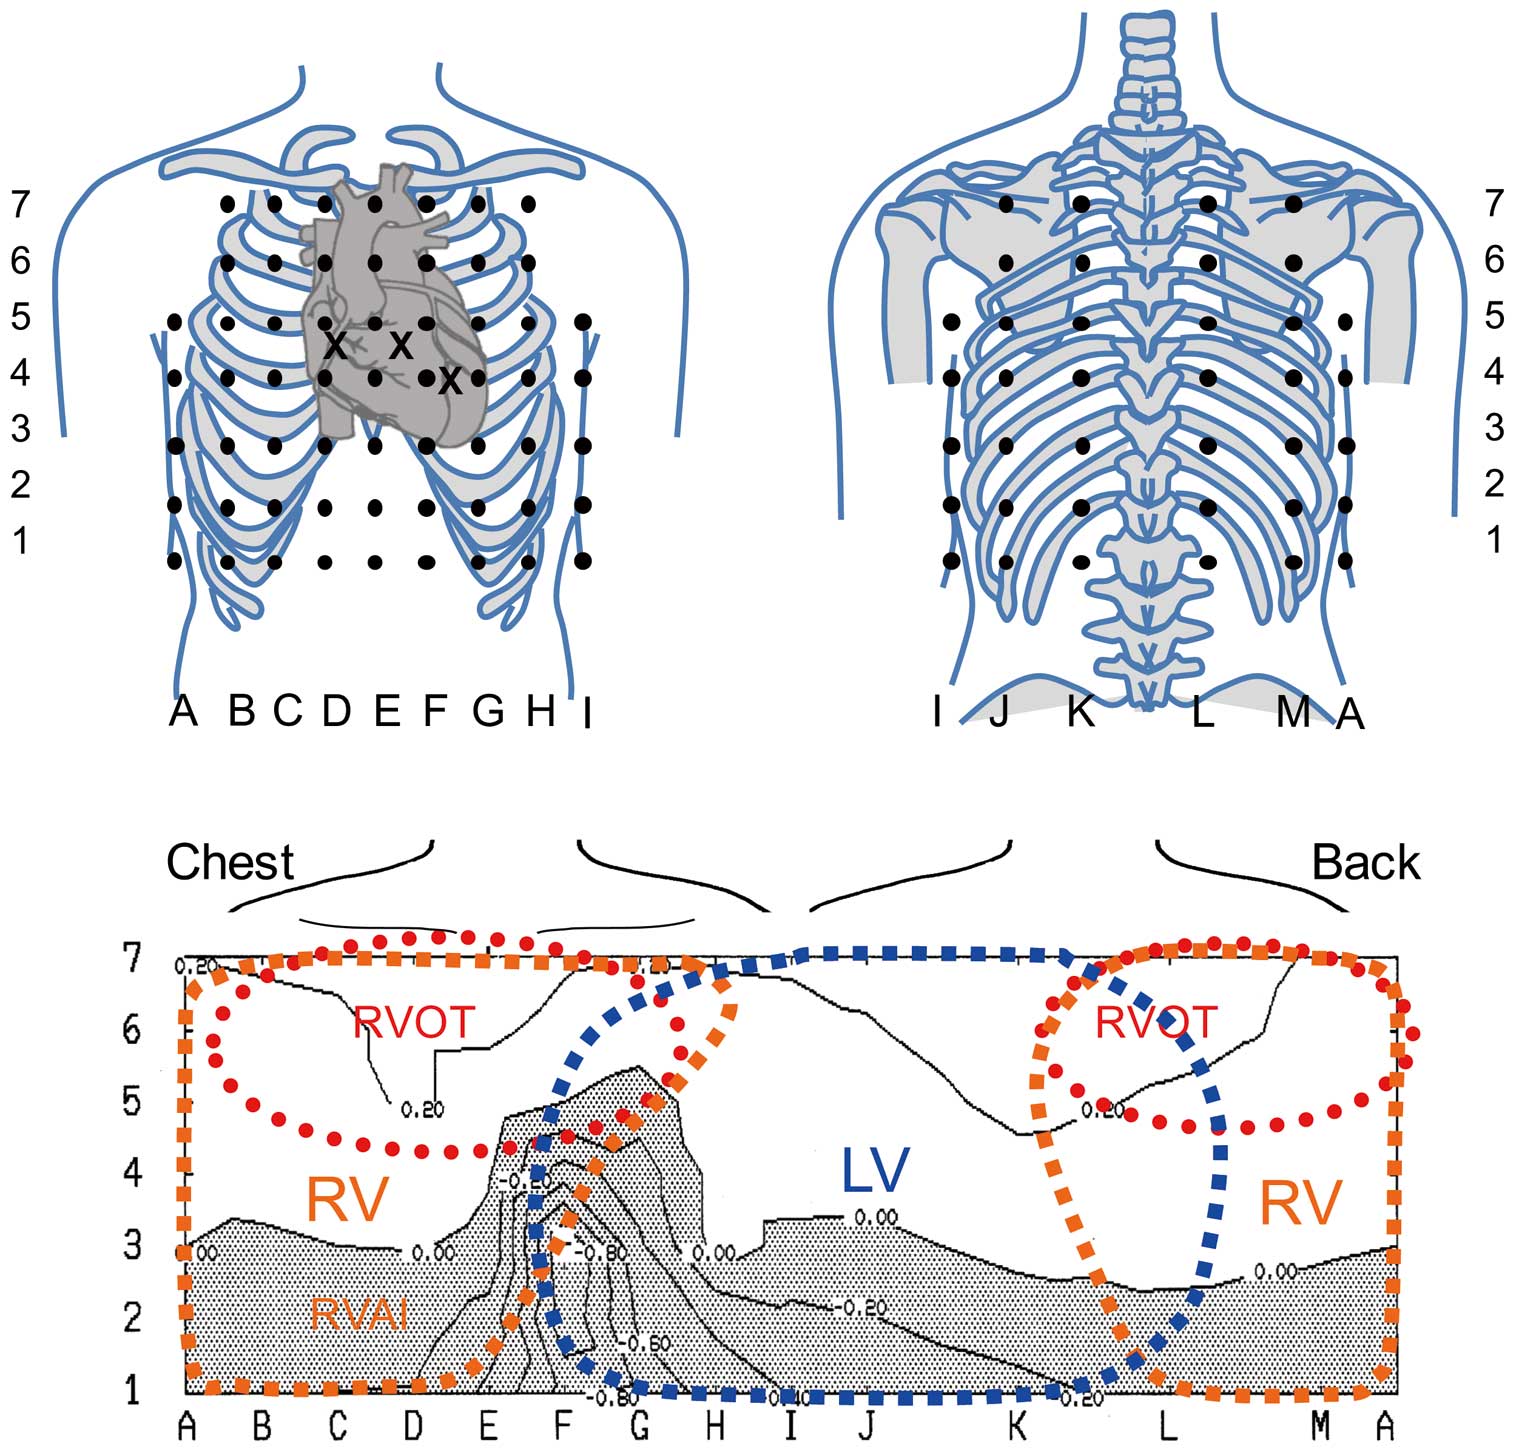
BSM with 87-lead unipolar electrocardiograms was performed in all patients using an HPM-7100 mapping system (Fukuda Denshi Co, Tokyo, Japan) during the EPS. Data for a maximum 7.8 s of ECG recordings (87 unipolar leads, regular limb leads and leads V1–V3) were stored on a magnetic disk. Of these, 59 leads were located in the anterior region of the chest (A–I), and 28 were located on the back (J–M). These locations were standard for the system (Figure 1). The unipolar leads on the mid to right chest were sensitive to the electrical activity in the RV.3,15
Similarly, the leads on the high to mid-chest were most sensitive to electrical activity in the RVOT and the leads on the left chest to the back reflected the potentials of the LV.8,15
To evaluate the activation pattern of the induced ventricular tachyarrhythmias, we constructed isopotential maps every 5 ms after the induction of arrhythmia. We also calculated the local activation time of ventricular tachyarrhythmias as the interval between the extrastimulus and the peak negative dV/dT of the QRS complex of each lead in successive beats and constructed isochronal maps of activation time.16
This study was approved by the Ethics Committee on Human Research and Epidemiology of Okayama University. Analysis of the
SCN5A
gene was performed in all patients in compliance with guidelines for human genome studies of the Ethics Committee of Okayama University. Analysis of
SCN5A
mutation was performed as we reported previously.8
Definition of Ventricular Tachyarrhythmias
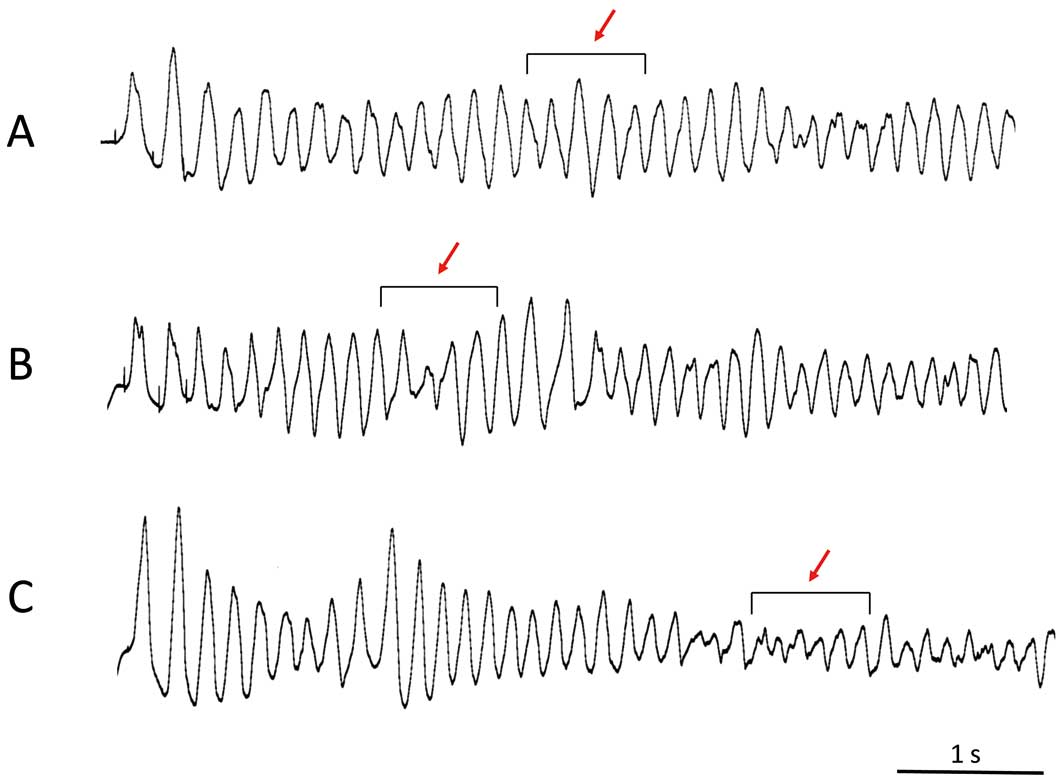
We categorized induced ventricular tachyarrhythmias as polymorphic VT or VF according to the QRS morphology in lead II. We defined polymorphic VT as a ventricular tachyarrhythmia with unstable, continuously varying QRS complex morphology.17
We then classified polymorphic VT into 2 categories: stable and unstable. We defined the stable part of polymorphic VT as QRS complexes during VT that were followed by similar QRS complexes with variation of voltage between 2 successive QRS complexes ≤30% (Figure 2A). We defined the unstable part of polymorphic VT as polymorphic VT with variation of the voltage between 2 successive QRS complexes >30% or a rapidly changed QRS axis such as torsade de pointes (Figure 2B). We defined VF as the rhythm of continuous degenerated QRS complexes with chaotic asynchronous fractionated activity and non-isolated QRS complexes (Figure 2C).10
Statistical Analysis
Continuous data are expressed as means±SD values. The Fisher exact test or the χ2
test was used for categorical variables. Comparison of 2 groups was made with Student’s t-test for unpaired data and paired data, as appropriate. Significance was defined as P<0.05.
The authors had full access to and take full responsibility for the integrity of the data. All authors have read and agreed to the manuscript as written.
Results
Characteristics of Patients and Induced Arrhythmias
The
Table
shows the characteristics of the patients: 2 asymptomatic patients experienced new onset of VF during follow-up (patients 1 and 2) and 2 patients died from cancer (patients 6 and 14).
SCN5A
mutation was detected in 1 patient (patient 6). Polymorphic VT and VF were induced by RVOT pacing with 2 or 3 extrastimuli in all patients. PES at the RVA induced a VT/VF episode in 1 patient (patient 13) and PES at the LV did not induce any VT/VF. The coupling interval of the last extrastimulus was 193±14 ms. A total of 21 episodes of VT/VF (1–3 episodes/patient) were mapped, and direct current shock was required to terminate arrhythmias in 20 episodes. Spontaneous termination of polymorphic VT was observed in 1 patient (patient 9). The average cycle length of the initial 10 beats of induced VT/VF was 188±10 ms. Recording time of the induced VT/VF by the BSM system was 3.9±1.2 s (range, 2.1–6.2 s).
Table.
Clinical Characteristics of the Patients With Brugada Syndrome
Case
no. |
Age
(years) |
Symptom |
SCN5A
mutation |
PVT/VF induction by PES |
Cardioversion |
Pattern |
Earliest
activation site |
| Site |
FW/Sep |
Stimuli
S1S2S3S4 |
| 1 |
39 |
Asympt→VF |
− |
RVOT |
FW |
400/200/190 |
+ |
Stable→VF |
RVOT→Random |
| RVOT |
Sep |
400/200/180 |
+ |
Stable→VF |
RVOT→Random |
| 2 |
42 |
Asympt→VF |
− |
RVOT |
FW |
400/260/200 |
+ |
Stable |
RVOT |
| RVOT |
FW |
400/250/200 |
+ |
Stable |
RVOT |
| 3 |
55 |
VF |
− |
RVOT |
FW |
400/240/190 |
+ |
Stable |
RVOT |
| 4 |
55 |
VF |
− |
RVOT |
FW |
600/300/240 |
+ |
VF |
Random |
| RVOT |
FW |
400/240/220/200 |
+ |
VF |
Random |
| 5 |
27 |
Syncope |
− |
RVOT |
Sep |
400/230/190 |
+ |
Stable |
RVOT |
| 6 |
45 |
Syncope |
+ |
RVOT |
FW |
400/240/220/200 |
+ |
Stable |
RVOT |
| 7 |
46 |
Syncope |
− |
RVOT |
Sep |
400/220/180 |
+ |
Stable→Unstable→
Stable |
RVOT |
| 8 |
52 |
Syncope |
− |
RVOT |
FW |
400/240/190 |
+ |
Stable |
RVOT |
| 9 |
58 |
Syncope |
− |
RVOT |
FW |
400/260/200 |
− |
Stable |
RVOT |
| 10 |
36 |
Asympt |
− |
RVOT |
Sep |
400/240/190 |
+ |
Stable→Unstable |
RVOT/RVA |
| 11 |
39 |
Asympt |
− |
RVOT |
FW |
400/260/210 |
+ |
Stable |
RVOT |
| 12 |
52 |
Asympt |
− |
RVOT |
Sep |
400/230/180 |
+ |
Stable→Unstable→
Stable |
RVOT/RVA |
| RVOT |
FW |
400/220/180 |
+ |
Stable→Unstable→
Stable |
RVOT/RVA |
| 13 |
54 |
Asympt |
− |
RVOT |
FW |
400/240/190 |
+ |
Stable→Unstable |
RVOT/RVA |
| RVOT |
Sep |
400/240/190 |
+ |
Stable |
RVOT |
| RVA |
− |
400/230/180 |
+ |
Stable→Unstable→
Stable |
RVA/RVOT |
| 14 |
61 |
Asympt |
− |
RVOT |
FW |
400/220/190 |
+ |
Stable |
RVOT |
| RVOT |
FW |
400/220/180 |
+ |
Stable |
RVOT |
Asympt, asymptomatic; FW, free wall; PES, programmed electrical stimulation; PVT, polymorphic ventricular tachycardia; RVA, right ventricular apex; RVOT, right ventricular outflow tract; SD, sudden death; Sep, septum; VF, ventricular fibrillation.
A stable part during polymorphic VT was observed in 19 episodes and it changed to unstable in 5 of the 19 episodes. VF was observed during BSM recording in 4 episodes; 2 episodes of VF degenerated from the stable part of polymorphic VT (Figure 2C).
Activation Pattern of Induced VT
Polymorphic VTs with a stable part induced at the RVOT had the earliest activation site at the high precordium (columns C–E, K–M, rows 6 and 7) and the right side of the high back (RVOT,
Table).
Figure 3
shows an example of the stable part of a polymorphic VT induced by PES at the RVOT in patient 11. In the stable part of the polymorphic VT, endocardial activation was generated from the superior chest to other ventricular sites (Figure 3B). The time course of the isopotential maps in the 10th beat showed that a positive area appeared initially at the superior chest (Figure 3C-a, RVOT, D–E, 4–6) and moved down to the inferior chest (Figure 3C-b, inferior RV), and then the positive area turned in the direction of the left axilla and moved up to the left superior back (LV) (Figure 3C-c–e), which is adjacent to the initial activation area. Next, a positive area re-entered the superior chest (Figure 3C-f) and propagated in the same course as that of the previous beat (Figure 3C-g–i; 11th beat). An isochronal map of the activation time (activation map) showed that the earliest activation site appeared at the upper chest (RVOT) and propagated to the inferior chest (RV), and then the activation front went up the left lateral chest (LV) to the right back (RVOT) (Figure 3D, V10). This activation pattern was usually observed in all stable parts of polymorphic VTs induced by PES at the RVOT (V1–V15,
Figure 4) and resembled the activation pattern of RVOT pacing (S1 and S3,
Figure 4), but the latest activation site was usually adjacent to the earliest activation site of the RVOT. A minor polymorphic change resulted from a subtle change of the propagation course and alterations in conduction slowing at the anterior chest were represented as crowded isochrones.
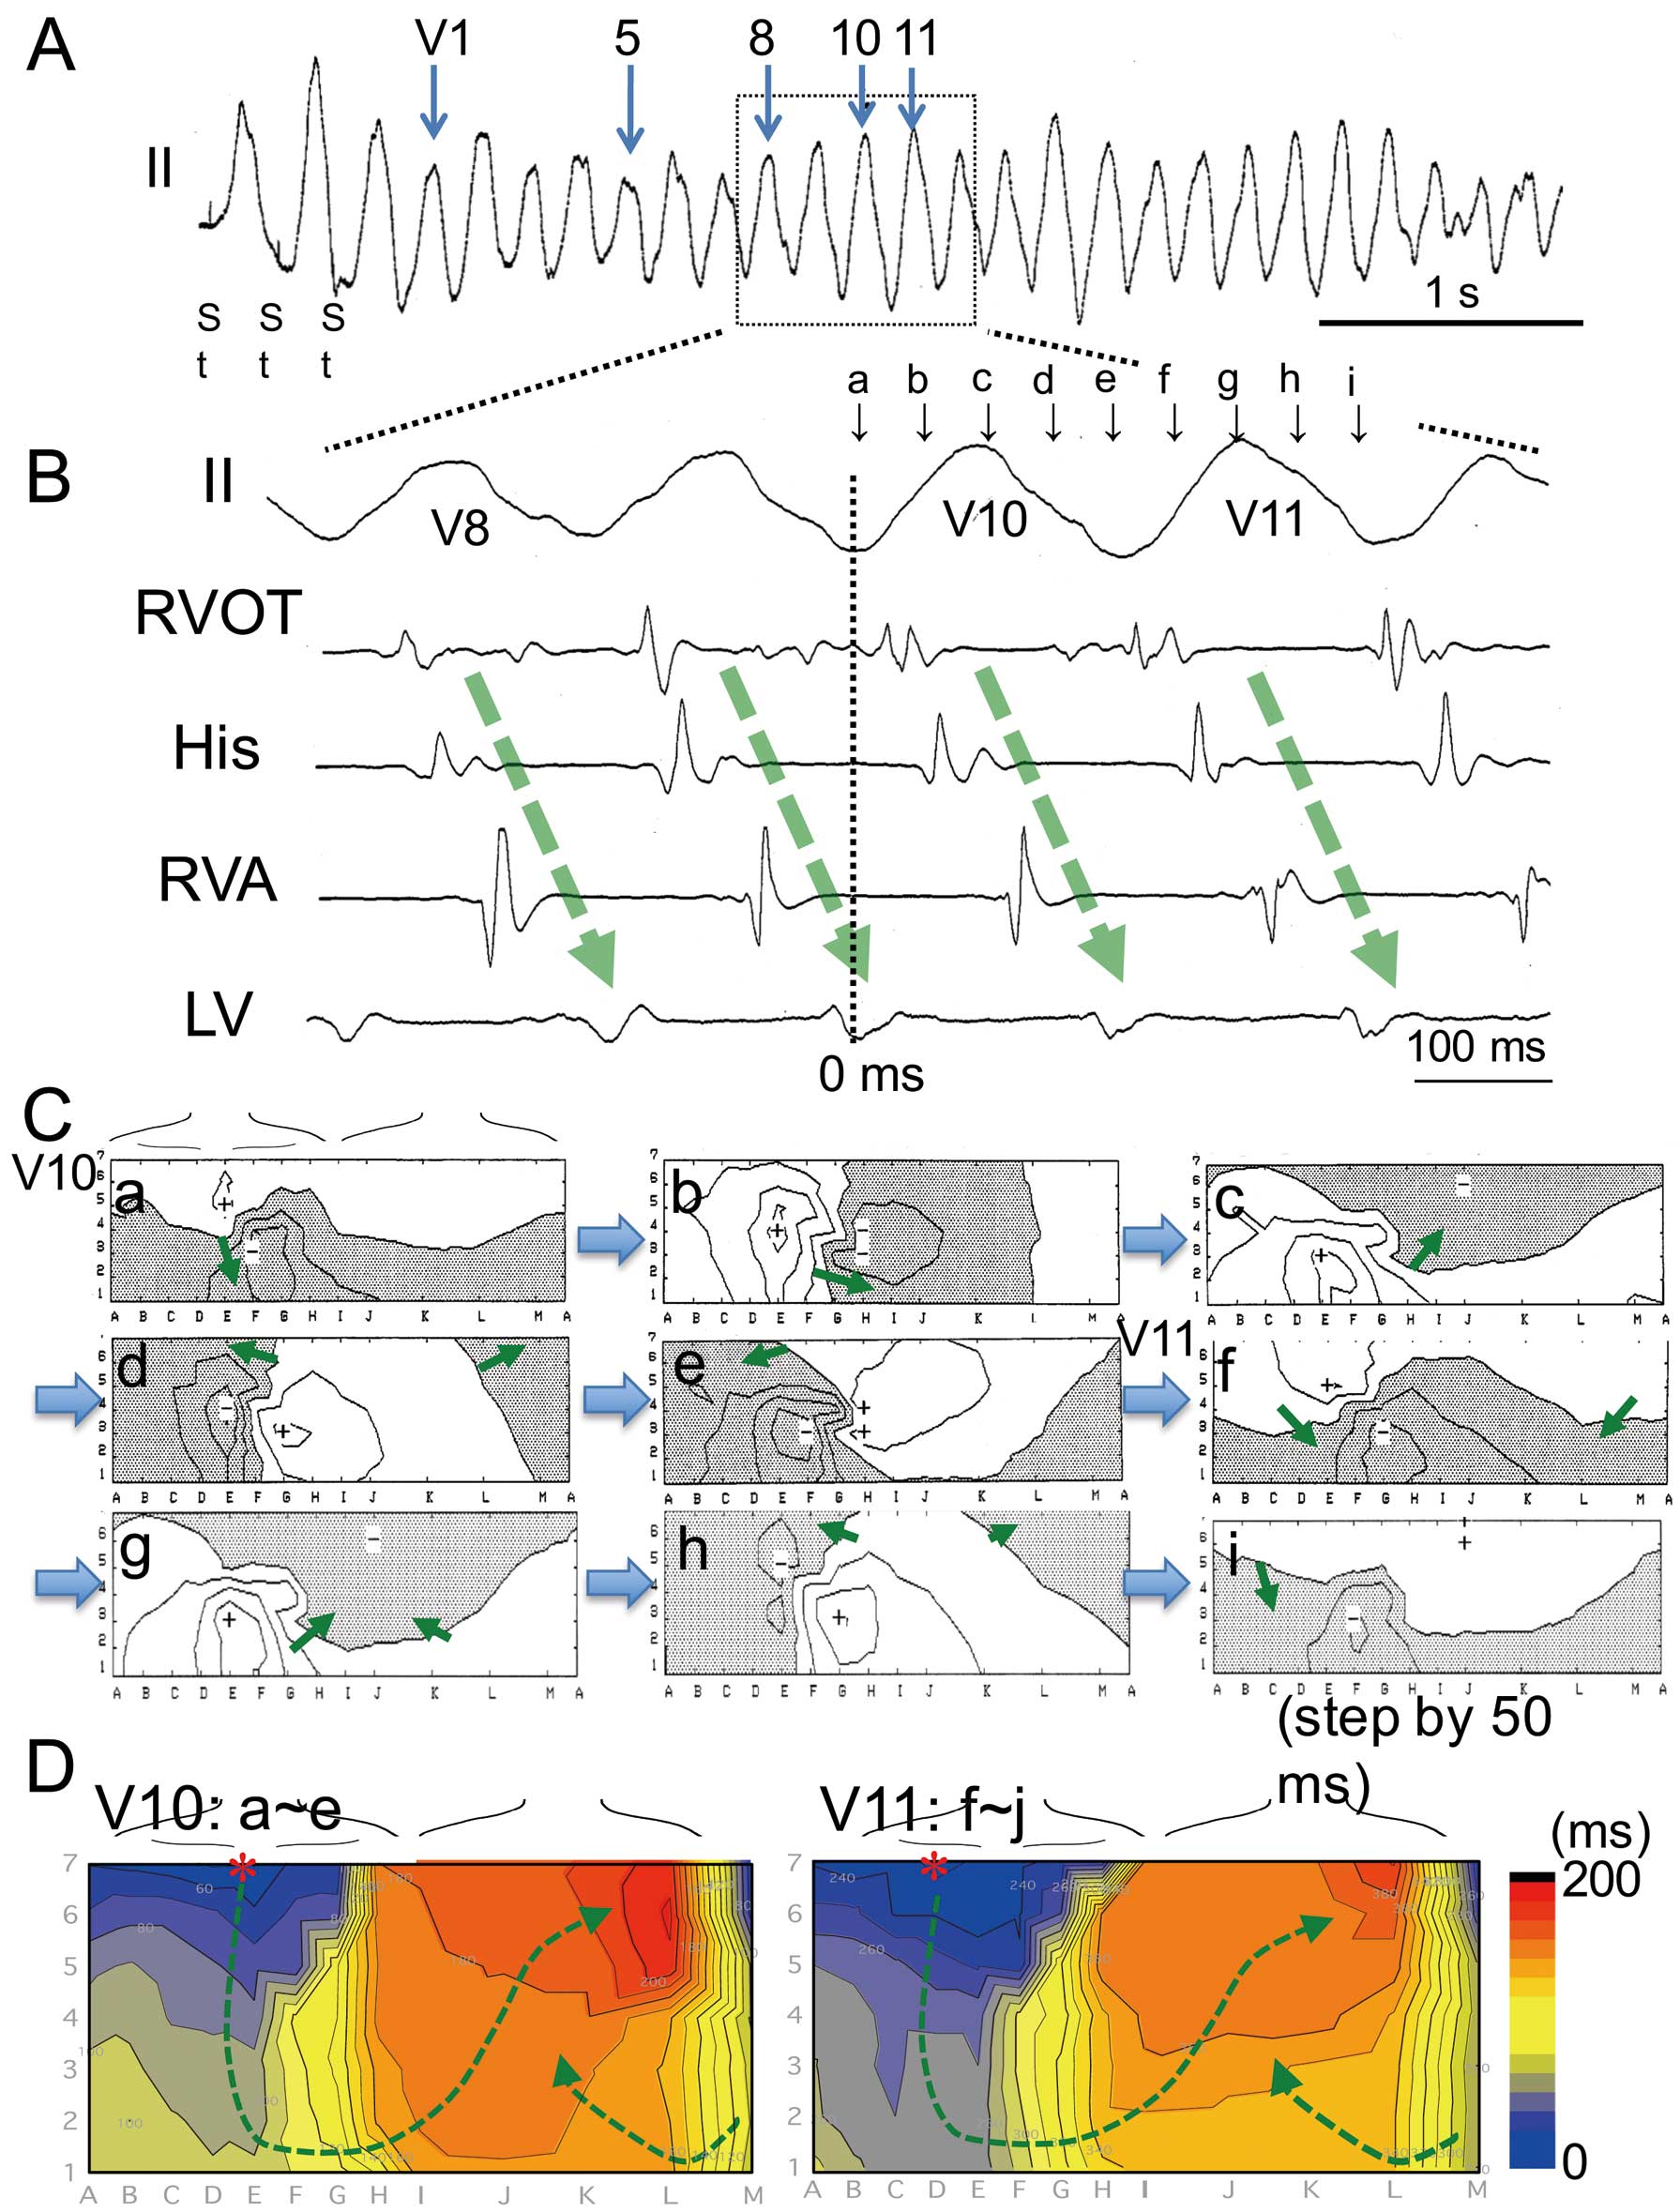

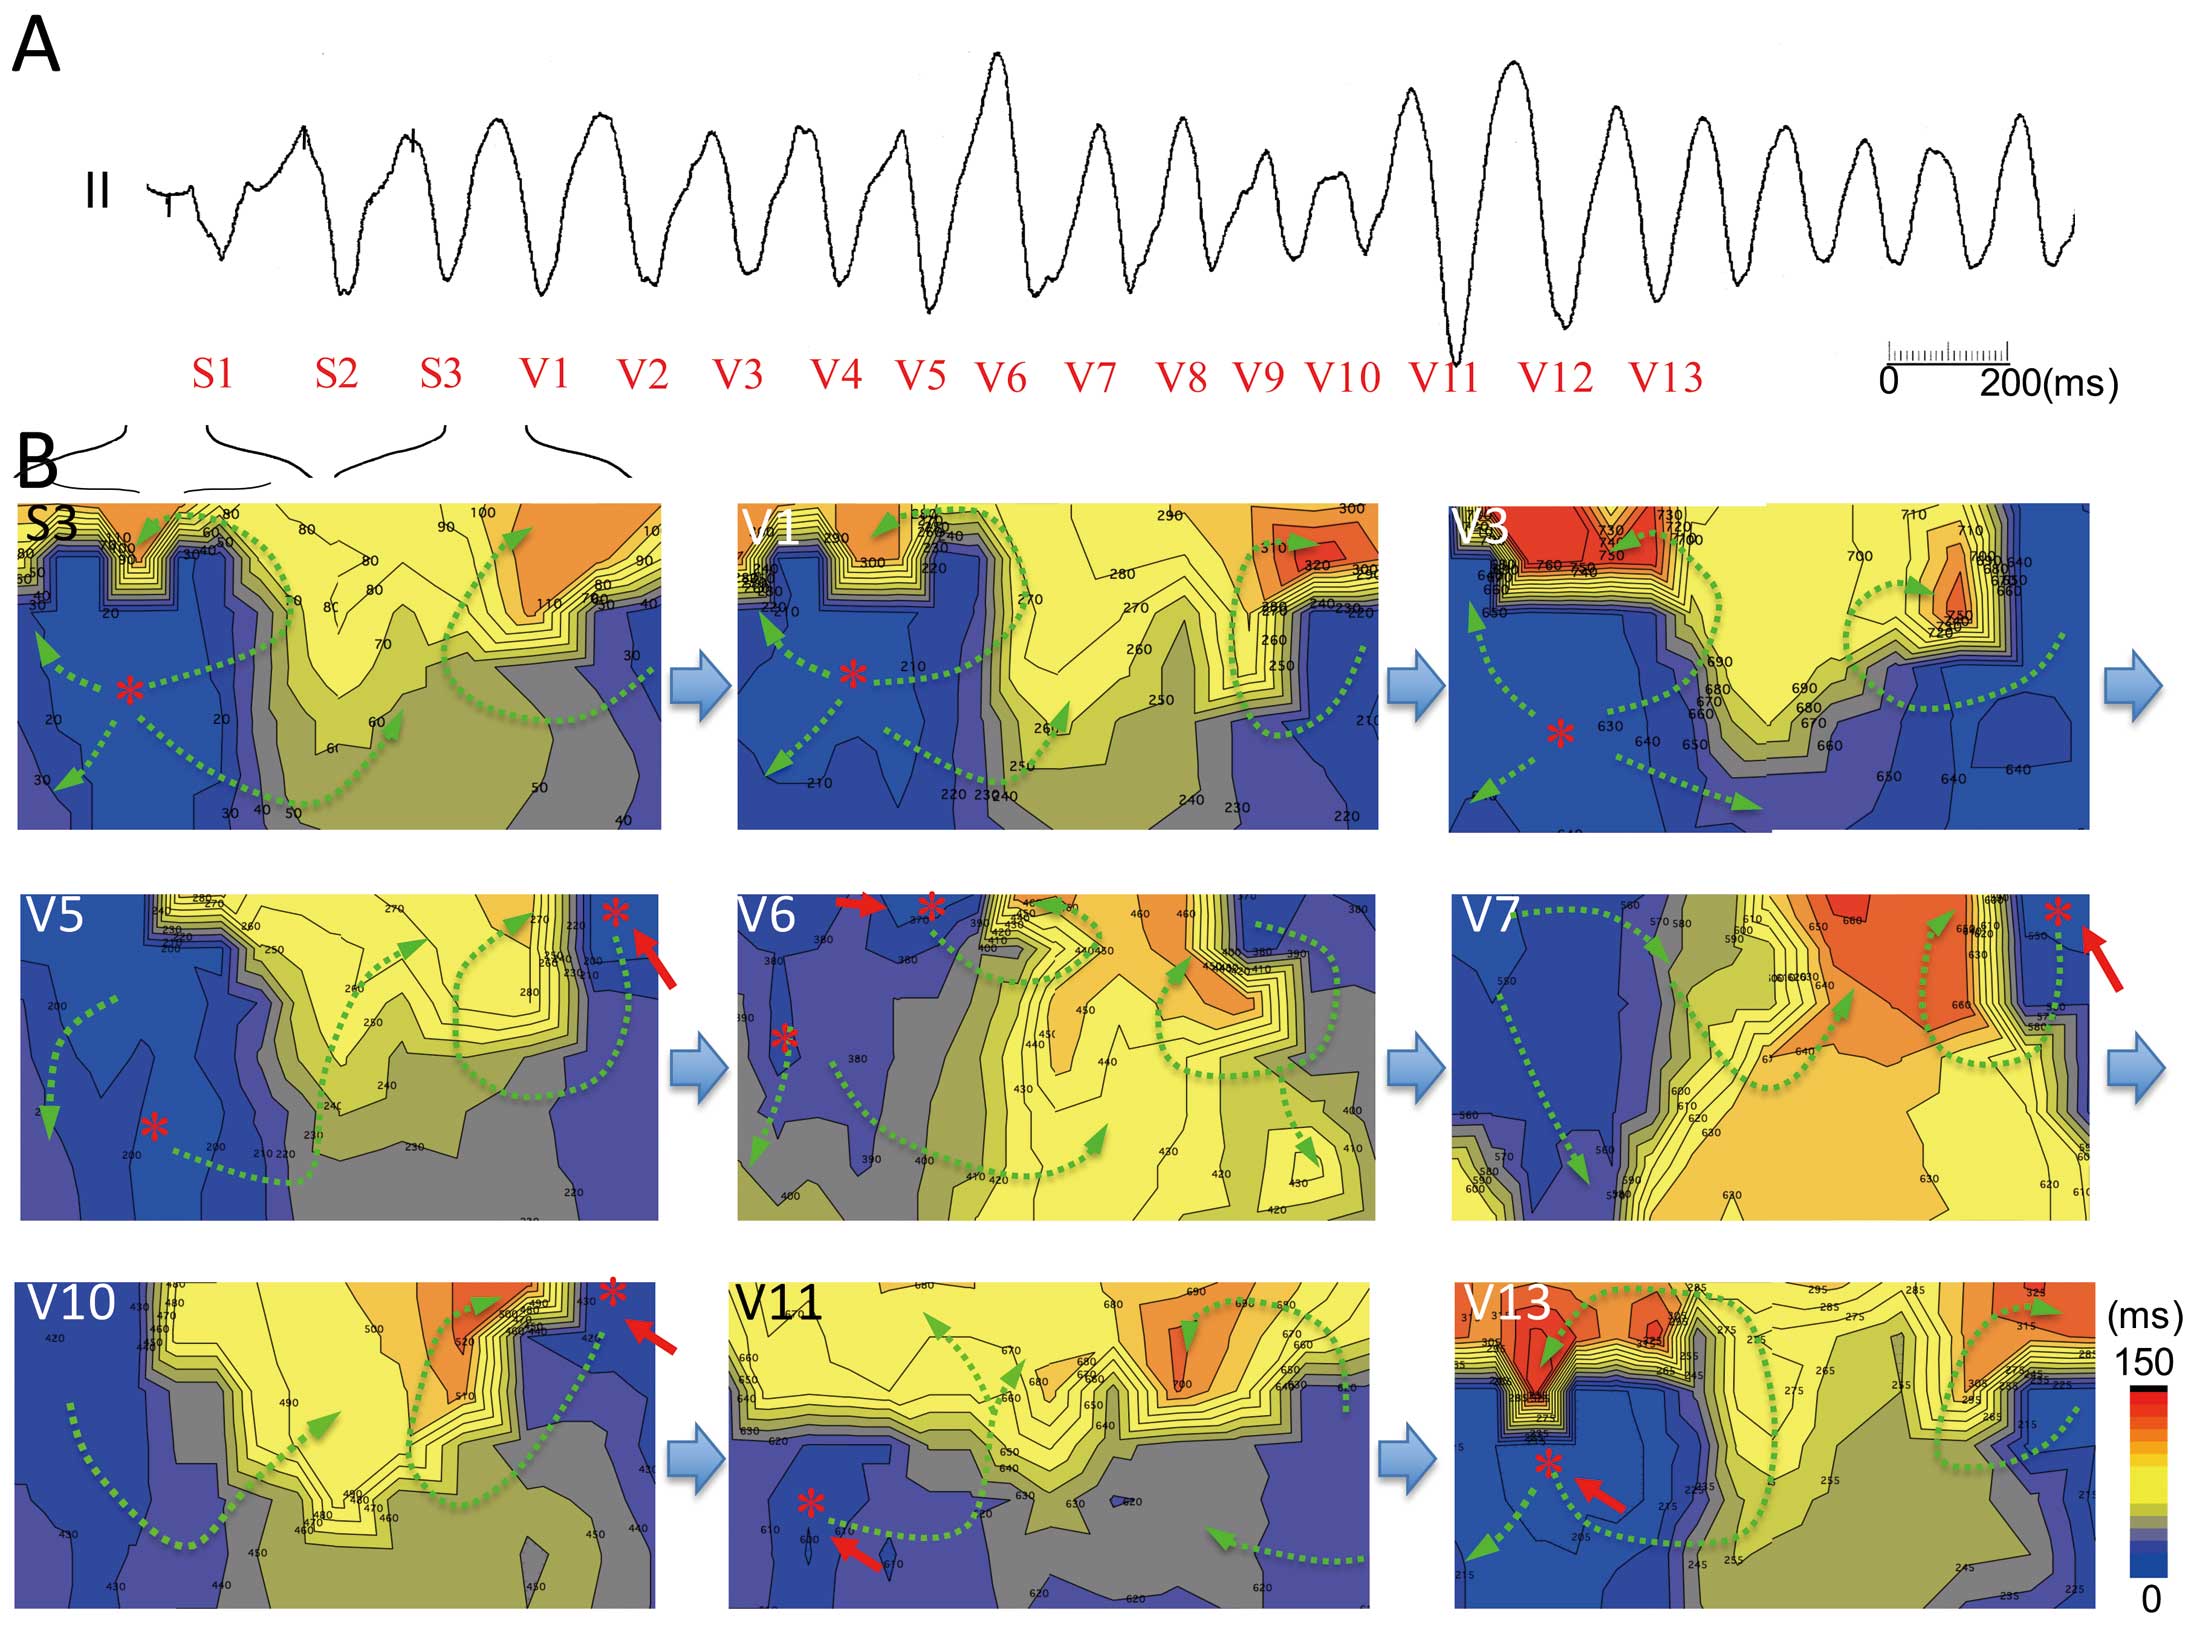
Figure 5
shows an example of the unstable part of VT resembling torsade de pointes induced at the RVOT. Activation propagated from the superior chest and high back at the extrastimulus beat (S3) and the initial 8 beats during the VT (V1–V8). Then, new earliest activation sites appeared at the right lower chest (RV anteroinferior, red arrow in V9), and competitive activation foci between the upper and lower chest were observed at beats V9–V12. Changes in the propagation pattern by competitive activation resulted in polymorphic QRS changes during VT. Then the earliest activation site returned to the superior chest (V13–V15) with a counterclockwise activation sequence on the chest. Polymorphic VTs with an unstable part had competitive activation from the superior and inferior chest, and they caused alterations in the direction of wavefront propagation.
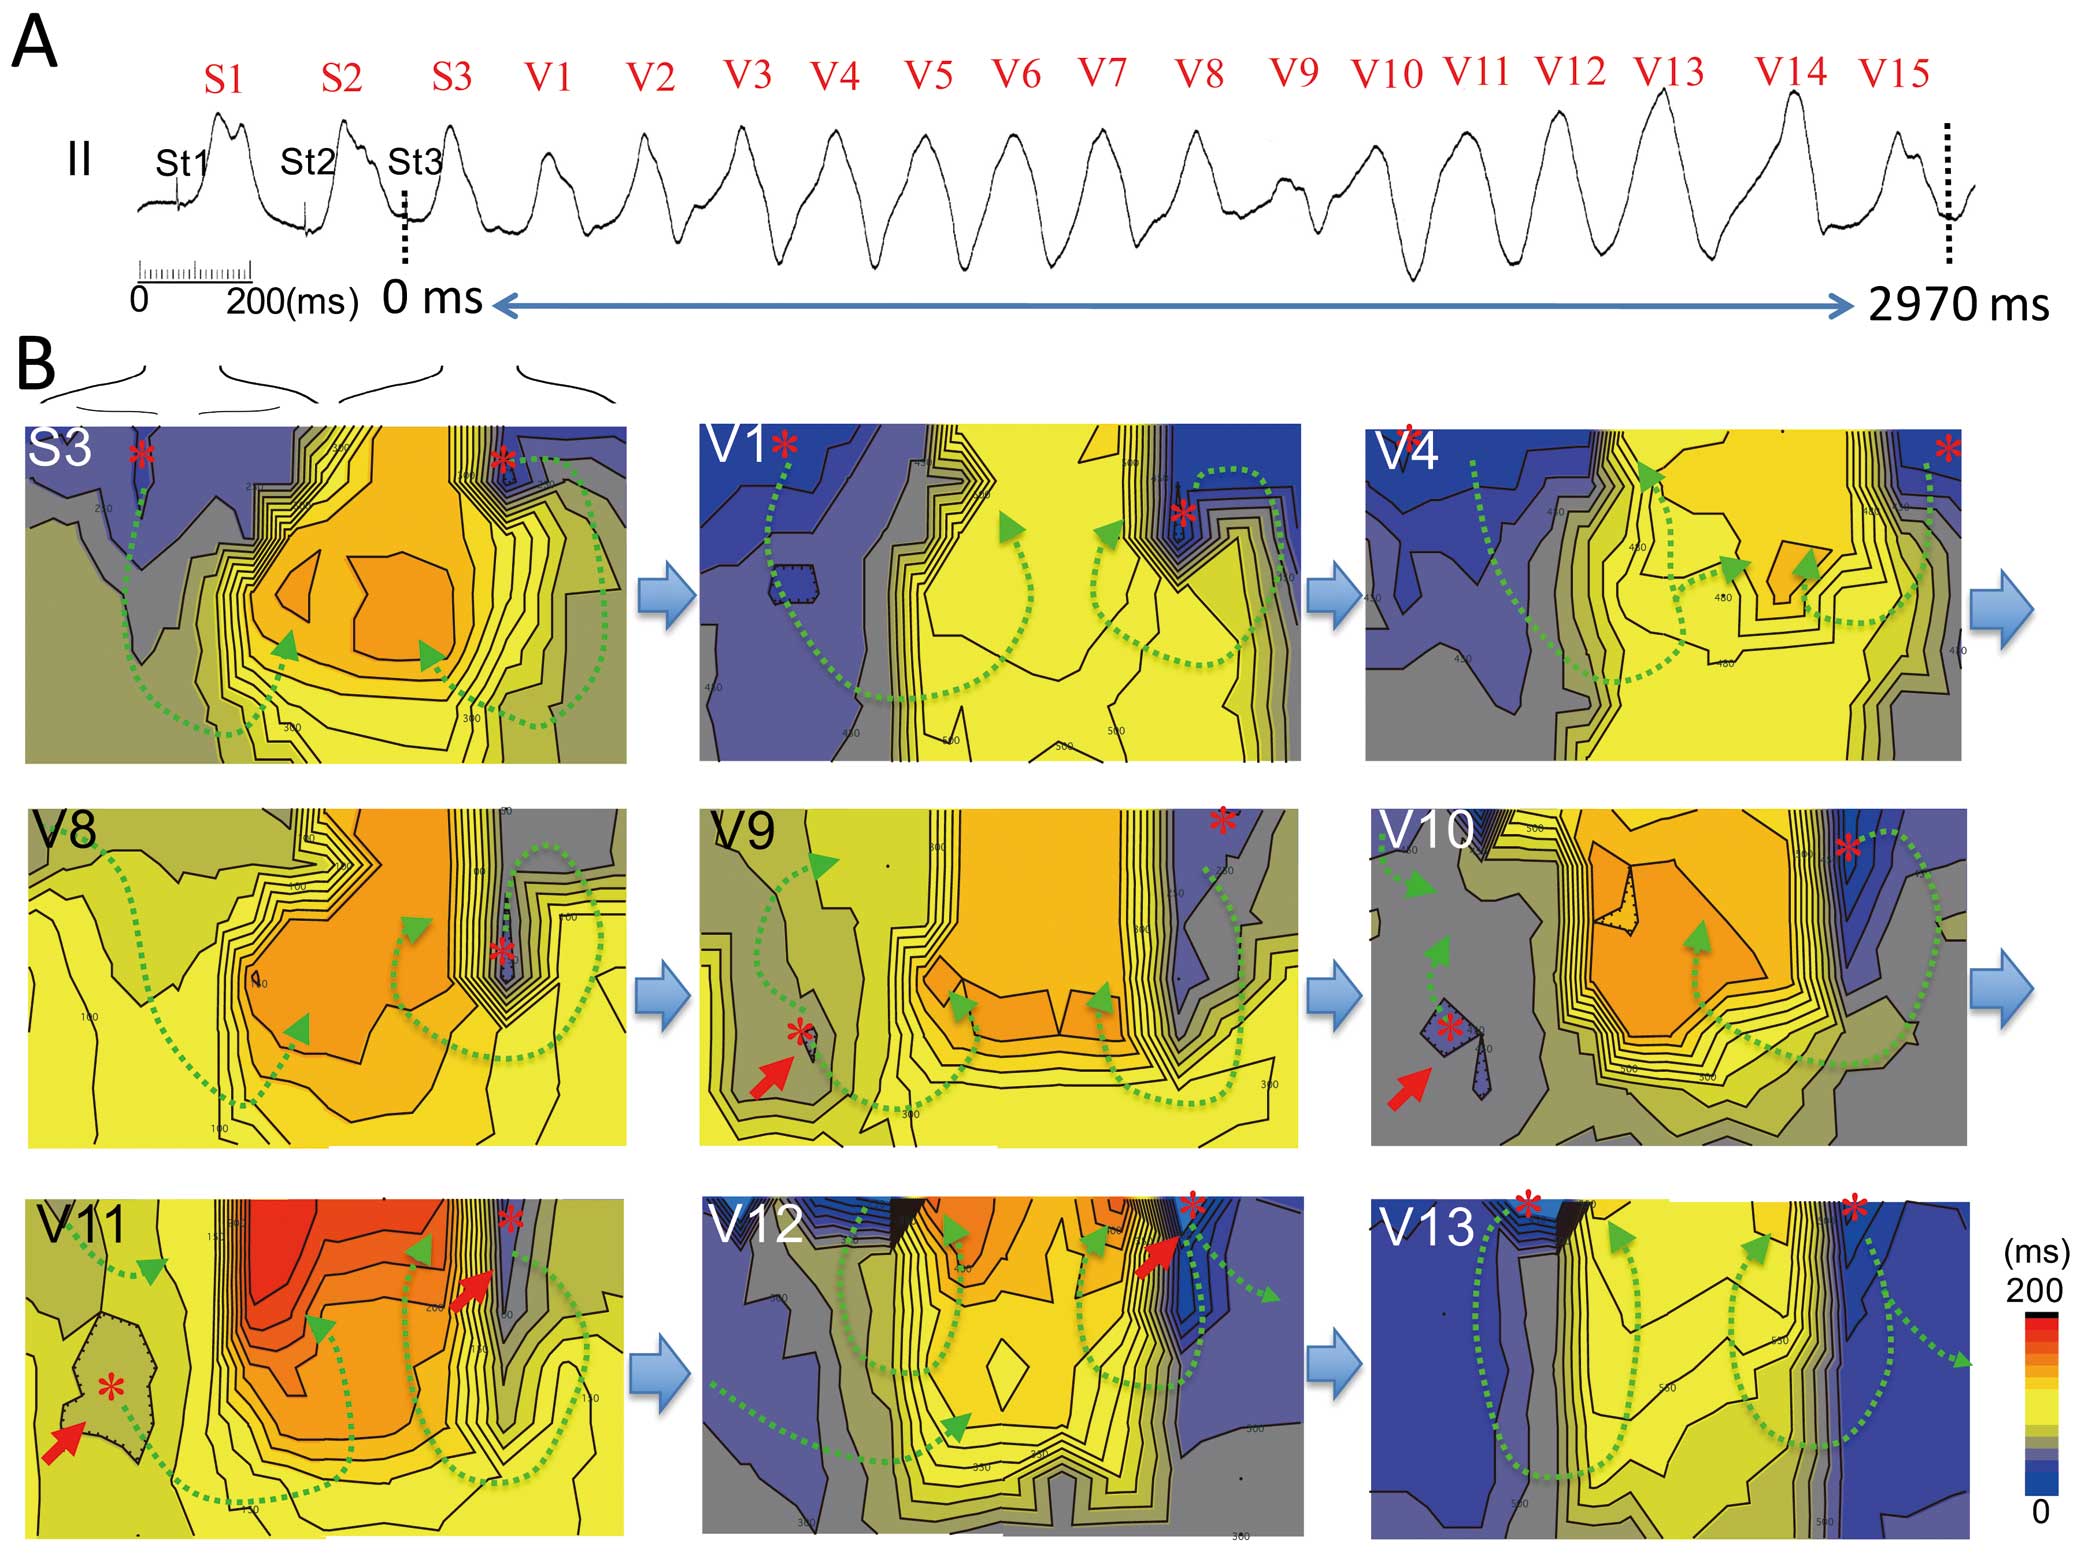
Figure 6
shows an induced polymorphic VT at the RVA in patient 11. Activation propagated from the right mid-chest (RVA) with crowded isochronal lines at the superior chest at an extrastimulus beat (S3) and initial 3 beats of induced VT (V1–V3). Then the earliest activation site moved from the right mid-chest to the upper chest (V4–V10) and the morphology of the QRS complex altered to unstable polymorphic VT.
After beat V10, the earliest activation site returned to the mid-chest in the subsequent beats (V11–V13).
Activation Pattern of Induced VF
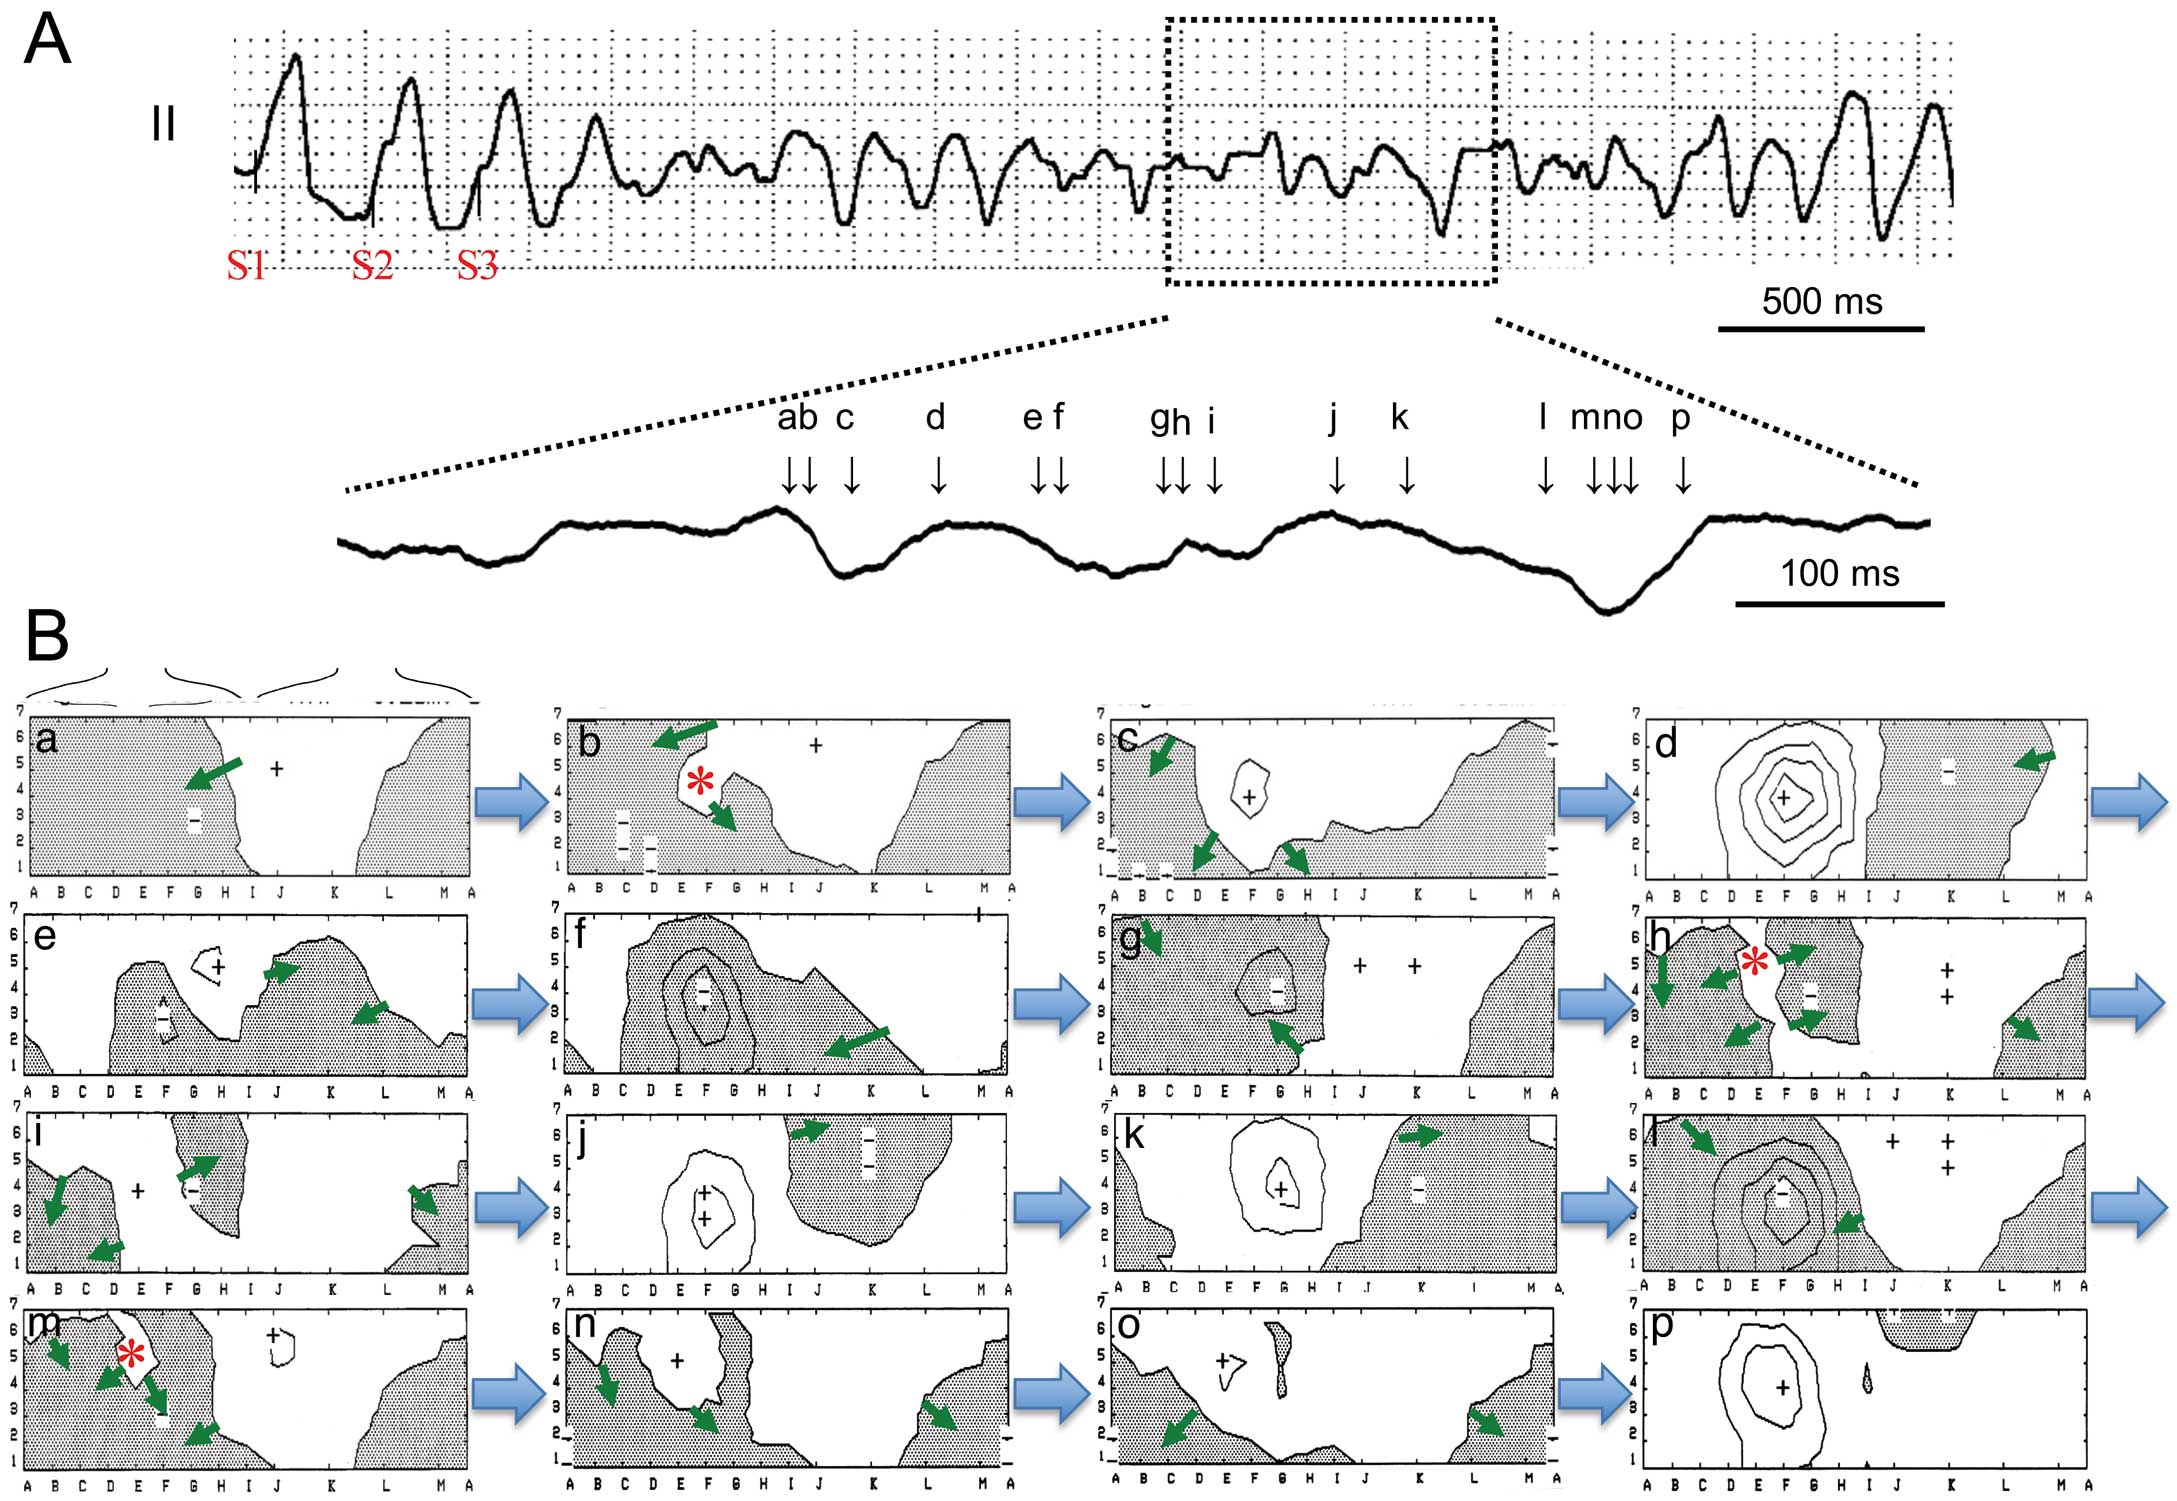
After degeneration of the QRS complex into VF, propagation of the excitation showed random movement with the formation of multiple wavefronts, resulting in a degenerated QRS complex (Figure 7;
Movie S1). The isolated depolarizing area, which was represented as a positive area in the potential map, frequently appeared at the superior chest (Figure 7B, maps
b,h
and
m).
Discussion
New Observations
This is the first study to evaluate the activation pattern of induced polymorphic VT/VF on BSM of patients with BrS. This study showed that a repetitive depolarization area appeared at the superior chest and propagated counterclockwise on the chest during induced polymorphic VT. Differences in propagation of excitation within the ventricles in each beat resulted in minor polymorphic QRS changes. Collision of the activations from 2 foci collapsed the activation sequence, resulting in spontaneous degeneration of the QRS morphology during polymorphic VT. Although activation propagated randomly and had multiple wavefronts during VF, a new depolarization area frequently appeared at the superior chest, indicating the RVOT. The activation of the superior chest was associated with the RVOT and it has an important role in maintenance of ventricular tachyarrhythmias in BrS.
Interpretation of the Localization of Potentials Recorded by BSM
Ventricular potentials are reflected to each part of the body surface and previous studies have tried to identify the localization of the ventricular waves from observations of BSM, such as localization of the accessary pathway18
and origin of the ventricular arrhythmias.19,20
Some imaging techniques showed that the superior chest and back can reflect potentials of the RVOT3,21
and that the type 1 ST elevation of BrS usually distributed at the superior chest.15
The body surface leads at the mid to right chest can represent RV potentials3,15
and the leads at the left side of the chest to the back can record potentials of the LV8,15
(Figure 1).
The present study showed that new activation frequently appeared at the superior chest, and went down to the inferior chest and turned to the left axilla and superior back during polymorphic VT, with subtle QRS morphological changes. The earliest activation site at the superior chest represents depolarization arising from the RVOT, which propagated to the inferior part of the RV and the LV, then returned to the area adjacent to the initial activation area (RVOT). Crowded isochronal lines at the superior chest and back may represent intraventricular conduction slowing. Wandering of the propagation course and conduction slowing resulted in minor polymorphic QRS changes during VT.
In some cases, the earliest activation appeared at the inferior chest. The activation pattern with the earliest activation site at the mid to inferior chest resembled activation of stimulus beats at the RVA. Then the region around the RVA/inferior is also an alternative arrhythmogenic site of induced polymorphic VTs. Movement, collision of 2 foci and changes in propagation course between the RVOT and RVA caused dynamic QRS morphological changes during polymorphic VT. The earliest activation site usually converged on an activation from the RVOT (Figure 6). During VF, excitation propagated randomly, but new activation seemed to arise from the RVOT (Figure 7).
Based on observations of ECG, multimodal imaging techniques,3,21–24
and clinical EPS,7,8,25–28
it has been believed that the RVOT is an arrhythmogenetic area that initiates lethal ventricular tachyarrhythmias in BrS. The present study revealed that the RVOT is important for maintenance of ventricular tachyarrhythmias induced by PES in addition to its role in the initiation of arrhythmias.
Interpretation of the Activation Sequence Recorded by BSM
BSM showed that new depolarization appeared at the RVOT and rotated on the chest and back (Figures 3,4). The activation patterns of the stable part of VT resembled that of artificial pacing at the RVOT. The latest activation sites appeared at the superior chest or back, which is adjacent to the initial activation area. During the unstable part of VT and polymorphic VT induced at the RVA, a new depolarization area frequently appeared at the mid to inferior chest (RVA or inferior RV) and competed with activation from the superior chest (Figures 5,6). The activation sequence of artificial pacing at the RVA also resembled this pattern (Figure 6).
A possible interpretation of the activation sequence during the stable part of induced VT is that repetitive focal firing at the RVOT propagated to other ventricular sites. Subtle changes in the earliest activation site and propagation course resulted in minor QRS morphological changes during VT. The RVA is an alternative firing site and competitive firing between the RVOT and RVA causes dynamic QRS morphological change.
Another interpretation is that rotation of the activation sequence on the chest and back represents the rotor of the polymorphic VT. Crowded isochronal lines appeared at the superior chest and superior back and they represent the activation core at the RVOT. Movement of the activation core and new appearance of the rotor at the RVA caused polymorphic QRS changes. Recently, Chaykovskaya et al reported that a rotor appeared at the RVOT during ajmaline-induced VF in a patient with BrS.29
Their report showed 1 or 2 rotors appeared with cores at stable positions of the RV and LV. From the observation of Chaykovskaya et al, the rotation of the depolarized area detected by BSM in the present study could be a rotor of the epicardium during polymorphic VT in BrS.
Mechanism of the Induced Polymorphic VT in BrS
We could not confirm in this study that the mechanism of the induced polymorphic VT was focal repetitive firing from RVOT or intraventricular macroreentry or more complex mechanisms involving endocardium. In some cases, a new depolarized area appeared at the superior chest (RVOT area) before the previous activation reached the left superior back (Figure S1). This pattern was observed in 12 of 18 episodes in which stable polymorphic VT was induced by RVOT pacing. This observation can be interpreted as a new activation appearing at the RVOT before the end of the previous activation. It does not deny macroreentry but it seems to be plausible that some of the polymorphic VT with stable QRS morphology originated from repetitive firing at the RVOT. Small reentrant circuits will appear as a focal firing pattern because of the relatively low resolution of the BSM system.
Phase 2 reentry is a possible mechanism of BrS. A canine model of BrS shows that the dynamic action potential heterogeneity at the RVOT generates a voltage gradient within the epicardium at phase 2 of the action potential and promotes functional reentry (phase 2 reentry).8–10
Phase 2 reentry occurs in tissues with an area of 1–2 cm2
and reentrant VT within such a small area can be a focal activation pattern in the BSM recordings.8,10
Recently, catheter ablation therapy in BrS revealed that the RVOT epicardium has abnormal potentials associated with myocardial fibrosis and conduction delay.30
In the conduction abnormality theory, the reentrant circuit that maintains rapid polymorphic ventricular arrhythmias can also be in a small area within the RVOT.31,32
We could not determine the mechanism of BrS, but our data indicated that the RVOT has a pivotal role in maintenance of ventricular arrhythmias and thus contains a substrate for both initiation and as a driver of ventricular tachyarrhythmias in BrS.
Study Limitations
We observed movement of body surface potentials during polymorphic VT or VF induced by PES and did not evaluate spontaneous occurrence of ventricular arrhythmias in patients with BrS. Thus the maintenance mechanism could be different from that of the spontaneous arrhythmias.
A BSM was constructed from data recorded by electrodes located on the anterior chest and back. The distance between 2 electrodes was 1–2 cm, and the resolution of the activation sequence in BSM therefore had a limitation for determining the small reentry mechanism. High-resolution mapping on the ventricular surface is needed to determine the mechanism of ventricular tachyarrhythmias. We speculate a correlation of the body surface area with the ventricular region based on previous BSM studies and activation pattern of the ventricular pacing.
We calculated the local activation time of ventricular tachyarrhythmias as the interval between the extrastimulus and the peak negative dV/dT of the QRS complex (intrinsicoid deflection). The intrinsicoid deflection in the body surface unipolar electrogram does not accurately reflect the activation time of the closest epicardial surface of the ventricle. The electrograms in BSM should be a summation of the activations at the endo- and epicardium and intraventricular septum. To evaluate the accuracy of the activation time in BSM, we compared the local activation times in the BSM and the endocardial activation times at each site. We found a positive correlation between the 2 activation times (Figure S2). The activation times in BSM were not completely coincident with the local endocardial activation times, but both activation times had positive concordance. Although evaluation of the intrinsicoid deflection of the BSM has limitations and its interpretation requires caution, it can be used to visualize ventricular activation.
Conclusions
Depolarization area rotation from the RVOT was observed during ventricular tachyarrhythmias in patients with BrS. Conduction slowing within the ventricle and competitive firing from other ventricular sites caused dynamic polymorphic changes in QRS morphology.
Acknowledgments
This study was supported by JSPS KAKENHI (24591051 and 15K09082, to H.M.) and Grants from the Ministry of Health, Labor and Welfare of Japan for Clinical Research on Intractable Diseases (H26-040 and H24-033 to H.M.) and Tailor-made Medical Treatment Program with the BioBank Japan Project (BBJ) from Japan Agency for Medical Research and development, AMED.
Conflict of Interest Disclosure
H.M. and N.N. are affiliated with an endowed department by Japan Medtronic Inc. Others do not have COI.
Supplementary Files
Supplementary File 1
Movie S1.
Activation sequence during ventricular fibrillation shown in Figure 7.
Supplementary File 2
Figure S1.
Repetitive firing from the right ventricular outflow tract (RVOT).
Figure S2.
Correlation between the activation times in body surface mapping (BSM) and endocardial activation times during polymorphic ventricular tachycardia (VT) with stable part.
Please find supplementary file(s);
http://dx.doi.org/10.1253/circj.CJ-16-0124
References
- 1.
Antzelevitch C, Brugada P, Borggrefe M, Brugada J, Brugada R, Corrado D, et al. Brugada syndrome: Report of the second consensus conference: Endorsed by the Heart Rhythm Society and the European Heart Rhythm Association. Circulation 2005; 111: 659–670.
- 2.
Okamura H, Kamakura T, Morita H, Tokioka K, Nakajima I, Wada M, et al. Risk stratification in patients with Brugada syndrome without previous cardiac arrest: Prognostic value of combined risk factors. Circ J 2015; 79: 310–317.
- 3.
Nagase S, Hiramatsu S, Morita H, Nishii N, Murakami M, Nakamura K, et al. Electroanatomical correlation of repolarization abnormalities in Brugada syndrome: Detection of type 1 electrocardiogram in the right ventricular outflow tract. J Am Coll Cardiol 2010; 56: 2143–2145.
- 4.
Nagase S, Kusano KF, Morita H, Fujimoto Y, Kakishita M, Nakamura K, et al. Epicardial electrogram of the right ventricular outflow tract in patients with the Brugada syndrome: Using the epicardial lead. J Am Coll Cardiol 2002; 39: 1992–1995.
- 5.
Hisamatsu K, Kusano KF, Morita H, Takenaka S, Nagase S, Nakamura K, et al. Relationships between depolarization abnormality and repolarization abnormality in patients with Brugada syndrome: Using body surface signal-averaged electrocardiography and body surface maps. J Cardiovasc Electrophysiol 2004; 15: 870–876.
- 6.
Nademanee K, Veerakul G, Chandanamattha P, Chaothawee L, Ariyachaipanich A, Jirasirirojanakorn K, et al. Prevention of ventricular fibrillation episodes in Brugada syndrome by catheter ablation over the anterior right ventricular outflow tract epicardium. Circulation 2011; 123: 1270–1279.
- 7.
Morita H, Fukushima-Kusano K, Nagase S, Takenaka-Morita S, Nishii N, Kakishita M, et al. Site-specific arrhythmogenesis in patients with Brugada syndrome. J Cardiovasc Electrophysiol 2003; 14: 373–379.
- 8.
Morita H, Zipes DP, Fukushima-Kusano K, Nagase S, Nakamura K, Morita ST, et al. Repolarization heterogeneity in the right ventricular outflow tract: Correlation with ventricular arrhythmias in Brugada patients and in an in vitro canine Brugada model. Heart Rhythm 2008; 5: 725–733.
- 9.
Yan GX, Antzelevitch C. Cellular basis for the Brugada syndrome and other mechanisms of arrhythmogenesis associated with ST-segment elevation. Circulation 1999; 100: 1660–1666.
- 10.
Morita H, Zipes DP, Morita ST, Wu J. Differences in arrhythmogenicity between the canine right ventricular outflow tract and anteroinferior right ventricle in a model of Brugada syndrome. Heart Rhythm 2007; 4: 66–74.
- 11.
Aiba T, Shimizu W, Hidaka I, Uemura K, Noda T, Zheng C, et al. Cellular basis for trigger and maintenance of ventricular fibrillation in the Brugada syndrome model: High-resolution optical mapping study. J Am Coll Cardiol 2006; 47: 2074–2085.
- 12.
Ikeda T, Sakurada H, Sakabe K, Sakata T, Takami M, Tezuka N, et al. Assessment of noninvasive markers in identifying patients at risk in the Brugada syndrome: Insight into risk stratification. J Am Coll Cardiol 2001; 37: 1628–1634.
- 13.
Sacher F, Jesel L, Jais P, Haissaguerre M. Insight into the mechanism of Brugada syndrome: Epicardial substrate and modification during ajmaline testing. Heart Rhythm 2014; 11: 732–734.
- 14.
Priori SG, Wilde AA, Horie M, Cho Y, Behr ER, Berul C, et al. HRS/EHRA/APHRS expert consensus statement on the diagnosis and management of patients with inherited primary arrhythmia syndromes: Document endorsed by HRS, EHRA, and APHRS in May 2013 and by ACCF, AHA, PACES, and AEPC in June 2013. Heart Rhythm 2013; 10: 1932–1963.
- 15.
Shimizu W, Matsuo K, Takagi M, Tanabe Y, Aiba T, Taguchi A, et al. Body surface distribution and response to drugs of ST segment elevation in Brugada syndrome: Clinical implication of eighty-seven-lead body surface potential mapping and its application to twelve-lead electrocardiograms. J Cardiovasc Electrophysiol 2000; 11: 396–404.
- 16.
Yamaki M, Ikeda K, Kubota I, Nakamura K, Hanashima K, Tsuiki K, et al. Improved diagnostic performance on the severity of left ventricular hypertrophy with body surface mapping. Circulation 1989; 79: 312–323.
- 17.
El-Sherif N. Polymorphic ventricular tachycardia. In: Podrid PJ KP, editor. Cardiac arrhythmia, mechanisms, diagnosis, and management. Baltimore: Williams & Wilkins, 1995; 936–950.
- 18.
Kamakura S, Shimomura K, Ohe T, Matsuhisa M, Toyoshima H. The role of initial minimum potentials on body surface maps in predicting the site of accessory pathways in patients with Wolff-Parkinson-White syndrome. Circulation 1986; 74: 89–96.
- 19.
Hayashi H, Watabe S, Takami K, Yabe S, Uematsu H, Mizutani M, et al. Sites of origin of ventricular premature beats in patients with and without cardiovascular disease evaluated by body surface mapping. J Electrocardiol 1988; 21: 137–146.
- 20.
Kamakura S, Shimizu W, Matsuo K, Taguchi A, Suyama K, Kurita T, et al. Localization of optimal ablation site of idiopathic ventricular tachycardia from right and left ventricular outflow tract by body surface ECG. Circulation 1998; 98: 1525–1533.
- 21.
Veltmann C, Papavassiliu T, Konrad T, Doesch C, Kuschyk J, Streitner F, et al. Insights into the location of type I ECG in patients with Brugada syndrome: Correlation of ECG and cardiovascular magnetic resonance imaging. Heart Rhythm 2012; 9: 414–421.
- 22.
Matsuo K, Shimizu W, Kurita T, Inagaki M, Aihara N, Kamakura S. Dynamic changes of 12-lead electrocardiograms in a patient with Brugada syndrome. J Cardiovasc Electrophysiol 1998; 9: 508–512.
- 23.
Veltmann C, Schimpf R, Echternach C, Eckardt L, Kuschyk J, Streitner F, et al. A prospective study on spontaneous fluctuations between diagnostic and non-diagnostic ECGs in Brugada syndrome: Implications for correct phenotyping and risk stratification. Eur Heart J 2006; 27: 2544–2552.
- 24.
Take Y, Morita H, Wu J, Nagase S, Morita S, Toh N, et al. Spontaneous electrocardiogram alterations predict ventricular fibrillation in Brugada syndrome. Heart Rhythm 2011; 8: 1014–1021.
- 25.
Kanda M, Shimizu W, Matsuo K, Nagaya N, Taguchi A, Suyama K, et al. Electrophysiologic characteristics and implications of induced ventricular fibrillation in symptomatic patients with Brugada syndrome. J Am Coll Cardiol 2002; 39: 1799–1805.
- 26.
Morita H, Nagase S, Miura D, Miura A, Hiramatsu S, Tada T, et al. Differential effects of cardiac sodium channel mutations on initiation of ventricular arrhythmias in patients with Brugada syndrome. Heart Rhythm 2009; 6: 487–492.
- 27.
Haissaguerre M, Extramiana F, Hocini M, Cauchemez B, Jais P, Cabrera JA, et al. Mapping and ablation of ventricular fibrillation associated with long-QT and Brugada syndromes. Circulation 2003; 108: 925–928.
- 28.
Wada T, Nagase S, Morita H, Nakagawa K, Nishii N, Nakamura K, et al. Incidence and clinical significance of Brugada syndrome masked by complete right bundle-branch block. Circ J 2015; 79: 2568–2575.
- 29.
Chaykovskaya MK, Fetisova EA, Yakoleva MV, Kalinin VV, Zaklyazminskaya EV. Brugada syndrome: Possibilities of the use of noninvasive electrocardiographic mapping: A case report. Kardiologiia 2015; 55: 100–103 (in Russian).
- 30.
Nademanee K, Raju H, de Noronha SV, Papadakis M, Robinson L, Rothery S, et al. Fibrosis, connexin-43, and conduction abnormalities in the Brugada syndrome. J Am Coll Cardiol 2015; 66: 1976–1986.
- 31.
Krummen DE, Hayase J, Morris DJ, Ho J, Smetak MR, Clopton P, et al. Rotor stability separates sustained ventricular fibrillation from self-terminating episodes in humans. J Am Coll Cardiol 2014; 63: 2712–2721.
- 32.
Pandit SV, Jalife J. Rotors and the dynamics of cardiac fibrillation. Circ Res 2013; 112: 849–862.
- 33.
Wilde AA, Postema PG, Di Diego JM, Viskin S, Morita H, Fish JM, et al. The pathophysiological mechanism underlying Brugada syndrome: Depolarization versus repolarization. J Mol Cell Cardiol 2010; 49: 543–553.