Abstract
The use of mass spectrometry (MS)-dependent protein research is increasing in the cardiovascular sciences. A major reason for this is the versatility of and ability for MS technologies to accommodate a variety of biological questions such as those pertaining to basic research and clinical applications. In addition, mass spectrometers are becoming easier to operate, and require less expertise to run standard proteomics experiments. Nonetheless, despite the increasing interest in proteomics, many non-expert end users may not be as familiar with the variety of mass spectrometric tools and workflows available to them. We therefore review the major strategies used in unbiased and targeted MS, while providing specific applications in cardiovascular research. Because MS technologies are developing rapidly, it is important to understand the core concepts, strengths and weaknesses. Most importantly, we hope to inspire the further integration of this exciting technology into everyday research in the cardiovascular sciences. (Circ J 2016; 80: 1674–1683)
Many developments in the field of proteomics have come from the yeast model system1–3
and from cancer research (Figure 1A). In addition, immortalized cells (eg, HeLa, HEK293T, RAW264.7, THP-1) have provided mass spectrometrists ample protein with limited variability across biological replicates, factors that are important to establish technical reproducibility when novel workflows are being developed. The cardiovascular sciences have also influenced and benefited from developments in unbiased and targeted mass spectrometry (MS) approaches (Figure 1B). Research pertaining to the heart and its metabolism,4,5
extracellular matrix remodeling6,7
posttranslational modification in vascular development.8
lipoprotein content and metabolism,9–11
and platelet function12,13
have thrived as a result of the application of MS technologies. Recently, cardiovascular disease research has taken advantage of the readily accessible plasma pool for biomarker- and target-based studies. Tissues affected by heart failure, atherosclerosis and aortic aneurysms are in direct contact with the circulatory system, which increases the likelihood that proteins either causal or consequential to these pathologies can be detected in plasma.14

Addressing the Large Dynamic Range in Protein Concentrations
The ongoing development of MS is in part influenced by the drive to identify and quantify as many proteins as possible in a given sample.1,15–17
A major challenge in proteomics, however, is that the dynamic range of a typical deep sequencing analysis (5–6 orders in magnitude) does not reflect the more extensive dynamic range of protein abundance that is as extensive as 12 orders in plasma.18–20
In addition, cytoskeletal and extracellular matrix proteins dominate samples, masking the less abundant transcription factors and signaling molecules that are usually of interest.1,18,19
Depletion of these highly abundant proteins, such as albumin from plasma, is required to sequence deep into the proteome (Figure 1C).21–23
Also, the less abundant proteins can be enriched by cellular fractionation methods such as those that separate cellular compartments or those that use immunopurification strategies (Figure 1C).24,25
The dynamic range capabilities of MS continually improve, but the identification and quantification of low-abundance proteins still depend on sample preparation procedures that shift these low signals into the detection range of the instrument either by depletion and/or enrichment approaches.
Protein and Peptide Separation Methods
Protein isolation needs to take into consideration the sample source, cell culture or tissue.26
Often, the proteomes of 2 or more sets of tissues or samples are compared (Figure 2A), for example, healthy vs. diseased tissues. A typical proteomics experiment does not measure the protein itself, but its peptide representatives that are generated through digestion by a known proteolytic enzyme.27
The proteins are thus inferred by their detected peptides. Trypsin and Lys-C are the most commonly used proteolytic enzymes for proteomics. However, in order to increase protein coverage, additional proteases, such as chymotrypsin and Asp-N, can be used in parallel samples preparations.28,29

Before proteolysis, the proteome can be fractionated in-gel to reduce sample complexity (Figure 2B).30
The advantage of in-gel digestion is that the molecular mass reference is available; thus protein isoforms that share peptides but have distinct molecular masses can be differentiated from each other. Initially, 2D electrophoresis technology was a common separation method for subsequent MS analysis. In this method, proteins are separated based on charge and then by molecular weight31
(Figure 2B). 2D gel electrophoresis was used in an investigation into the effects of nafamostat mesylate, a serine protease inhibitor of inflammation, post myocardial ischemia-reperfusion (MI/R) in rabbits.32
The authors analyzed the proteomes of myocardial tissue in 3 groups: sham, MI/R and MI/R plus mafamostat mesylate/inhibitor. A total of 10 spots with differential staining were excised and analyzed by MS; 2 of the 10 proteins were identified as superoxide dismutase and αB-crystallin. Each protein decreased in MI/R but was restored after MI/R+inhibitor treatment.32
1D gel electrophoresis is now more commonly used because less protein input is required when compared with 2D gels, and multiple samples can be run simultaneously on a single gel (Figure 2B). Consequently, thousands of proteins can be compared across conditions. The alternative to in-gel proteolysis is the in-solution procedure (Figure 2C), with its major advantage of an increase in peptide yield because the protein substrates and peptide products are not intercalated in the gel matrix. The disadvantage is that all protein isoforms are intermixed so it is very challenging to rationalize from which isoform specific peptides are derived. Nonetheless, in-solution proteolysis is often preferred because the high peptide yield is conducive to downstream peptide fractionation methods such as phosphopeptide enrichment, isoelectric focusing, cation/anion exchange and reverse phase separation technologies (Figure 2D).5,33,34
Global Quantitative Proteomics Approaches for Basic Science Research
Quantitative methods fall into 1 of 2 categories: label (the use of stable isotopes) or label-free (Figures 3A–C). The major advantage of labeling strategies is that individual protein/peptide pools are differentially tagged so that they can be combined/multiplexed for subsequent fractionation and MS analysis (Figures 2D,3D).
Label-Free
In this approach, the peptides from 2 or more distinct samples are injected into the mass spectrometer separately (Figure 3A). Relative changes in the abundance of each protein are estimated by either the area under the curve (AUC) of their peptides’ extracted ion chromatograms, or by the number of times the proteins’ peptides have been sequenced (spectral counting).35
In general, the more abundant the protein, the more likely its peptides will predominate the signal and sequencing output (Figure 4A).

A recent study monitored the changes in the proteome during the transition from human embryonic stem cells (hESCs) to cardioprogenitor cells (CPCs) to cardiomyocytes (CMs) using the AUC label-free approach.36
The researchers performed control experiments to ensure that differentiation into CMs was successful, including fluorescence-activated cell sorting for cardiomyocyte troponin to verify that the majority of cells had acquired the CM phenotype. Reverse-transcriptase polymerase chain reaction verified the expression of hallmark genes such as
SOX2
(hESCs),
BRYT
(CPCs) and
MYH6
(CMs) during differentiation. Label-free quantitative proteomics confirmed SOX2 in hESCs whereas MYH7 was most abundant in the CMs (Figure 4B). A more global data analysis using gene ontology terms confirmed the enrichment of WNT-related pathways expected for the CPC phenotype, and those related to muscle function for the CMs. Analysis of positive controls in the proteomics data validated the quality of the experiment. As a result, candidate novel regulators of CM differentiation, for example DAB2, a negative regulator of WNT signaling, are more likely to be true hits.36
SILAC
Cells can be cultured in conditions under which they are dependent on exogenous supplies of amino acids that are either unlabeled (12C and 14N, light) or stable isotope-labeled (13C, 15N and sometimes 2H/deuterium) (Figure 4C).37–39
Stable isotopic labeling by amino acids in cell culture (SILAC) requires conversion of a cell line into its labeled form, a process that takes approximately 5–6 passages to complete. The differentially labeled cells can be combined early in the workflow and processed simultaneously so that oxidation of peptides or sample loss during peptide preparation will be consistent in both samples; thus differences in peptide abundance are from differences in the biological state rather than those pertaining to sample handling. Labeling of lysine with 13C and 15N incurs no discernible changes in the physicochemical properties of the peptide/protein, so both peptides co-elute and enter the mass spectrometer simultaneously. However, their differences in mass are revealed by the MS1 scan (Figure 4C).
A double (light and heavy) and triple (light, medium and heavy labels) SILAC approach used for mouse brown adipocytes was combined with anti-tyrosine phosphorylation immuno-purification to identify proteins with increased phosphorylation post insulin treatment.40
In order to catch the very early phosphorylation signaling events, the samples were analyzed between 0 and 20 min using 2 sets of triple SILAC. This kinetics analysis revealed that phosphorylation occurred as early as 1–5 min (Figure 4D). Insulin receptor and insulin receptor substrate 1 phosphorylation were induced within 1 min, whereas ERK-1/2 peaked at 5 min. The ability to resolve these changes in phosphorylation over intervals of minutes emphasizes the power of quantitative proteomics to detect early signaling cascade events.
Tandem Mass Tagging
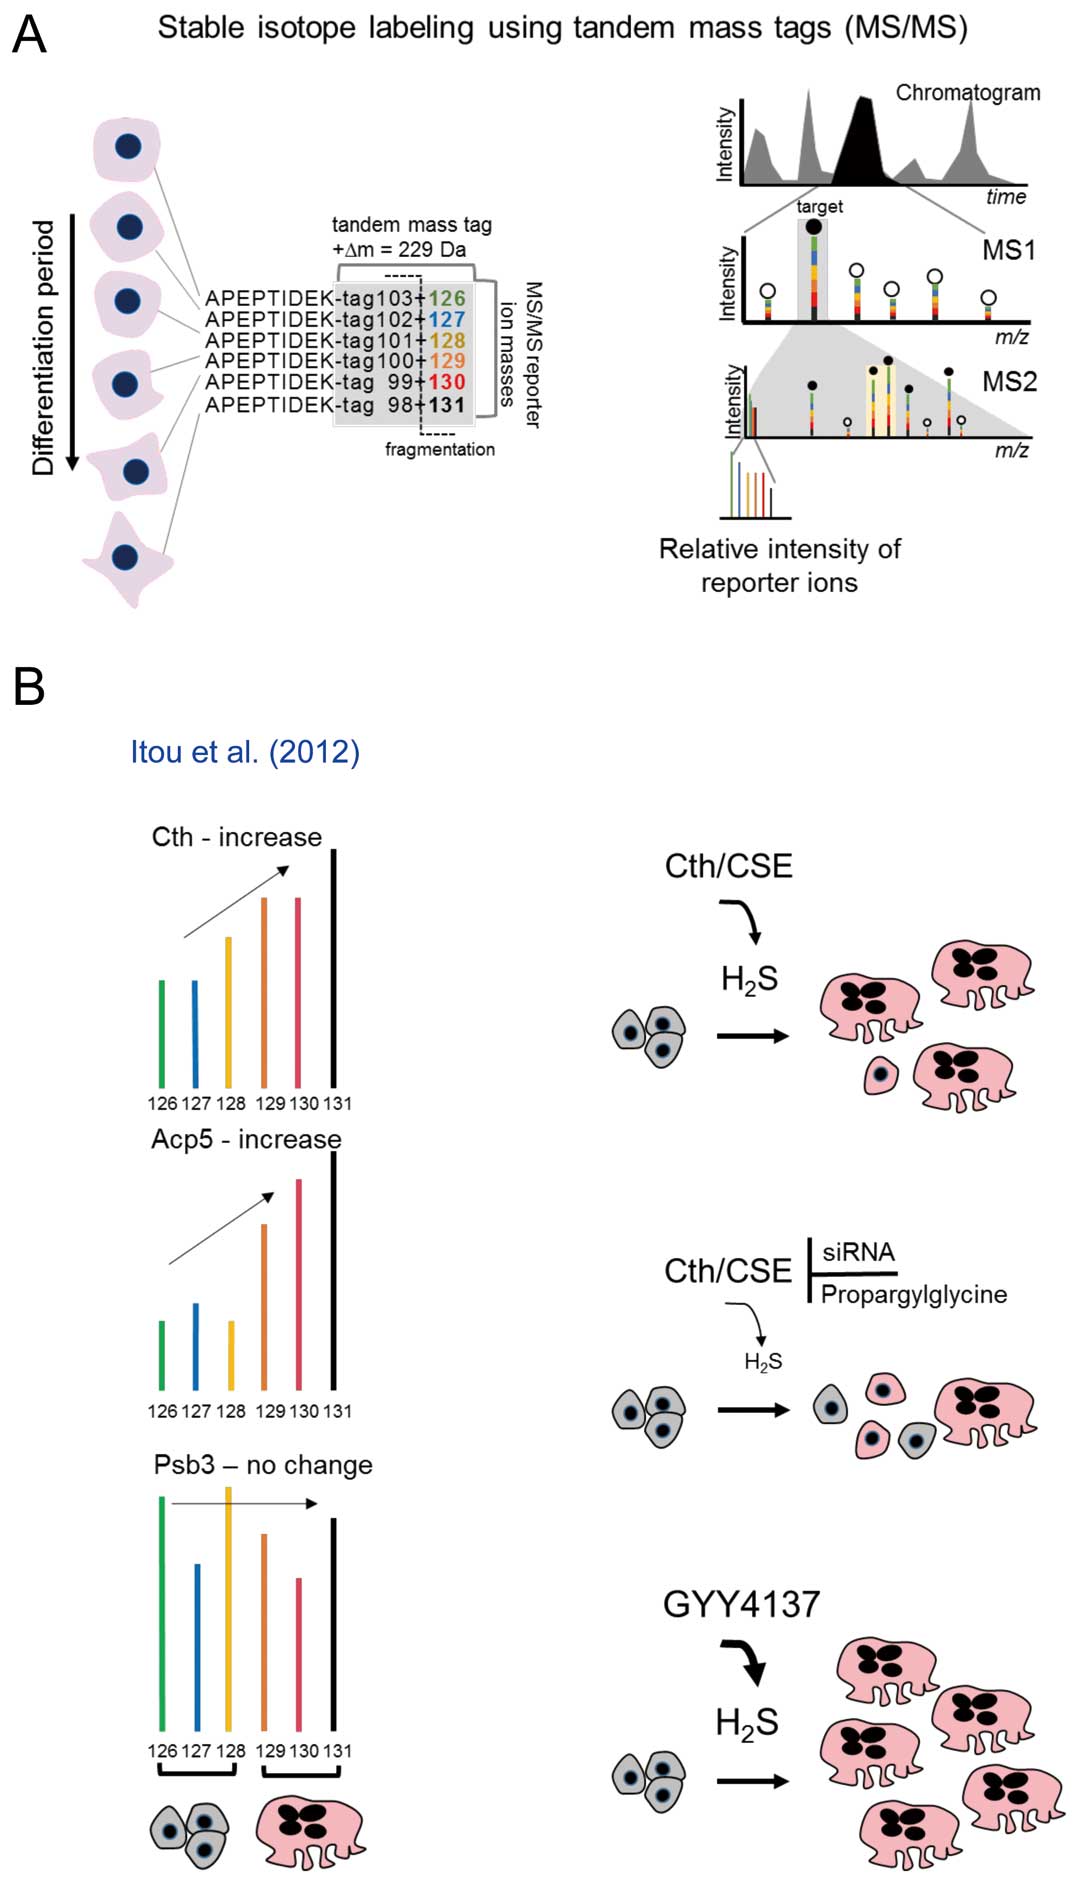
Although the SILAC approach is very useful, a major disadvantage is the requirement for cells to replicate. For samples such as primary cells or tissues, the more practical approach is isobaric tandem mass tagging of peptides using, for instance, TMT (tandem mass tags) or iTRAQ (isobaric tags for relative and absolute quantification) reagents.41–44
This method uses isotope-labeled amine-reactive chemical tags to label peptides derived from distinct samples (Figure 5A). Most laboratories analyze up to 6 samples; however, recent advancements permit up to 10 samples.45
The net mass of each chemical tag is the same for each sample’s labeled peptide. Consequentially, all labeled peptides appear as a single peak in the MS1 (Figure 5A) and are thereby selected simultaneously for fragmentation. In the MS/MS scan (MS2), the tags fragment to produce 1 of 6 reporter ions with an incremental mass of 1 Da, through incorporation of an increasing number of 13C and 15N isotopes (increasing from 126 to 131 Da,
Figure 5A). Their relative intensities are proportional to the relative abundance of their respective peptides.
The iTRAQ method was used, for example, to monitor the myocardial proteome in response to the hypothermic cardiopulmonary bypass procedure,46
and to evaluate the potential energy metabolism status of atrial tissues, primarily the left atrium, from patients with valvular disease with and without atrial fibrillation.47
In the latter study, the left atrial tissues of atrial fibrillation patients exhibited a decrease in several proteins related to energy metabolism, such as electron transport and ATP metabolism, demonstrating that the proteome can be a readout for the electrical status of the atrium. Itou et al from our laboratory investigated the processes that regulate osteoclastogenesis using the TMT method.48
The aim was to identify novel regulators of osteoclastogenesis. In that study a TMT 6-plex endpoint analysis was performed on osteoclasts derived from mouse macrophage-like RAW264.7 cells. In order to evaluate the reproducibility of the cell culture conditions and the TMT approach, 2 TMT 6-plex analyses comprising 3 differentiated osteoclasts induced by receptor activator of nuclear factor kappa-B ligand (RANKL) vs. 3 control (no RANKL) cultures were performed. Consistent data within and between each TMT experiment was demonstrated, as confirmed by known osteoclast proteins such as tissue alkaline phosphatase (Acp5). These reproducible results identified the novel osteoclast-induced protein cystathionine γ-lyase (Cth) (Figure 5B). Further analysis determined that Cth activity, through the production of hydrogen sulfide (H2S), is required for osteoclastogenesis. Whether Cth activity was reduced by either siRNA or the inhibitor propargylglycine, osteoclast formation decreased as marked by the reduction in multinuclear cells positive for tartrate-resistant acid phosphatase (Figure 5B). On the other hand, supplementation of excess H2S in the form of a precursor form, GYY4137, increased the number of forming osteoclasts (Figure 5B),48
thus establishing that Cth is a novel protein involved in functional osteoclastogenesis.
Targeted Proteomics for In Vivo and Clinical Applications
Targeted proteomics pertains to MS strategies that target specific proteins. Its applications include follow-up on proteins identified in global/unbiased proteomics screening, conducting functional studies such as posttranslational modification analysis, or when the proteins of interest are candidate or validated biomarkers of a disease. These applications are enabled by peptide libraries acquired during global proteomics experiments or by peptides standards.10,19,49–55
A peptide library provides specificity by including the precursor/peptide and fragment ion masses, and the peptide’s retention time. When the chromatography and MS settings are fixed, a peptide will behave the same during MS acquisition, irrespective of the source of peptide. Targeted proteomics is a powerful method for biomarker detection when an immuno-based method is not available.
Selected Reaction Monitoring (SRM) and Parallel Reaction Monitoring (PRM)
SRM, sometimes referred to as multiple reaction monitoring, and PRM are targeted MS methods. The overall principle behind SRM and PRM is similar; however, SRM selects a single precursor followed by 1 fragment ion per scan (Figure 6A), whereas PRM selects a single precursor followed by all fragment ions per scan (Figure 6B). There are scenarios for which each method can be tweaked to expand further its scan strategies, but those details are discussed elsewhere.10,56,57

Recent research from our laboratory into the mechanisms of vascular calcification, a prominent feature of cardiovascular diseases, demonstrated that sortilin is a key regulator of smooth muscle cell (SMC)-mediated calcification.7
MS analysis of cell culture-derived immunopurified sortilin determined that a C-terminal serine phosphorylation (pSer825) was sufficient to promote osteogenic reprogramming of SMCs. As exciting as this phosphorylation finding was, there was and still is no commercially available antibody against sortilin pSer825, which could have complicated our efforts further for in vivo studies. We instead developed a PRM-based method to quantify pSer825 in vivo: a sortilin peptide library was generated using a stable isotope-labeled cell-free synthesized full-length sortilin standard that included the C-terminal pSer825 peptide.7,54
SMC culture experiments revealed that C-terminal phosphorylation increased during osteogenic reprogramming and that phosphorylation was mediated in part by the kinase, Fam20C.7,58
The sortilin standard peptides were then used to develop a PRM assay that monitored the phosphorylation of the C-terminus in mouse and human atheroma (Figures 6C,D), and confirmed that calcified regions contained more phosphorylated sortilin than did non-calcified regions.7
This study is a good example of how unbiased and targeted MS methods enabled the transition from in vitro finding to in vivo significance.
Dyslipidemia is the most studied factor affecting atherosclerosis and cardiovascular risk and has seen several applications of targeted proteomics in both basic research and in the clinic. Clinical trials aimed to examine whether increasing the level of high-density lipoprotein cholesterol (HDL-C) by cholesterol ester transfer protein (CETP) inhibitors or decreasing the level of low-density lipoprotein cholesterol (LDL-C) by proprotein convertase subtilisin-kexin type 9 (PCSK9) inhibitors decreases cardiovascular risk are underway or completed. The outcome of the phase III clinical trial of the CETP inhibitor anacetrapib is highly anticipated because other compounds in the same class yielded either no benefit on clinical outcomes or adverse effects.59–61
Clinical trials demonstrated that PCSK9 monoclonal antibodies, evolocumab and alirocumab, decreased LDL-C by more than 50% in patients with hypercholesterolemia.62,63
Despite the promising results of the PCSK9 biologics, however, the high costs of antibody-based therapies64
has driven the development of PCSK9 small molecule inhibitors. K-312 is a novel dual CETP/PCSK9 inhibitor currently in phase I clinical trial, and the PCSK9 transcription-dependent mechanism in a rabbit model of atherosclerosis was recently reported by our laboratory.25
K-312 decreased PCSK9 mRNA in the liver. Moreover, rabbits treated with K-312 exhibited smaller atherosclerotic plaques and lower levels of LDL-C. However, because of the lack of a reliable anti-rabbit PCSK9 antibody, confirmation of a decrease in plasma PCSK9 would have been impossible if not for the availability of targeted proteomics. We generated an in vitro synthesized form of rabbit PCSK9 and used PRM to develop a rabbit PCSK9 spectral library and confirmed that K-312 did in fact lower circulating PCSK9 by >50%.10,25
Targeted proteomics has also been applied to in vivo metabolism studies of mostly LDL and HDL apolipoproteins during lipid-lowering clinical trials. Subjects are injected with amino acid tracer (D3-Leu), which is taken up by primarily the liver and incorporated into nascent apolipoproteins that are detected in circulating lipoproteins.10,65–67
The rate of appearance or clearance of a protein on a lipoprotein in response to a therapy provides researchers with potential mechanisms of action of the therapy. ApoA-I and apoB metabolism mark HDL and VLDL/LDL levels/metabolism, respectively, and as a consequence have been used as surrogates for the respective lipoproteins in preclinical studies and clinical trials/studies.65–71
Other proteins whose metabolism has been monitored include apoA-II, PCSK9 and CETP.25,67
Most of these clinical metabolism studies have depended on SRM/MRM to detect very low levels of D3-Leu tracer incorporation into apolipoproteins. The substitution of 3 hydrogens with deuterium atoms causes a 3-Da shift in the mass of Leu-containing peptides, superimposing the deuterium isotope (2H M3) with the natural M3
isotope (comprising 13C and 15N), making the 2 peaks indistinguishable from each if the D3-Leu tracer is very low (Figure 7A). As a consequence of this detection constraint, most apolipoprotein metabolism studies have been limited to either the quickly turning over apoB (~10% enrichment) or to the total HDL plasma pool (up to 2% peak enrichment depending on the labeling strategy).68
Singh et al from our laboratory, however, demonstrated the ability of PRM to measure <1% tracer enrichment in not only apoA-I from 5 HDL size fractions, but also 6 additional HDL apolipoproteins.72
Figure 7B
demonstrates a PRM scan of the apoA-I peptide, THLAPYSDELR. A magnification of a fragment ion (b
4, THLA) shows its isotopes, M0–M3. Further magnification of the M3 isotope shows that the 2H M3 tracer ion is distinguishable from the M3 isotopolog (Figure 7B).
Figure 7C
contrasts the enrichment curves of 4 HDL apolipoproteins, apoA-I, apoA-II, apoE and apoM, against the decay curve of the of the plasma D3-Leu pool. This detailed view of HDL apolipoprotein metabolism, which was enabled by PRM technology, yielded completely novel findings about HDL metabolism (Figure 7D): the HDL size expansion model is not the predominant route for HDL metabolism; instead, the various HDL particles appear in circulation through their simultaneous release from the liver. These findings mark a pivotal change in HDL metabolism theory, and also highlight the power and versatility of PRM for clinical applications.

Summary and Outlook
We have highlighted the most common MS technologies with the emphasis on applications in the cardiovascular sciences. Cell culture experiments have enabled the development and validation of reliable and reproducible MS technologies; as a consequence, these technologies are now poised to take on the challenges associated with clinical studies including limited sample size, protein dynamic range and donor-to-donor variability. We project that the next major frontier in cardiovascular proteomics is accessing and extracting meaningful information from the circulatory system itself. Biomarker and drug target discovery and validation will rely on the continual development of technologies such as PRM, while still relying on the readily accessible and well-established methods such as label-free quantification.
Disclosures
This work is supported by a research grant from Kowa Company, Ltd (Nagoya, Japan, to M.A.).
References
- 1.
Thakur SS, Geiger T, Chatterjee B, Bandilla P, Frohlich F, Cox J, et al. Deep and highly sensitive proteome coverage by LC-MS/MS without prefractionation. Mol Cell Proteomics 2011; 10: M1110.003699.
- 2.
de Godoy LM, Olsen JV, Cox J, Nielsen ML, Hubner NC, Frohlich F, et al. Comprehensive mass-spectrometry-based proteome quantification of haploid versus diploid yeast. Nature 2008; 455: 1251–1254.
- 3.
Richards AL, Hebert AS, Ulbrich A, Bailey DJ, Coughlin EE, Westphall MS, et al. One-hour proteome analysis in yeast. Nat Protoc 2015; 10: 701–714.
- 4.
Lau E, Cao Q, Ng DC, Bleakley BJ, Dincer TU, Bot BM, et al. A large dataset of protein dynamics in the mammalian heart proteome. Sci Data 2016; 3: 160015.
- 5.
Kline KG, Frewen B, Bristow MR, Maccoss MJ, Wu CC. High quality catalog of proteotypic peptides from human heart. J Proteome Res 2008; 7: 5055–5061.
- 6.
Lynch M, Barallobre-Barreiro J, Jahangiri M, Mayr M. Vascular proteomics in metabolic and cardiovascular diseases. J Intern Med
2016 March 4, doi:10.1111/joim.12486.
- 7.
Goettsch C, Hutcheson JD, Aikawa M, Iwata H, Pham T, Nykjaer A, et al. Sortilin mediates vascular calcification via its recruitment into extracellular vesicles. J Clin Invest 2016; 126: 1323–1336.
- 8.
Rahimi N, Costello CE. Emerging roles of post-translational modifications in signal transduction and angiogenesis. Proteomics 2015; 15: 300–309.
- 9.
Shah AS, Tan L, Long JL, Davidson WS. Proteomic diversity of high density lipoproteins: Our emerging understanding of its importance in lipid transport and beyond. J Lipid Res 2013; 54: 2575–2585.
- 10.
Singh SA, Miyosawa K, Aikawa M. Mass spectrometry meets the challenge of understanding the complexity of the lipoproteome: Recent findings regarding proteins involved in dyslipidemia and cardiovascular disease. Expert Rev Proteomics 2015; 12: 519–532.
- 11.
Vaisar T, Pennathur S, Green PS, Gharib SA, Hoofnagle AN, Cheung MC, et al. Shotgun proteomics implicates protease inhibition and complement activation in the antiinflammatory properties of HDL. J Clin Invest 2007; 117: 746–756.
- 12.
Burkhart JM, Gambaryan S, Watson SP, Jurk K, Walter U, Sickmann A, et al. What can proteomics tell us about platelets? Circ Res 2014; 114: 1204–1219.
- 13.
Burkhart JM, Vaudel M, Gambaryan S, Radau S, Walter U, Martens L, et al. The first comprehensive and quantitative analysis of human platelet protein composition allows the comparative analysis of structural and functional pathways. Blood 2012; 120: e73–e82, doi:10.1182/blood-2012-04-416594.
- 14.
Keshishian H, Burgess MW, Gillette MA, Mertins P, Clauser KR, Mani DR, et al. Multiplexed, quantitative workflow for sensitive biomarker discovery in plasma yields novel candidates for early myocardial injury. Mol Cell Proteomics 2015; 14: 2375–2393.
- 15.
Wilhelm M, Schlegl J, Hahne H, Moghaddas Gholami A, Lieberenz M, Savitski MM, et al. Mass-spectrometry-based draft of the human proteome. Nature 2014; 509: 582–587.
- 16.
Kim MS, Pinto SM, Getnet D, Nirujogi RS, Manda SS, Chaerkady R, et al. A draft map of the human proteome. Nature 2014; 509: 575–581.
- 17.
Kelleher NL. A cell-based approach to the human proteome project. J Am Soc Mass Spectrom 2012; 23: 1617–1624.
- 18.
Anderson NL, Anderson NG. The human plasma proteome: History, character, and diagnostic prospects. Mol Cell Proteomics 2002; 1: 845–867.
- 19.
Ebhardt HA, Root A, Sander C, Aebersold R. Applications of targeted proteomics in systems biology and translational medicine. Proteomics 2015; 15: 3193–3208.
- 20.
Gerszten RE, Asnani A, Carr SA. Status and prospects for discovery and verification of new biomarkers of cardiovascular disease by proteomics. Circ Res 2011; 109: 463–474.
- 21.
Gillette MA, Carr SA. Quantitative analysis of peptides and proteins in biomedicine by targeted mass spectrometry. Nat Methods 2013; 10: 28–34.
- 22.
Brand J, Haslberger T, Zolg W, Pestlin G, Palme S. Depletion efficiency and recovery of trace markers from a multiparameter immunodepletion column. Proteomics 2006; 6: 3236–3242.
- 23.
Echan LA, Tang HY, Ali-Khan N, Lee K, Speicher DW. Depletion of multiple high-abundance proteins improves protein profiling capacities of human serum and plasma. Proteomics 2005; 5: 3292–3303.
- 24.
Hutcheson JD, Goettsch C, Pham T, Iwashita M, Aikawa M, Singh SA, et al. Enrichment of calcifying extracellular vesicles using density-based ultracentrifugation protocol. J Extracell Vesicles 2014; 3: 25129.
- 25.
Miyosawa K, Watanabe Y, Murakami K, Murakami T, Shibata H, Iwashita M, et al. New CETP inhibitor K-312 reduces PCSK9 expression: A potential effect on LDL cholesterol metabolism. Am J Physiol Endocrinol Metab 2015; 309: E177–E190.
- 26.
Vivanco F, editor. Heart proteomics: Methods and protocols. Springer, 2013.
- 27.
Steen H, Mann M. The ABC’s (and XYZ’s) of peptide sequencing. Nat Rev Mol Cell Biol 2004; 5: 699–711.
- 28.
Giansanti P, Aye TT, van den Toorn H, Peng M, van Breukelen B, Heck AJ. An augmented multiple-protease-based human phosphopeptide atlas. Cell Rep 2015; 11: 1834–1843.
- 29.
Nagaraj N, Wisniewski JR, Geiger T, Cox J, Kircher M, Kelso J, et al. Deep proteome and transcriptome mapping of a human cancer cell line. Mol Syst Biol 2011; 7: 548.
- 30.
Shevchenko A, Chernushevic I, Shevchenko A, Wilm M, Mann M. “De novo” sequencing of peptides recovered from in-gel digested proteins by nanoelectrospray tandem mass spectrometry. Mol Biotechnol 2002; 20: 107–118.
- 31.
Dove A. Proteomics: Translating genomics into products? Nat Biotechnol 1999; 17: 233–236.
- 32.
Schwertz H, Langin T, Platsch H, Richert J, Bomm S, Schmidt M, et al. Two-dimensional analysis of myocardial protein expression following myocardial ischemia and reperfusion in rabbits. Proteomics 2002; 2: 988–995.
- 33.
Neverova I, Van Eyk JE. Application of reversed phase high performance liquid chromatography for subproteomic analysis of cardiac muscle. Proteomics 2002; 2: 22–31.
- 34.
Aye TT, Scholten A, Taouatas N, Varro A, Van Veen TA, Vos MA, et al. Proteome-wide protein concentrations in the human heart. Mol Biosyst 2010; 6: 1917–1927.
- 35.
Neilson KA, Ali NA, Muralidharan S, Mirzaei M, Mariani M, Assadourian G, et al. Less label, more free: Approaches in label-free quantitative mass spectrometry. Proteomics 2011; 11: 535–553.
- 36.
Hofsteen P, Robitaille AM, Chapman DP, Moon RT, Murry CE. Quantitative proteomics identify DAB2 as a cardiac developmental regulator that inhibits WNT/beta-catenin signaling. Proc Natl Acad Sci USA 2016; 113: 1002–1007.
- 37.
Oda Y, Huang K, Cross FR, Cowburn D, Chait BT. Accurate quantitation of protein expression and site-specific phosphorylation. Proc Natl Acad Sci USA 1999; 96: 6591–6596.
- 38.
Ong SE, Blagoev B, Kratchmarova I, Kristensen DB, Steen H, Pandey A, et al. Stable isotope labeling by amino acids in cell culture, SILAC, as a simple and accurate approach to expression proteomics. Mol Cell Proteomics 2002; 1: 376–386.
- 39.
Hebert AS, Merrill AE, Bailey DJ, Still AJ, Westphall MS, Strieter ER, et al. Neutron-encoded mass signatures for multiplexed proteome quantification. Nat Methods 2013; 10: 332–334.
- 40.
Kruger M, Kratchmarova I, Blagoev B, Tseng YH, Kahn CR, Mann M. Dissection of the insulin signaling pathway via quantitative phosphoproteomics. Proc Natl Acad Sci USA 2008; 105: 2451–2456.
- 41.
Thompson A, Schafer J, Kuhn K, Kienle S, Schwarz J, Schmidt G, et al. Tandem mass tags: A novel quantification strategy for comparative analysis of complex protein mixtures by MS/MS. Anal Chem 2003; 75: 1895–1904.
- 42.
Ross PL, Huang YN, Marchese JN, Williamson B, Parker K, Hattan S, et al. Multiplexed protein quantitation in Saccharomyces cerevisiae using amine-reactive isobaric tagging reagents. Mol Cell Proteomics 2004; 3: 1154–1169.
- 43.
Bamberger C, Pankow S, Park SK, Yates JR 3rd. Interference-free proteome quantification with MS/MS-based isobaric isotopologue detection. J Proteome Res 2014; 13: 1494–1501.
- 44.
Dayon L, Hainard A, Licker V, Turck N, Kuhn K, Hochstrasser DF, et al. Relative quantification of proteins in human cerebrospinal fluids by MS/MS using 6-plex isobaric tags. Anal Chem 2008; 80: 2921–2931.
- 45.
McAlister GC, Huttlin EL, Haas W, Ting L, Jedrychowski MP, Rogers JC, et al. Increasing the multiplexing capacity of TMTs using reporter ion isotopologues with isobaric masses. Anal Chem 2012; 84: 7469–7478.
- 46.
Oda T, Yamaguchi A, Shimizu K, Nikai T, Matsumoto K. Does the rewarmed heart restore the myocardial proteome to that of the pre-cooled state?: A proteomic analysis of surgical samples. Circ J 2015; 79: 2648–2658.
- 47.
Tu T, Zhou S, Liu Z, Li X, Liu Q. Quantitative proteomics of changes in energy metabolism-related proteins in atrial tissue from valvular disease patients with permanent atrial fibrillation. Circ J 2014; 78: 993–1001.
- 48.
Itou T, Maldonado N, Yamada I, Goettsch C, Matsumoto J, Aikawa M, et al. Cystathionine gamma-lyase accelerates osteoclast differentiation: Identification of a novel regulator of osteoclastogenesis by proteomic analysis. Arterioscler Thromb Vasc Biol 2014; 34: 626–634.
- 49.
Kuzyk MA, Smith D, Yang J, Cross TJ, Jackson AM, Hardie DB, et al. Multiple reaction monitoring-based, multiplexed, absolute quantitation of 45 proteins in human plasma. Mol Cell Proteomics 2009; 8: 1860–1877.
- 50.
Percy AJ, Chambers AG, Yang J, Hardie DB, Borchers CH. Advances in multiplexed MRM-based protein biomarker quantitation toward clinical utility. Biochim Biophys Acta 2014; 1844: 917–926.
- 51.
Gallien S, Domon B. Advances in high-resolution quantitative proteomics: Implications for clinical applications. Expert Rev Proteomics 2015; 12: 489–498.
- 52.
Muntel J, Boswell SA, Tang S, Ahmed S, Wapinski I, Foley G, et al. Abundance-based classifier for the prediction of mass spectrometric peptide detectability upon enrichment (PPA). Mol Cell Proteomics 2015; 14: 430–440.
- 53.
MacLean B, Tomazela DM, Shulman N, Chambers M, Finney GL, Frewen B, et al. Skyline: An open source document editor for creating and analyzing targeted proteomics experiments. Bioinformatics 2010; 26: 966–968.
- 54.
Singh S, Springer M, Steen J, Kirschner MW, Steen H. FLEXIQuant: A novel tool for the absolute quantification of proteins, and the simultaneous identification and quantification of potentially modified peptides. J Proteome Res 2009; 8: 2201–2210.
- 55.
Gerber SA, Rush J, Stemman O, Kirschner MW, Gygi SP. Absolute quantification of proteins and phosphoproteins from cell lysates by tandem MS. Proc Natl Acad Sci USA 2003; 100: 6940–6945.
- 56.
Domon B, Gallien S. Recent advances in targeted proteomics for clinical applications. Proteomics Clin Appl 2015; 9: 423–431.
- 57.
Peterson AC, Russell JD, Bailey DJ, Westphall MS, Coon JJ. Parallel reaction monitoring for high resolution and high mass accuracy quantitative, targeted proteomics. Mol Cell Proteomics 2012; 11: 1475–1488.
- 58.
Tagliabracci VS, Wiley SE, Guo X, Kinch LN, Durrant E, Wen J, et al. A Single kinase generates the majority of the secreted phosphoproteome. Cell 2015; 161: 1619–1632.
- 59.
Schwartz GG, Olsson AG, Abt M, Ballantyne CM, Barter PJ, Brumm J, et al. Effects of dalcetrapib in patients with a recent acute coronary syndrome. N Engl J Med 2012; 367: 2089–2099.
- 60.
Kingwell BA, Chapman MJ, Kontush A, Miller NE. HDL-targeted therapies: Progress, failures and future. Nat Rev Drug Discov 2014; 13: 445–464.
- 61.
Steg PG, Ducrocq G. Future of the prevention and treatment of coronary artery disease. Circ J 2016; 80: 1067–1072.
- 62.
Desai NR, Sabatine MS. PCSK9 inhibition in patients with hypercholesterolemia. Trends Cardiovasc Med 2015; 25: 567–574.
- 63.
Ajufo E, Rader DJ. Recent advances in the pharmacological management of hypercholesterolaemia. Lancet Diabetes Endocrinol 2016; 4: 436–446.
- 64.
Cohen JC, Hobbs HH. Genetics: Simple genetics for a complex disease. Science 2013; 340: 689–690.
- 65.
Lee AY, Yates NA, Ichetovkin M, Deyanova E, Southwick K, Fisher TS, et al. Measurement of fractional synthetic rates of multiple protein analytes by triple quadrupole mass spectrometry. Clin Chem 2012; 58: 619–627.
- 66.
Millar JS, Reyes-Soffer G, Jumes P, Dunbar RL, deGoma EM, Baer AL, et al. Anacetrapib lowers LDL by increasing ApoB clearance in mildly hypercholesterolemic subjects. J Clin Invest 2015; 125: 2510–2522.
- 67.
Reyes-Soffer G, Millar JS, Ngai C, Jumes P, Coromilas E, Asztalos B, et al. Cholesteryl ester transfer protein inhibition with anacetrapib decreases fractional clearance rates of high-density lipoprotein apolipoprotein A-I and plasma cholesteryl ester transfer protein. Arterioscler Thromb Vasc Biol 2016; 36: 994–1002.
- 68.
Croyal M, Fall F, Ferchaud-Roucher V, Chetiveaux M, Zair Y, Ouguerram K, et al. Multiplexed peptide analysis for kinetic measurements of major human apolipoproteins by LC/MS/MS. J Lipid Res 2016; 57: 509–515.
- 69.
Kasumov T, Willard B, Li L, Li M, Conger H, Buffa JA, et al. 2H2O-based high-density lipoprotein turnover method for the assessment of dynamic high-density lipoprotein function in mice. Arterioscler Thromb Vasc Biol 2013; 33: 1994–2003.
- 70.
Meikle PJ, Wong G, Tan R, Giral P, Robillard P, Orsoni A, et al. Statin action favors normalization of the plasma lipidome in the atherogenic mixed dyslipidemia of MetS: Potential relevance to statin-associated dysglycemia. J Lipid Res 2015; 56: 2381–2392.
- 71.
Uehara Y, Chiesa G, Saku K. High-density lipoprotein-targeted therapy and apolipoprotein A-I mimetic peptides Circ J 2015; 79: 2523–2528.
- 72.
Singh SA, Andraski AB, Pieper B, Goh W, Mendivil CO, Sacks FM, et al. Multiple apolipoprotein kinetics measured in human HDL by high-resolution/accurate mass parallel reaction monitoring. J Lipid Res 2016; 57: 714–728.

