Abstract
Background:
Activation of glucose-dependent insulinotropic polypeptide receptor (GIPR) has been shown to be protective against atherosclerosis. However, effects of GIP on the heart have remained unclear. To address this question, in vitro and in vivo experiments were conducted.
Methods and Results:
In isolated mouse cardiomyocytes, GIPR mRNA was detected by reverse transcription-polymerase chain reaction, and GIP stimulation increased adenosine 3′,5′-cyclic monophosphate production. In apolipoprotein E-knockout mice, infusion of angiotensin II (AngII; 2,000 ng·kg–1·min–1) significantly increased the heart weights, and co-administration of GIP (25 nmol·kg–1·day–1) reversed this increase (both P<0.01). In the left ventricular walls, GIP suppressed AngII-induced cardiomyocyte hypertrophy by 34%, apoptosis by 77%, and interstitial fibrosis by 79% (all P<0.01). Furthermore, GIP reduced AngII-induced expression of transforming growth factor-β1 (TGF-β1) and hypoxia inducible factor-1α. In wild-type mice, cardiac hypertrophy was induced by AngII to a lesser extent, and prevented by GIP. In contrast, GIP did not show any cardioprotective effect against AngII-induced cardiac hypertrophy in GIPR-knockout mice. In an in vitro experiment using mouse cardiomyocytes, GIP suppressed AngII-induced mRNA expression of B-type natriuretic peptide and TGF-β1.
Conclusions:
It was demonstrated that cardiomyocytes represent a direct target of GIP action in vitro, and that GIP ameliorated AngII-induced cardiac hypertrophy via suppression of cardiomyocyte enlargement, apoptosis, and fibrosis in vivo. (Circ J 2016; 80: 1988–1997)
Glucagon-like peptide (GLP)-1 and glucose-dependent insulinotropic polypeptide (GIP) are gut hormones secreted from the intestinal cells, and have the unique characteristic of enhancing insulin secretion from the pancreatic β cells in a glucose concentration-dependent manner.1
Recent studies have demonstrated that the GIP receptor (GIPR) is widely expressed in various cells including the cardiovascular system, and that activation of GIPR suppresses the development of atherosclerosis in mice.2
Although GIPR mRNA has been detected in the atrium and ventricles of rats, little is known about the effects of GIP on the heart.3
The GIPR is classified as a G-protein-coupled receptor (GPCR). Among the GPCRs, the β1-adrenergic receptor in the heart has been extensively investigated because of its exclusive expression in cardiomyocytes. Chronic stimulation of β1-adrenergic signaling causes cardiac hypertrophy via cAMP/protein kinase A (PKA) signaling.4
In contrast, cardiac hypertrophy can be prevented by the enhancement of cAMP/PKA signaling via the inhibition of cAMP-degrading enzyme phosphodiesterase-2.5
Recent studies have shown that hormone-specific actions result from different cAMP pools and PKA localization within cardiomyocytes.6,7
These findings indicate 2 possibilities; that activation of GIP signaling could act protective against cardiac hypertrophy, or, on the contrary, lead to hypertrophic changes in the heart.
Recently, dipeptidyl peptidase-4 inhibitors (DPP-4Is) have been developed as a new class of oral anti-hyperglycemic agents. DPP-4 is the main enzyme that inactivates GLP-1 and GIP, and the inhibition of DPP-4 enhances GLP-1 and GIP action. Because of the low risk of hypoglycemia and weight gain compared with other agents stimulating insulin secretion,8
DPP-4Is are regarded as a useful therapeutic strategy for the treatment for Type 2 diabetic patients. However, a large clinical trial reported a higher admission rate for heart failure in patients treated with DPP-4I than in those treated with placebo,9
although this risk was not demonstrated in the later clinical study.10
Considering the current wide use of DPP-4Is, it is urgent to clarify whether enhanced GIPR signaling could exert cardioprotective effects, or lead to cardiac dysfunction via cardiac hypertrophy.
In the present study, we aimed to investigate GIPR expression and functional activity in mouse cardiomyocytes, and evaluate protective effects of GIP against AngII-induced cardiac hypertrophy, which is exacerbated by dyslipidemia using apolipoprotein E-knockout (ApoE–/–) mice. ApoE–/– mice develop severe dyslipidemia, and angiotensin II (AngII) infusion induces greater hypertrophic changes in ApoE–/– mice than normolipidemic wild-type mice; this finding is in accordance with epidemiological studies showing that dyslipidemia is one of the risk factors for the development and progression of cardiac hypertrophy.11
Methods
Cell Culture
Mouse cardiomyocytes isolated from Institute of Cancer Research mouse embryo hearts were purchased from COSMO Bio Co Ltd (Tokyo, Japan). The cells were seeded in a 24-well plate at a density of 100,000 cells per well, and cultured with cardiomyocyte culture medium (COSMO Bio) in fibronectin-coated plates in an atmosphere of 95% air/5% CO2
at 37℃. Cells reaching 70–80% confluency were starved with serum-free M199 medium (Thermo Fisher Scientific, MA, USA) overnight, and incubated with the indicated concentrations of AngII (Sigma-Aldrich, MO, USA) and GIP (human GIP(1-42); AnaSpec, CA, USA) for 24 h for reverse transcription–polymerase chain reaction (RT-PCR) analysis.
Real-Time RT-PCR
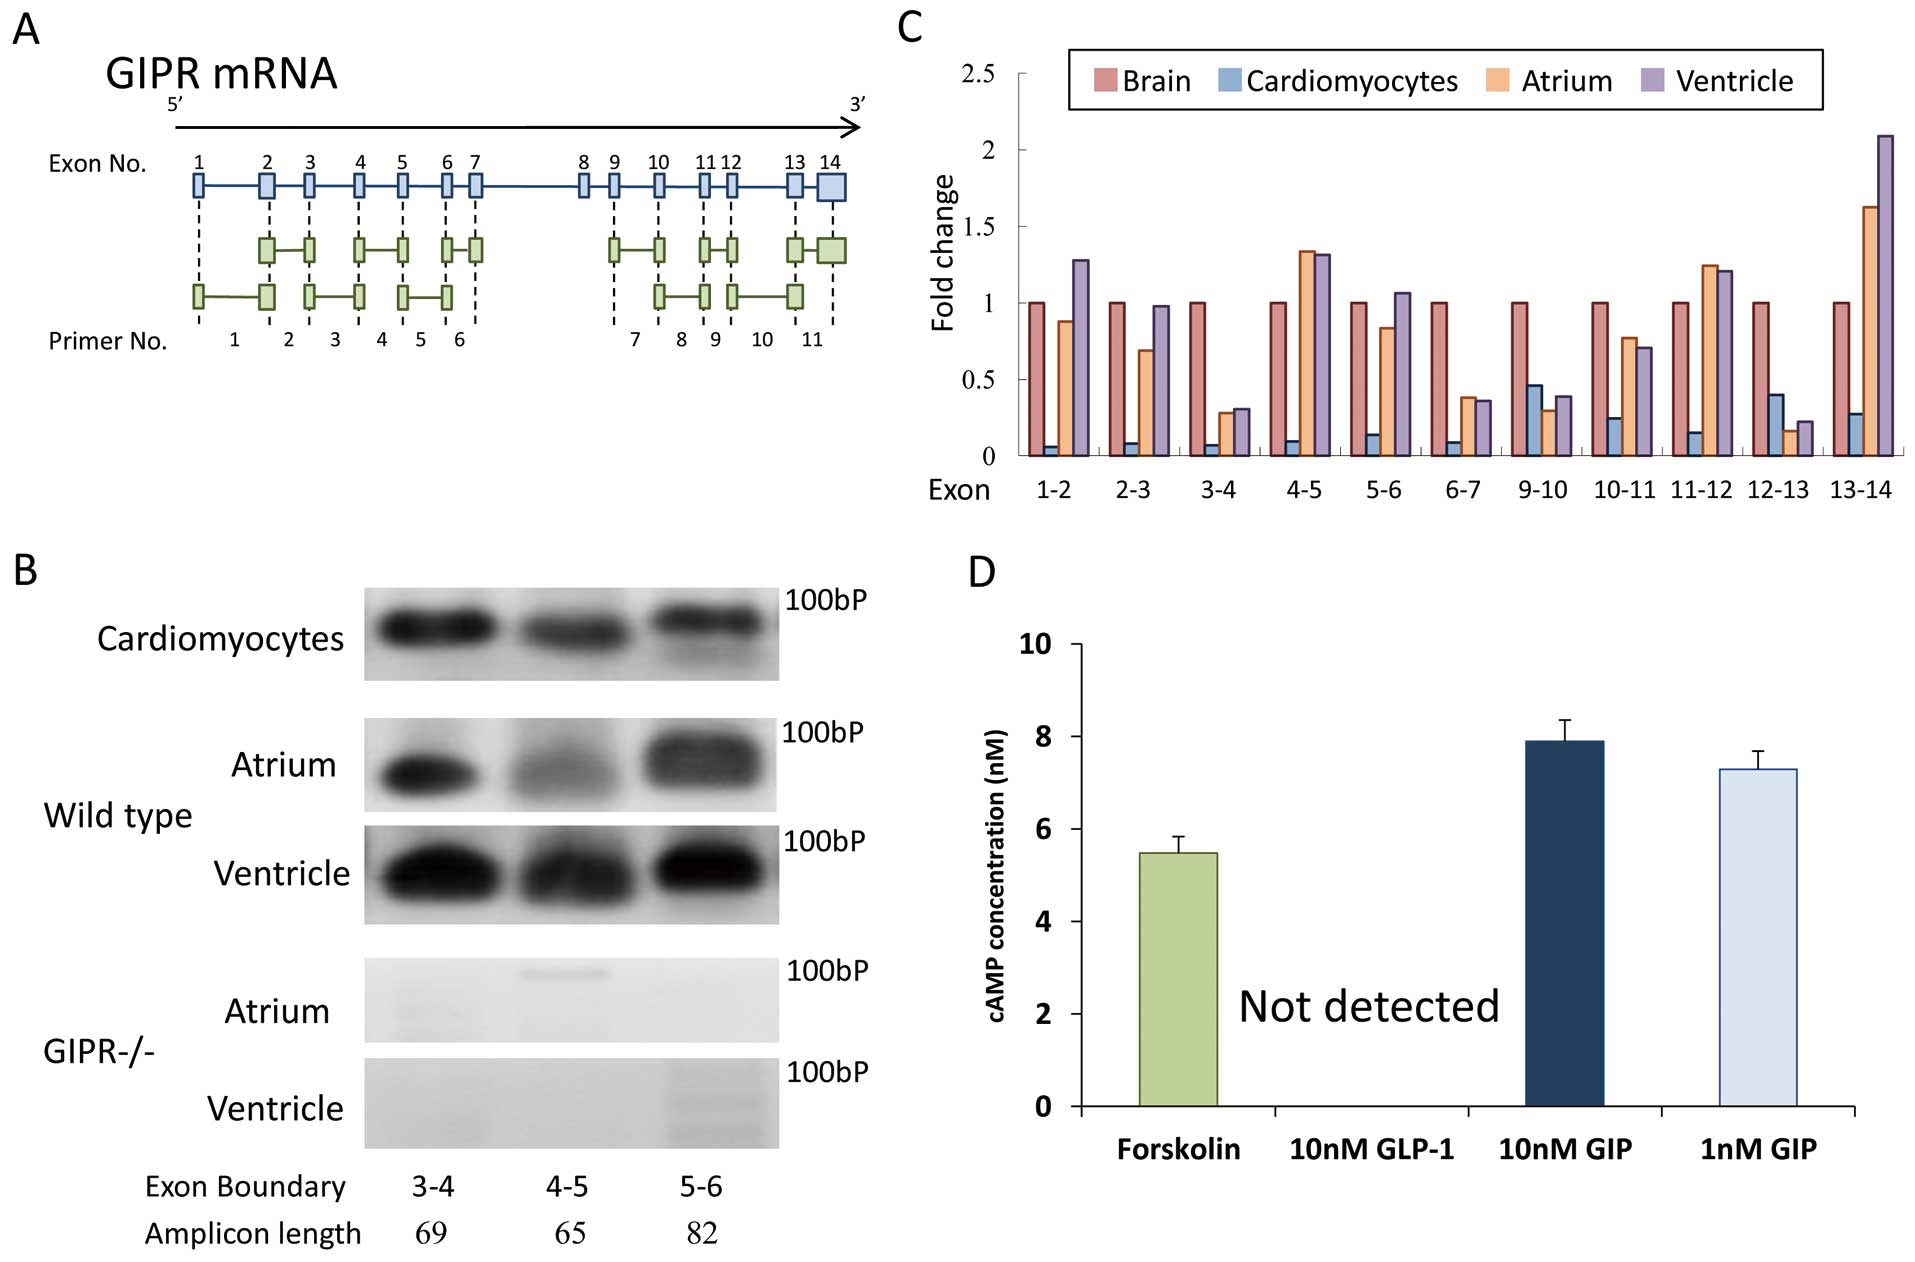
Total RNA was isolated from mouse cardiomyocytes and tissues using an ISOGEN reagent (Nippon Gene, Tokyo, Japan). Complementary DNAs were synthesized from the extracted total RNA by using a High-Capacity cDNA Kit (Applied Biosystems, CA, USA). Gene expression was analyzed by real-time RT-PCR using the TaqMan gene expression assay and sequence detection system (ABI PRISM 7900; Life Technologies, CA, USA). To detect GIPR, we used 11 different probe sets, each of which was designed to bridge 2 exons of GIPR (Figure 1A).12
Except for the detection of GIPR, we used the following probe sets: transforming growth factor-β1 (TGF-β1), Mm01178820_m1; B-type natriuretic peptide (BNP), Mm01255770_g1; hypoxia inducible factor-1α (HIF-1α), Mm00468869_m1; and 18S ribosomal RNA (18 s rRNA), Mm03928990_g1 (Life Technologies). Expression of a target gene was normalized by that of an internal control 18 s rRNA. The PCR-amplified products were purified using NucleoSpin Gel and PCR Clean-up columns (Macherey-Nagel, Düren, Germany), loaded on a 3% agarose gel for electrophoresis, and visualized with ethidium bromide.
Production of adenosine 3′,5′-cyclic monophosphate (cAMP) in mouse cardiomyocytes was measured by using a cAMP-GloTM Max Assay (Promega Corp, WI, USA) following the manufacturer’s instructions. In this assay, the cardiomyocytes were seeded into a 96-well microplate (4×10⁴
cells per well) and cultured for 5 days. Then, the cells were incubated in phosphate-buffered saline (PBS) containing 10 nmol/L of an adenyl cyclase activator, folskolin (positive control; Sigma-Aldrich), 10 nmol/L of GLP-1 (human GLP-1(7–36); AnaSpec), or 1 or 10 nmol/L of GIP (human GIP(1-42); AnaSpec) at 37℃ for 20 min. Subsequently, 10 μl of cAMP detection solution and Kinase-Glo®
Reagent were added. Luminescence was measured by using a TECAN Infinite F200 PRO multimode microplate reader (TECAN Ltd, Männedorf, Switzerland).
Animal Models
All procedures were approved by the Animal Care Committee of Showa University School of Medicine (approval number 04128). C57BL6 (wild type, WT) and ApoE–/– mice (C57BL6 background) at 14–15 weeks of age were purchased from Sankyo Laboratory (Tokyo, Japan). GIPR-knockout (GIPR–/–) mice were provided by Yuichiro Yamada from Akita University, as previously described,13
and backcrossed with a C57BL6 background. At 17 weeks of age, all the mice were started on a Western diet (Oriental Yeast, Tokyo, Japan) to induce or enhance dyslipidemia.2
After 4 weeks, the mice were randomly divided into 3 groups:
Group 1: saline+saline (control)
Group 2: AngII (2,000 ng·kg–1·min–1)+saline
Group 3: AngII (2,000 ng·kg–1·min–1)+GIP (25 nmol·kg–1·day–1)
We previously reported that this dose of AngII induced cardiac hypertrophy and that this was accompanied by severe atherosclerosis in ApoE–/– mice,14
and 25 nmol·kg–1·day–1
of GIP was reported to suppress atherosclerosis.2
The agents were delivered by osmotic pumps (Alzet model 1002; Cupertino, CA, USA) implanted subcutaneously when mice were under general anesthesia with isoflurane. The implanted osmotic pumps were replaced every 2 weeks to avoid degradation or biological inactivation of the agents. After 4 weeks of treatment, the mice were fasted for 6 h and sacrificed under general anesthesia with isoflurane. Blood samples were immediately collected from the inferior vena cava and mixed with a DPP-4I (EMD Millipore, MA, USA) at a final concentration of 1% (v/v) to inhibit GIP degradation. Following perfusion-fixation with PBS and 4% paraformaldehyde at a physiologic pressure of 100–120 mmHg, the hearts were removed from the cardiac connective tissues and weighted. In a subgroup of animals, the left ventricles (LVs) were collected without perfusion-fixation, and snap-frozen in liquid nitrogen for RT-PCR analysis.
Metabolic Parameters
Fasting blood glucose and hemoglobin A1c (HbA1c) levels were measured through a cut in the tail vein using a dextrometer (Glutest Sensor; Sanwa Kagaku, Aichi, Japan) and A1CNow (Bayer Inc, Leverkusen, Germany) before sacrificing the animals. Plasma levels of total cholesterol and triglycerides were measured by using the enzymatic colorimetric method (Wako). Plasma levels of insulin and total GIP were determined using enzyme-linked immunosorbent assays (ELISAs) (Ultra-sensitive mouse insulin ELISA kit; Morinaga, Kanagawa, Japan; Rat/Mouse GIP (total) ELISA, EMD Millipore).
Blood Pressure Measurements
Systolic blood pressure and pulse rate were measured on the day of sacrifice using a tail-cuff method (Model MK-2000ST; Muromachi Kikai, Tokyo, Japan). The average of the blood pressure levels taken from consecutive 3–5 measurements was used as the value for an individual mouse.
Histological Analysis
Cryosections were prepared from the collected hearts at the papillary muscle level in the LV and stained with hematoxylin and eosin to assess LV wall thickness and cardiomyocyte sizes, or with Masson’s Trichrome (MT) for the assessment of interstitial fibrosis. The serial sections were also used for immunostaining. Rabbit polyclonal antibodies for TGF-β1 (1:200; Bioworld Technology, MN, USA), phosphorylated Akt (p-Akt) (1:100; Cell Signaling Technology, Tokyo, Japan), HIF-1α (1:50; GeneTex, CA, USA), or glucose transporter (GLUT)-1 (1:50; Abcam Japan, Tokyo, Japan) were used as a primary antibody. Labeled polymer peroxidase (Dako Japan, Tokyo, Japan) was used as a secondary antibody. We also conducted TdT-mediated dUTP nick-end labeling (TUNEL) in the LV sections to detect apoptotic cells, following the manufacturer’s instruction (ApopTag®
Peroxidase In Situ Apoptosis Detection Kit, EMD Millipore). The images of stained sections were obtained by using a Leica Microsystems DM2000 system (Leica, Wetzlar, Germany). In each LV wall, the usual 3 points (2 in the free wall and 1 in the septum) were used for measurements. Cardiomyocyte sizes were quantified in 10 random cells per point. In the quantification of immunostaining, the brown-stained area was extracted at a magnification of ×400 with image analysis software (NIH ImageJ, MD, USA), and the percentage of the brown-stained area in 1 field was used as the value of the positive staining area of an individual mouse. All analyses were performed by an investigator who was blinded to the treatment.
Statistical Analysis
Values are expressed as the mean±SEM. Statistical analysis was performed by using analysis of variance (ANOVA) followed by a Tukey’s post-hoc test using JMP software (version 11; SAS Institute Inc, Cary, NC, USA). The significance level was defined as P<0.05.
Results
GIPR Expression and GIP-Stimulated cAMP Production in the Mouse Heart and Isolated Cardiomyocytes
To determine GIPR expression, we used 11 different primers. Each primer was designed to bridge 2 consecutive exons (Figure 1A). GIPR mRNA was detected by all the primers in mouse cardiomyocytes, as well as in the whole homogenate of the atrium and ventricle of a WT mouse (Figures 1B,C). However, GIPR mRNA expression was lower in cardiomyocytes than in the brain, which is known to highly express GIPR mRNA. Furthermore, we determined whether PCR-amplification products could be detected in the hearts of GIPR-knockout (GIPR–/–), which lacked exons 4 and 5 of the GIPR.13
In the atrium and ventricle of a GIPR–/– mouse, PCR-amplified products were not detected with primers bridging exon 4 or 5 (Figure 1B), suggesting that the detected GIPR mRNA expression in mouse cardiomyocytes was not derived from non-specific amplification. Next, we assessed the production of cAMP under GIP stimulation in mouse cardiomyocytes. The addition of GIP at 1 and 10 nmol/L increased the cAMP levels to a similar extent as it did for forskolin (Figure 1D). In contrast, the cAMP level was not changed under GLP-1 stimulation, as found in a previous study.15
Effects of Chronic GIP Administration on AngII-Induced Cardiac Hypertrophy in ApoE–/– Mice
Following in vitro confirmation of the post-GIPR signaling in cardiomyocytes, we evaluated the in vivo effects of GIP on hypertrophied hearts. The physiological and biochemical data are shown in
Table. Systolic blood pressure was significantly elevated in AngII-infused mice compared with the controls, and the plasma total GIP level was higher in only GIP-treated mice. However, the other parameters were not significantly changed. Chronic AngII infusion significantly increased the heart weights by ~2-fold, and co-administration of GIP significantly attenuated this increase (Figures 2A,D). The LV wall thickness was significantly increased by AngII; conversely, GIP tended to reduce AngII-induced LV wall thickness, although this was not statistically significant (Figures 2B,C,E).
Table.
Physiological and Biochemical Parameters of Apolipoprotein E-Knockout Mice Treated With Saline or Angiotensin II (AngII) and/or Glucose-Dependent Insulinotrophic Polypeptide (GIP)
| |
Saline |
AngII |
AngII+GIP |
| Food intake (g/day) |
3.6±0.3 |
3.5±0.2 |
3.6±0.1 |
| Water intake (ml/day) |
3.8±0.3 |
3.6±0.2 |
3.8±0.3 |
| Final body weight (g) |
31.5±0.3 |
29.6±0.6 |
29.0±0.6 |
| SBP (mmHg) |
99±6 |
122±5* |
113±4 |
| Pulse rate (beats/min) |
597±37 |
674±31 |
692±33 |
| Glucose (mg/dl) |
96±5 |
98±9 |
104±6 |
| Insulin (ng/ml) |
0.77±0.27 |
0.67±0.06 |
0.61±0.06 |
| Total cholesterol (mg/dl) |
361±20 |
316±31 |
349±42 |
| Triglycerides (mg/dl) |
60±9 |
40±5 |
45±11 |
| Total GIP (pmol/L) |
22.3±2.2 |
20.0±2.6 |
33.9±3.6*,
** |
Values are expressed as the mean±SEM. *P<0.05 vs. saline; **P<0.05 vs. AngII. Food intake, water intake, and final body weight: n=7, saline; n=15, AngII; n=10, AngII+GIP. n=4–7 per group for the other parameters. SBP, systolic blood pressure.
AngII infusion significantly induced cardiomyocyte enlargement in accordance with the increased heart weights, whereas GIP treatment reversed this hypertrophic effect of AngII (Figures 3A,D). Although the fibrotic area was <1% of the LV wall, and the apoptotic cells assessed by TUNEL staining were rarely observed in saline-treated mice, AngII treatment substantially increased the fibrotic area and the number of apoptotic cells (Figures 3B
and
E,C
and
F; respectively). As stated previously, GIP treatment completely reversed the changes induced by AngII.
Expression of TGF-β1, p-Akt, HIF-1α, and GLUT-1 in the LV
To clarify the underlying molecular mechanisms behind the GIP treatment effect, we assessed the expression of TGF-β1, p-Akt, HIF-1α, and GLUT-1 in the LV using immunohistochemistry. AngII infusion increased TGF-β1 expression in the LV more than 8-fold (Figures 4A,E), and GIP treatment significantly suppressed AngII-induced TGF-β1 expression. The p-Akt-positive area was significantly greater in the AngII-infused mice compared with saline-infused controls (Figures 4B,F). GIP treatment further increased the p-Akt-positive area compared with those observed following AngII infusion alone. HIF-1α expression was remarkably increased by AngII, whereas GIP treatment completely abolished this increase (Figures 4C,G). In contrast, GLUT-1 expression was not changed following either AngII and/or GIP treatments (Figures 4D,H).
Effects of GIP on AngII-Induced Changes in Hypertrophy-Related Genes in Mouse Cardiomyocytes
Next, we conducted an in vitro experiment to determine the direct effects of GIP on cardiomyocytes. As shown in
Figure 5A, treatment with AngII increased TGF-β1 mRNA expression in a concentration-dependent manner, and co-treatment with GIP reversed this increase. In contrast, HIF-1α mRNA expression was not changed by AngII or GIP treatment (Figure 5B). We also evaluated mRNA expression of BNP, a marker of cardiomyocyte hypertrophy and cardiac dysfunction.16
Similar to the results found for TGF-β1, GIP suppressed the AngII-induced mRNA expression of BNP (Figure 5C).
Expression of Hypertrophy-Related Genes in the LV
To obtain more insight into background molecular changes in the cardioprotective effects of GIP, we evaluated the expression of genes related to hypertrophy in the LV. In accordance with the changes in cardiomyocyte sizes and TGF-β1 protein expression, co-administration of GIP suppressed AngII-induced BNP and TGF-β1 mRNA expressions, although these changes did not reach statistical significance (Figures S1A,B; P=0.24, and 0.32, respectively). In contrast, HIF-1α mRNA expression was not changed by AngII, but it was increased by GIP (Figure S1C).
Anti-Hypertrophic Effects of GIP in WT Mice
Subsequent to the determination of cardioprotective effects of GIP in ApoE–/– mice, we evaluated GIP’s effects in normolipidemic WT mice. In the absence of dyslipidemia, AngII infusion induced cardiac hypertrophy and fibrosis to a lesser extent than those observed in dyslipidemic ApoE–/– mice (Figures 6A–D,F–I). However, similar to ApoE–/– mice, co-administration of GIP significantly suppressed cardiac hypertrophy and fibrosis caused by AngII infusion. In addition, GIP suppressed AngII-induced TGF-β1 protein expression (Figures 6E,J).

To understand potential differences between mouse strains, we also compared GIP levels in the circulating blood and GIPR mRNA expression in the LVs between WT and ApoE–/– mice. There was no difference in plasma total GIP levels between WT and ApoE–/– mice treated with saline or AngII (Figure S2A). GIPR mRNA expression in the LVs were similar in WT and ApoE–/– mice (Figure S2B). Although GIPR mRNA expression was increased in the hearts taken from ApoE–/– mice treated with AngII, chronic infusion of GIP did not lead to a downregulation of GIPR mRNA expression.
Effects of GIP on the Cardiac Hypertrophy and Fibrosis in GIPR–/– Mice
To clarify whether the anti-hypertrophic effects of GIP resulted from the activation of GIPR, we demonstrated the inefficacy of GIP on AngII-infused GIPR–/– mice. Although AngII significantly increased cardiac hypertrophy and fibrosis in GIPR–/– mice, as well as in ApoE–/– and WT mice, GIP did not show any protective effects against cardiac hypertrophy or fibrosis induced by AngII in GIPR–/– mice (Figures 7A–J).
Discussion
In the present study, we demonstrated for the first time that GIP suppressed AngII-induced hypertrophic responses via the direct action on cardiomyocytes in vitro, and that the activation of GIPR signaling prevented AngII-induced cardiac hypertrophy in vivo. This anti-hypertrophic effect in vivo was accompanied by the suppression of cardiomyocyte enlargement and a reduction in fibrosis and apoptosis in the LV. GIP treatment also reduced TGF-β1 expression, which plays central roles in the development of pathological cardiac hypertrophy and fibrosis. In addition, GIP suppressed HIF-1α expression, indicating an improvement of cellular hypoxic stress in the hypertrophied heart.
We demonstrated that GIP actually increased the production of cAMP in cardiomyocytes. A previous study had reported the presence of GIPR mRNA expression in the rat heart;3
however, it was not clear whether cardiomyocytes express GIPR because the heart is composed of various types of cells including cardiomyocytes, endothelial cells, fibroblasts, immune cells, and vascular smooth muscle cells.17
In addition, the post-transcriptional modification of receptors is an essential process in the acquisition of the ability to activate downstream signaling pathways. Our results further show that GIP exerts a direct action on cardiomyocytes through GIPRs.
In the present study, GIP suppressed cardiomyocyte enlargement induced by AngII infusion. Because enlargement of cardiomyocytes is closely associated with cardiac hypertrophy,17,18
the suppression of cardiomyocyte enlargement by GIP could make a primary contribution to the prevention of AngII-induced cardiac hypertrophy. TGF-β plays an important role in the development of cardiac hypertrophy as a downstream mediator of AngII signaling.19,20
It has been shown that TGF-β could directly induce cardiomyocyte enlargement via the promotion of fetal contractile protein synthesis,21
and that mice with a genetic disruption of TGF-β are protected from AngII-induced cardiac hypertrophy.22
We found that GIP suppressed AngII-induced TGF-β expression in vivo and in vitro. These findings indicate that the suppression of TGF-β expression could, at least in part, represent a mechanism by which GIP prevented AngII-induced cardiac hypertrophy. In addition to cardiomyocyte enlargement, apoptotic loss of cardiomyocytes and massive fibrosis lead to cardiac dysfunction, ultimately resulting in the transition from compensated hypertrophy to heart failure. TGF-β also acts as a pro-fibrotic and pro-apoptotic factor in the heart.23,24
Thus, the suppression of TGF-β1 expression caused by GIP might contribute to the prevention of cardiac fibrosis and apoptosis, as well as cardiomyocyte enlargement. In respect to mechanisms in the suppression of TGF-β1 expression by GIP signaling, there are possibilities that nicotinamide adenine dinucleotide phosphate (NADPH) oxidase and p38 mitogen-activated protein kinase (MAPK) are involved. The induction of TGF-β1 mRNA by AngII in rat cardiomyocytes has been shown to be mediated by NADPH oxidase, and subsequent activation of protein kinase C, p38 MAPK, and nuclear activating-protein-1 binding activity.25
There is a study reporting that the activation of GLP-1R, which shares a number of similarities with GIPR, prevents NADPH oxidase activation induced by hyperglycemia in mouse cardiomyocytes.26
It is also reported that GIP suppressed p38 MAPK in rat islet β cells.27
Although differences in receptor and cell types need to be considered, the suppression of NADPH oxidase and/or p38 MAPK activity might be a possible mechanism in the suppression of TGF-β1 expression by GIP signaling.
The phosphoinositide 3-kinase (PI3K)/Akt pathway has been shown to be activated in hypertrophied hearts in response to pathological stress to exert protective effects against cardiac dysfunction through various mechanisms including the promotion of cardiomyocyte enlargement and survival, and the suppression of fibrosis and cell death.28–30
In our study, p-Akt expression was significantly increased in the hearts of mice treated with AngII, and this increase was further enhanced by co-administration of GIP. Previous studies have demonstrated complex interactions between TGF-β and Akt signaling pathways. It is reported that TGF-β induces hypertrophic responses partly via the activation of Akt.31
In contrast, another study has demonstrated that the activation of Akt inhibits TGF-β signaling via direct interaction with Smad3, a mediator of TGF-β receptor signaling.32
These findings indicate that a relationship between TGF-β and Akt varies depending on cell types, conditions, or stimuli. In isolated rat cardiomyocytes, cAMP enhances Akt phosphorylation via the activation of PKA and exchange protein directly activated by cAMP.33
The plasma levels of insulin, a well-known activator of PI3K/Akt signaling, were not changed in GIP-treated mice because we used non-diabetic mice in which GIP does not enhance insulin secretion. It is possible that Akt activation by GIP might contribute to the suppression of apoptosis without inducing cardiomyocyte enlargement under the condition of reduced TGF-β1 expression in our models.
We further found that GIP reduced HIF-1α expression in AngII-induced hypertrophied hearts. HIF-1 is a transcription factor that mediates the adaptive response to hypoxic stress,34
and downstream HIF-1 molecules are involved in cardiac remodeling.35
Under normoxic conditions, the transcriptional activity of HIF-1 is regulated by the rapid degradation of HIF-1α, a subunit of HIF-1. GLUT-1 has been reported to be involved in HIF-1 expression in certain types of cells.36
In our study, however, GLUT-1 expression did not differ among the 3 treatment groups, indicating that GIP attenuated the hypoxic stress in hypertrophied hearts independent of GLUT-1. We found that treatments with AngII and/or GIP did not affect HIF-1α mRNA expression in mouse cardiomyocytes in vitro. However, HIF-α mRNA expression was somewhat increased by GIP in the LV walls ex vivo. To clarify the reason why GIP treatment suppressed the immunohistochemical expression of HIF-1α with increased mRNA levels in ApoE–/– mice, further investigation is required.
In the present study, AngII infusion led to increased systolic blood pressure (SBP) levels compared with vehicle, while SBP levels tended to be lower in mice co-treated with GIP than those treated with AngII alone. However, GIP improved cardiac hypertrophy to a greater degree compared with only slight change in SBP. These findings indicate that a reduction in SBP might be a contributing factor, but not the main mechanism of the anti-hypertrophic effects of GIP. Previous studies have demonstrated that intravenous administration of GIP reduces blood pressure partly via increased vagal activity and splanchnic blood pooling.37–39
In addition, it has been shown that the activation of GLP-1R stimulates the secretion of atrial natriuretic peptide (ANP) from the atrium and reduces blood pressure in mice.15
Given that GIPR is also expressed in the atrium, it is possible that ANP is involved in the GIP-induced reduction of blood pressure.
One limitation of our study is the lack of assessment of cardiac function. To obtain further understanding of the cardioprotective effects of GIP, in vivo or ex vivo assessments of cardiac function such as echocardiogram and perfusion experiments with an isolated heart would be required. In addition, because fibroblasts are thought to be directly involved in cardiac fibrosis in response to various stimuli, including TGF-β, fibroblasts could be another target of GIP in the heart. However, it remains unknown whether cardiac fibroblasts express functional GIPRs. Furthermore, in order to determine what cells are the most responsible for GIP’s anti-fibrotic effect in the heart, genetic deletion of GIPR specific to targeted cells such as Cre/loxP and tetracycline-controlled transcriptional activation systems are required.40,41
Our findings would validate further investigation of GIP’s cardioprotective effects.
In conclusion, this study is the first to show that GIP can directly elicit cAMP production and suppress AngII-induced hypertrophic responses in mouse cardiomyocytes. Furthermore, the chronic administration of GIP suppresses AngII-induced cardiac hypertrophy by reducing cardiomyocyte enlargement, fibrosis, and apoptosis. Together, these results suggest that the suppression of TGF-β1 expression and enhancement of Akt phosphorylation represent potential mechanisms underlying the cardioprotective effects of GIP.
Acknowledgments
The authors thank Kyoko Nohtomi for excellent technical support.
Disclosures
T.H. received lecture fees from Takeda Pharmaceutical Company, Merck Sharp and Dohme, Novartis Pharmaceuticals Japan, AstraZeneca, and Shionogi & Company.
Grants
T. Watanabe received a Grant-in-Aid for Scientific Research (C) (26460659) from the Japan Society for the Promotion of Science. T.H. received financial support from Merck Sharp and Dohme, AstraZeneca, and Mitsubishi Tanabe Pharma Corporation. The funders had no role in the present study. The other authors did not receive funding during this study.
Supplementary Files
Supplementary File 1
Figure S1.
Effects of co-treatment with glucose-dependent insulinotrophic polypeptide (GIP) on angiotensin II (AngII)-induced mRNA expression in the left ventricle (LV) of apolipoprotein E-knockout mice.
Figure S2.
(A) Circulating levels of total glucose-dependent insulinotrophic polypeptide (GIP) in wild-type (WT) and apolipoprotein E-knockout (ApoE–/–) mice.
Please find supplementary file(s);
http://dx.doi.org/10.1253/circj.CJ-16-0152
References
- 1.
Drucker DJ. The biology of incretin hormones. Cell Metab 2006; 3: 153–165.
- 2.
Nagashima M, Watanabe T, Terasaki M, Tomoyasu M, Nohtomi K, Kim-Kaneyama J, et al. Native incretins prevent the development of atherosclerotic lesions in apolipoprotein E knockout mice. Diabetologia 2011; 54: 2649–2659.
- 3.
Usdin TB, Mezey E, Button DC, Brownstein MJ, Bonner TI. Gastric inhibitory polypeptide receptor, a member of the secretin-vasoactive intestinal peptide receptor family, is widely distributed in peripheral organs and the brain. Endocrinology 1993; 133: 2861–2870.
- 4.
Osadchii OE. Cardiac hypertrophy induced by sustained beta-adrenoreceptor activation: Pathophysiological aspects. Heart Fail Rev 2007; 12: 66–86.
- 5.
Zoccarato A, Surdo NC, Aronsen JM, Fields LA, Mancuso L, Dodoni G, et al. Cardiac hypertrophy is inhibited by a local pool of cAMP regulated by phosphodiesterase 2. Circ Res 2015; 117: 707–719.
- 6.
Hayes JS, Brunton LL, Brown JH, Reese JB, Mayer SE. Hormonally specific expression of cardiac protein kinase activity. Proc Natl Acad Sci USA 1979; 76: 1570–1574.
- 7.
Hayes JS, Brunton LL. Functional compartments in cyclic nucleotide action. J Cyclic Nucleotide Res 1982; 8: 1–16.
- 8.
Gooßen K, Gräber S. Longer term safety of dipeptidyl peptidase-4 inhibitors in patients with type 2 diabetes mellitus: Systematic review and meta-analysis. Diabetes Obes Metab 2012; 14: 1061–1072.
- 9.
Scirica BM, Bhatt DL, Braunwald E, Steg PG, Davidson J, Hirshberg B, et al. Saxagliptin and cardiovascular outcomes in patients with type 2 diabetes mellitus. N Engl J Med 2013; 369: 1317–1326.
- 10.
Green JB, Bethel MA, Armstrong PW, Buse JB, Engel SS, Garg J, et al. Effect of sitagliptin on cardiovascular outcomes in type 2 diabetes. N Engl J Med 2015; 373: 232–242.
- 11.
Sundstrom J, Lind L, Vessby B, Andren B, Aro A, Lithell H. Dyslipidemia and an unfavorable fatty acid profile predict left ventricular hypertrophy 20 years later. Circulation 2001; 103: 836–841.
- 12.
Tashiro Y, Sato K, Watanabe T, Nohtomi K, Terasaki M, Nagashima M, et al. A glucagon-like peptide-1 analog liraglutide suppresses macrophage foam cell formation and atherosclerosis. Peptides 2014; 54: 19–26.
- 13.
Miyawaki K, Yamada Y, Yano H, Niwa H, Ban N, Ihara Y, et al. Glucose intolerance caused by a defect in the entero-insular axis: A study in gastric inhibitory polypeptide receptor knockout mice. Proc Natl Acad Sci USA 1999; 96: 14843–14847.
- 14.
Kohashi K, Hiromura M, Mori Y, Terasaki M, Watanabe T, Kushima H, et al. A dipeptidyl peptidase-4 inhibitor but not incretins suppresses abdominal aortic aneurysms in angiotensin II-infused apolipoprotein E-null mice. J Atheroscler Thromb 2016; 23: 441–454.
- 15.
Kim M, Platt MJ, Shibasaki T, Quaggin SE, Backx PH, Seino S, et al. GLP-1 receptor activation and Epac2 link atrial natriuretic peptide secretion to control of blood pressure. Nat Med 2013; 19: 567–575.
- 16.
Maisel A. B-type natriuretic peptide levels: A potential novel “white count” for congestive heart failure. J Card Fail 2001; 7: 183–193.
- 17.
Porrello ER, Mahmoud AI, Simpson E, Hill JA, Richardson JA, Olson EN, et al. Transient regenerative potential of the neonatal mouse heart. Science 2011; 331: 1078–1080.
- 18.
Wu J, You J, Wang S, Zhang L, Gong H, Zou Y. Insights into the activation and inhibition of angiotensin II type 1 receptor in the mechanically loaded heart. Circ J 2014; 78: 1283–1289.
- 19.
Rosenkranz S, Flesch M, Amann K, Haeuseler C, Kilter H, Seeland U, et al. Alterations of beta-adrenergic signaling and cardiac hypertrophy in transgenic mice overexpressing TGF-beta(1). Am J Physiol Heart Circ Physiol 2002; 283: H1253–H1262.
- 20.
Kim S, Ohta K, Hamaguchi A, Yukimura T, Miura K, Iwao H. Effects of an AT1 receptor antagonist, an ACE inhibitor and a calcium channel antagonist on cardiac gene expressions in hypertensive rats. Br J Pharmacol 1996; 118: 549–556.
- 21.
Parker TG, Packer SE, Schneider MD. Peptide growth factors can provoke “fetal” contractile protein gene expression in rat cardiac myocytes. J Clin Invest 1990; 85: 507–514.
- 22.
Schultz Jel J, Witt SA, Glascock BJ, Nieman ML, Reiser PJ, Nix SL, et al. TGF-beta1 mediates the hypertrophic cardiomyocyte growth induced by angiotensin II. J Clin Invest 2002; 109: 787–796.
- 23.
Mauviel A. Transforming growth factor-beta: A key mediator of fibrosis. Methods Mol Med 2005; 117: 69–80.
- 24.
Yuan Y, Zong J, Zhou H, Bian ZY, Deng W, Dai J, et al. Puerarin attenuates pressure overload-induced cardiac hypertrophy. J Cardiol 2014; 63: 73–81.
- 25.
Wenzel S, Taimor G, Piper HM, Schlüter KD. Redox-sensitive intermediates mediate angiotensin II-induced p38 MAP kinase activation, AP-1 binding activity, and TGF-β expression in adult ventricular cardiomyocytes. FASEB J 2001; 15: 2291–2293.
- 26.
Balteau M, Van Steenbergen A, Timmermans AD, Dessy C, Behets-Wydemans G, Tajeddine N, et al. AMPK activation by glucagon-like peptide-1 prevents NADPH oxidase activation induced by hyperglycemia in adult cardiomyocytes. Am J Physiol Heart Circ Physiol 2014; 307: H1120–H1133.
- 27.
Widenmaier SB, Ao Z, Kim SJ, Warnock G, McIntosh CH. Suppression of p38 MAPK and JNK via Akt-mediated inhibition of apoptosis signal-regulating kinase 1 constitutes a core component of the beta-cell pro-survival effects of glucose-dependent insulinotropic polypeptide. J Biol Chem 2009; 284: 30372–30382.
- 28.
Schneiders D, Heger J, Best P, Michael Piper H, Taimor G. SMAD proteins are involved in apoptosis induction in ventricular cardiomyocytes. Cardiovasc Res 2005; 67: 87–96.
- 29.
McMullen JR, Shioi T, Zhang L, Tarnavski O, Sherwood MC, Kang PM, et al. Phosphoinositide 3-kinase (p110alpha) plays a critical role for the induction of physiological, but not pathological, cardiac hypertrophy. Proc Natl Acad Sci USA 2003; 100: 12355–12360.
- 30.
Lin Z, Zhou P, von Gise A, Gu F, Ma Q, Chen J, et al. Pi3kcb links Hippo-YAP and PI3K-AKT signaling pathways to promote cardiomyocyte proliferation and survival. Circ Res 2015; 116: 35–45.
- 31.
Conery AR, Cao Y, Thompson EA, Townsend CM Jr, Ko TC, Luo K. Akt interacts directly with Smad3 to regulate the sensitivity to TGF-beta induced apoptosis. Nat Cell Biol 2004; 6: 366–372.
- 32.
Lamouille S, Derynck R. Cell size and invasion in TGF-beta-induced epithelial to mesenchymal transition is regulated by activation of the mTOR pathway. J Cell Biol 2007; 178: 437–451.
- 33.
Stuenaes JT, Bolling A, Ingvaldsen A, Rommundstad C, Sudar E, Lin FC, et al. Beta-adrenoceptor stimulation potentiates insulin-stimulated PKB phosphorylation in rat cardiomyocytes via cAMP and PKA. Br J Pharmacol 2010; 160: 116–129.
- 34.
Zagórska A, Dulak J. HIF-1: The knowns and unknowns of hypoxia sensing. Acta Biochim Pol 2004; 51: 563–585.
- 35.
Hölscher M, Schäfer K, Krull S, Farhat K, Hesse A, Silter M, et al. Unfavourable consequences of chronic cardiac HIF-1α stabilization. Cardiovasc Res 2012; 94: 77–86.
- 36.
Ebert BL, Firth JD, Ratcliffe PJ. Hypoxia and mitochondrial inhibitors regulate expression of glucose transporter-1 via distinct Cis-acting sequences. J Biol Chem 1995; 270: 29083–29089.
- 37.
Wice BM, Reeds DN, Tran HD, Crimmins DL, Patterson BW, Dunai J, et al. Xenin-25 amplifies GIP-mediated insulin secretion in humans with normal and impaired glucose tolerance but not type 2 diabetes. Diabetes 2012; 61: 1793–1800.
- 38.
Amland PF, Jorde R, Aanderud S, Burhol PG, Giercksky KE. Effects of intravenously infused porcine GIP on serum insulin, plasma C-peptide, and pancreatic polypeptide in non-insulin-dependent diabetes in the fasting state. Scand J Gastroenterol 1985; 20: 315–320.
- 39.
Svensson AM, Efendic S, Ostenson CG, Jansson L. Gastric inhibitory polypeptide and splanchnic blood perfusion: Augmentation of the islet blood flow increase in hyperglycemic rats. Peptides 1997; 18: 1055–1059.
- 40.
Sauer B. Functional expression of the cre-lox site-specific recombination system in the yeast Saccharomyces cerevisiae. Mol Cell Biol 1987; 7: 2087–2096.
- 41.
Gossen M, Bujard H. Tight control of gene expression in mammalian cells by tetracycline-responsive promoters. Proc Natl Acad Sci USA 1992; 89: 5547–5551.


