Abstract
Background:
Kynurenine is a circulating metabolite from the essential amino acid tryptophan. Accelerated degradation of kynurenine in skeletal muscle has been reported to provide an anti-inflammatory effect. The aim of this study was to investigate the association between blood kynurenine and muscle mass/function in patients with heart failure (HF), in whom diseased muscle mass/function plays a pathophysiological role.
Methods and Results:
Plasma kynurenine was assessed in 249 patients with HF (67±11 years, 21% women) and in 45 controls from the SICA-HF study. Kynurenine was higher in 173 HF patients with reduced ejection fraction (EF) and in 76 patients with preserved EF than controls (3.5±1.5, 3.4±1.3, and 2.4±1.1 μmol/L, P<0.001). In HF patients, kynurenine had an inverse association with handgrip strength (r=–0.26, P<0.01), peak oxygen consumption (r=–0.29, P<0.01), 6-min walk distance (r=–0.23, P<0.01), and had a positive association with kidney and liver function parameters. No correlation was observed between kynurenine and lean mass. On multivariable linear regression analysis, a significant association was noted between kynurenine and peak oxygen consumption even after adjustment for age, gender, BMI, and hemoglobin (β=–0.23, P<0.001). Patients with higher kynurenine were at higher risk of death (adjusted HR, 1.46 per 1 μmol/L, P<0.01).
Conclusions:
In stable HF patients, plasma kynurenine was inversely correlated with muscle strength and functional capacity as well as with liver and kidney function.
Reduced functional capacity is the primary symptom in heart failure (HF), both in those with preserved and those with reduced ejection fraction (HFpEF and HFrEF, respectively).1,2
HF patients with reduced functional capacity have low quality of life3
and poor prognosis.4
The pathophysiology under reduced functional capacity in HF is considered to be multifactorial5–7
and it includes dysfunction in right/left ventricle (RV/LV), vasculature, skeletal muscle, lung, and others.8–10
The Studies Investigating Co-morbidities Aggravating Heart Failure (SICA-HF) was a multi-national, pathophysiological observation study into HF and its comorbidities.11,12
The kynurenine pathway, an enzymatic cascade degrading the essential amino acid tryptophan, has been gradually recognized as a modulator in several pathological situations such as systemic inflammation,13
vascular dysfunction,14
and neurological disorders including depression,15
all of which are potentially implicated in HF. In addition, exercise-induced degradation of kynurenine (one of the metabolites in the kynurenine pathway) in skeletal muscle has been reported to maintain resilience against psychological stress and depression via anti-inflammatory response.16,17
These results considered, we hypothesized that the kynurenine pathway might have an association with pathophysiology in HF, especially with reduced functional capacity. The elevated levels of metabolites in the kynurenine pathway have been reported in acute pancreatitis,18
trauma,19
chronic renal failure,20
older adults,21
patients after cardiac arrest,22
and in patients with pulmonary hypertension,14
but the plasma level in HF has not been investigated so far.
The aim of this study was to examine the impact of plasma kynurenine level on exercise capacity and its underlying pathophysiology such as muscle wasting, muscle performance, and systemic inflammation in HF. We also assessed the impact on mortality.
Methods
Subjects
We analyzed data of ambulatory patients and controls prospectively enrolled into SICA-HF at the participating center in Berlin (Charité Medical School, Campus Virchow-Klinikum, Berlin, Germany) between February 2010 and August 2013. During that period we recruited 275 patients and 52 controls. Blood samples were available in 249 consecutive patients and in 45 controls and we analyzed the data for these participants. The study’s rationale has been published previously.11
In brief, the inclusion criteria for chronic HF were a clinical diagnosis of HF according to the European Society of Cardiology gudielines23
and at least one of the following: LVEF ≤40%, left atrial dimension >4.0 cm (>2.5 cm/m height), N-terminal pro-brain natriuteric peptide (N-terminal proBNP) >400 pg/mL, or BNP >150 pg/mL. Patients with previous heart transplantation, history of unstable angina, myocardial infarction, stroke, cardiovascular revascularization, or open abdominal surgery within 6 weeks, and those on hemodialysis at baseline were excluded. All subjects provided written informed consent at enrolment, and the local ethics committees approved the protocol. The study was funded by the European Commission’s 7th Framework programme (FP7/2003-2013) under grant agreement number 241558 and fulfilled all principles of the Declaration of Helsinki. SICA-HF is registered under the ClinicalTrials.gov identifier: NCT01872299. The main result of SICA-HF has already been published elsewhere.24
Estimated glomerular filtration rate (eGFR) was calculated using the Modification of Diet in Renal Disease (MDRD) equation.25
Echocardiography was performed in all patients. LVEF was measured, and patients were divided into 2 groups: HFrEF (LVEF ≤40%) and HFpEF (LVEF >40%). Functional capacity was assessed using peak oxygen consumption (peakV̇O2) on spiroergometric treadmill exercise testing and the 6-min walk test. Dual energy X-ray absorptiometry (DEXA) was used with a Lunar Prodigy scanner and Lunar Encore 2002 software (GE Medical Systems, Madison, WI, USA). Muscle mass was defined as appendicular skeletal muscle divided by the height in meters squared, where appendicular skeletal muscle equals lean mass of arms and legs combined. Handgrip and leg strength were measured using a handgrip dynamometer and an isokinetic dynamometer, respectively. General health was measured using the 5-item self-administered EuroQOL instrument (EQ5D), which consists of a descriptive system and a visual analog scale. The descriptive assessment consists of 5 items: mobility, self-care, usual activities, pain/discomfort, and anxiety/depression. Anxiety/depression was scored as follows: 1, I am not anxious or depressed; 2, I am moderately anxious or depressed; 3, I am extremely anxious or depressed; or 4, question not answered. Each item can be used to represent profiles of health status or can be converted to a summary index (EQ5D index), with 1 designating perfect health and 0 denoting death.26,27
The visual analog scale ranges from 0 (i.e., “worst imaginable health state”) to 100 (i.e., “best imaginable health state”). We followed all participants until death or until April 2014 when the follow-up was censored.
Assessment of Kynurenine
Blood was drawn from an antecubital vein in fasting condition and plasma kynurenine was analyzed from plasma samples immediately centrifuged and frozen at –80℃ until analysis. An enzyme-linked immunosorbent assay (ELISA) was used (IDK®
Kynurenine ELISA, Immundiagnostik AG, Bensheim, Germany) to detect kynurenine. The intra- and inter-assay coefficients of variance of the research kit are 6.6 and 6.4%, respectively. The lower limit of quantification of this assay is 0.12 μmol/L. Cross-reactivity against compounds with structural similarity to l-kynurenine is <0.5% for 3-hydroxyl-DL-kynurenine and <0.2% for l-tryptophan. Based on studies with samples of apparently healthy persons (mean, 2.22 μmol/L; SD, 0.49 μmol/L), normal range was estimated as 1.2–3.2 μmol/L.
Statistical Analysis
Data are presented as mean±SD. Analysis of variance, Student’s unpaired t-test, Fisher’s exact test, Pearson’s simple regression, and multivariable linear regression were used as appropriate. Univariable and multivariable forward logistic regression analysis were used to estimate variables associated with higher kynurenine level, defined as above the median. The significance level to include and exclude in the model was set to 0.05 and 0.10, respectively. To estimate the influence of kynurenine level, Kaplan-Meier cumulative survival curves were constructed for illustrative purposes and compared using Mantel-Haenzel log-rank test. The patients were divided into 2 groups according to kynurenine level below or above the median. After that, we divided the patients into tertiles to assess which of the higher or lower levels of kynurenine have an impact on prognosis. The relationship of baseline variables to survival was assessed using Cox proportional-hazard analysis. Variables are log-transformed if they showed skewed distribution. P<0.05 was considered to indicate statistical significance in all analysis. Statistical analysis was performed using SPSS 17.0 for Windows (SPSS, Tokyo, Japan).
Results
We analyzed data from 249 patients with stable chronic HF and from 45 controls. Baseline characteristics in patients with HF (197 male, 52 female; mean age, 67±11 years) are presented in
Table 1. A total of 173 patients (69%) had HFrEF and 76 (31%) had HFpEF. The controls consisted of 26 men (58%) and 19 women (42%), with a mean age of 63±12 years. Two of them had diabetes but no other chronic diseases, and 43 were healthy without any chronic diseases.
Table 1.
Subject Baseline Characteristics
| |
All HF
(n=249) |
HFrEF
(n=173) |
HFpEF
(n=76) |
P-value |
| Age (years) |
67±11 |
66±11 |
69±10 |
0.04 |
| Male sex |
79 |
85 |
64 |
<0.001 |
| NYHA functional class |
2.33±0.65 |
2.37±0.64 |
2.25±0.66 |
0.17 |
| BMI (kg/m2) |
29.6±5.4 |
29.1±5.3 |
30.8±5.5 |
0.02 |
| LVEF (%) |
39±13 |
31±8 |
55±7 |
<0.001 |
| Ischemic etiology |
55 |
66 |
28 |
<0.001 |
| Hypertension |
82 |
77 |
92 |
<0.01 |
| Diabetes |
43 |
42 |
45 |
0.68 |
| Atrial fibrillation |
39 |
43 |
32 |
0.14 |
| Laboratory findings |
| Creatinine (mg/dL) |
1.19±0.4 |
1.22±0.4 |
1.10±0.3 |
0.04 |
| eGFR (mL/min/1.72 m2) |
69±22 |
69±23 |
70±21 |
0.58 |
| Hemoglobin (g/dL) |
13.4±1.5 |
13.5±1.5 |
13.3±1.4 |
0.34 |
| High-sensitivity CRP (mg/dL) |
5.6±11.4 |
6.5±13.3 |
3.4±4.2 |
0.05 |
| Medications and devices |
| ACEI |
63 |
67 |
53 |
0.05 |
| ARB |
32 |
30 |
36 |
0.37 |
| β-blocker |
90 |
95 |
77 |
<0.001 |
| MRA |
46 |
56 |
23 |
<0.001 |
| Diuretics |
73 |
78 |
63 |
0.02 |
| ICD/CRT |
40 |
54 |
8 |
<0.001 |
| Functional capacity |
| Peak V̇O2 (mL/min/kg) (n=206) |
16.9±4.7 |
16.3±4.8 |
18.1±4.5 |
0.01 |
| 6-min walk distance (m) (n=226) |
419±143 |
413±146 |
432±136 |
0.34 |
| Skeletal muscle |
| Handgrip strength (kg) (n=240) |
35.8±11.0 |
36.6±11.2 |
33.8±10.3 |
0.07 |
| Leg strength (kg) (n=232) |
37.0±12.8 |
37.4±13.2 |
36.1±11.7 |
0.46 |
| ASMI (kg/m2) (n=228) |
7.82±1.14 |
7.82±1.14 |
7.82±1.15 |
0.99 |
| Questionnaire |
| EQ-5D VAS score (n=139) |
58±19 |
56±18 |
68±17 |
0.02 |
| EQ-5D index (n=139) |
0.89±0.09 |
0.89±0.09 |
0.94±0.08 |
0.03 |
Data given as mean±SD or %. ACEI, angiotensin-converting enzyme inhibitor; ARB, angiotensin II receptor blocker; ASMI, appendicular skeletal muscle index; BMI, body mass index; CRP, C-reactive protein; CRT, cardiac resynchronization therapy; eGFR, estimated glomerular filtration rate; EQ-5D, 5-item self-administered EuroQOL instrument; HF, heart failure; HFpEF, HF with preserved ejection fraction; HFrEF, HF with reduced ejection fraction; ICD, implantable cardiac defibrillator; LVEF, left ventricular ejection fraction; MRA, mineral corticoid receptor antagonist; NYHA, New York Heart Association; VAS, visual analog scale; V̇O2, oxygen consumption.
Plasma kynurenine was significantly higher in HFrEF (3.5±1.5 μmol/L) and HFpEF (3.4±1.3 μmol/L), compared with controls (2.4±1.1 μmol/L, P<0.001 and P<0.01, respectively;
Figure 1A). In HFrEF, patients with hypertension and atrial fibrillation had higher kynurenine than those without these complications (P<0.01 and P<0.001, respectively;
Figure 1B), and in HFpEF, those with ischemic etiology had higher kynurenine (P=0.03;
Figure 1C).
Correlation Analysis
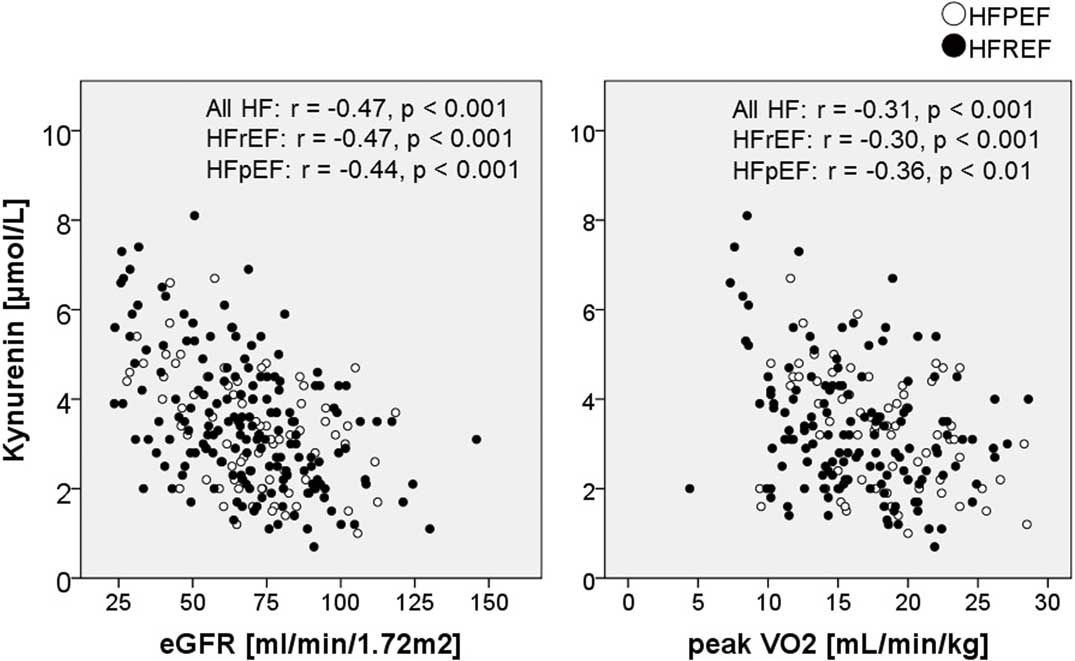
Using simple regression, we found that plasma kynurenine level correlated with age, New York Heart Association class, renal and liver function, high-sensitivity C-reactive protein (hs-CRP), functional capacity (peak V̇O2
and 6-min walk distance), and handgrip/leg strength both in the total HF cohort and in the HFrEF subgroup (Table 2). No correlation was observed between kynurenine and appendicular skeletal muscle index.
Table S1
lists the results of logistic regression analysis with kynurenine above the median (3.2 μmol/L) as the dependent variable. After multivariable adjustment, creatinine (OR, 1.23; 95% CI: 1.12–1.35 per 0.1-mg/dL increase, P<0.001) and log γ-glutamyltransferase (OR, 1.51; 95% CI: 1.06–2.15, P=0.02) were independently associated with higher kynurenine in the total HF cohort. A total of 142 patients with HF had complete EQ-5D data. Patients with moderate or extreme anxiety or depression (n=58) had higher kynurenine than those without anxiety or depression (n=84, 3.7±1.6 vs. 3.0±1.1 μmol/L, P<0.01).
Table 2.
Correlation Between Kynurenine and Clinical Variables
| |
All HF (n=249) |
HFrEF (n=173) |
HFpEF (n=76) |
| r |
P-value |
r |
P-value |
r |
P-value |
| Age (years) |
0.19 |
<0.01 |
0.19 |
0.01 |
0.19 |
0.10 |
| NYHA functional class |
0.19 |
<0.01 |
0.21 |
<0.01 |
0.13 |
0.25 |
| BMI (kg/m2) |
0.08 |
0.20 |
0.08 |
0.31 |
0.11 |
0.32 |
| LVEF (%) |
−0.08 |
0.21 |
−0.14 |
0.09 |
0.14 |
0.25 |
| Laboratory findings |
| Creatinine (mg/dL) |
0.50 |
<0.001 |
0.50 |
<0.001 |
0.50 |
<0.001 |
| eGFR (mL/min/1.72 m2) |
−0.47 |
<0.001 |
−0.47 |
<0.001 |
−0.44 |
<0.001 |
| Urea (mg/dL) |
0.40 |
<0.001 |
0.46 |
<0.001 |
0.21 |
0.07 |
| Hemoglobin (g/dL) |
−0.11 |
0.08 |
−0.15 |
0.05 |
−0.01 |
0.91 |
| Albumin (g/L) |
−0.11 |
0.08 |
−0.10 |
0.20 |
−0.14 |
0.22 |
| Alkaline phosphatase (log) |
0.34 |
<0.001 |
0.42 |
<0.001 |
0.02 |
0.85 |
| GGT (log) |
0.27 |
<0.001 |
0.34 |
<0.001 |
−0.04 |
0.73 |
| Total bilirubin (mg/dL) |
0.13 |
0.04 |
0.17 |
0.03 |
−0.04 |
0.72 |
| ALT (log) |
0.02 |
0.80 |
0.12 |
0.11 |
−0.19 |
0.10 |
| AST (log) |
0.02 |
0.75 |
0.09 |
0.23 |
−0.17 |
0.14 |
| High-sensitivity CRP (log) |
0.24 |
<0.001 |
0.26 |
<0.001 |
0.18 |
0.12 |
| Functional capacity |
| Peak V̇O2 (mL/min/kg) |
−0.31 |
<0.001 |
−0.30 |
<0.001 |
−0.36 |
<0.01 |
| 6-min walk distance (m) |
−0.19 |
<0.01 |
−0.22 |
<0.01 |
−0.11 |
0.37 |
| Skeletal muscle |
| Handgrip strength (kg) |
−0.14 |
0.03 |
−0.19 |
0.02 |
−0.04 |
0.73 |
| Leg strength (kg) |
−0.14 |
0.02 |
−0.17 |
0.03 |
−0.09 |
0.47 |
| ASMI (kg/m2) |
0.01 |
0.83 |
0.05 |
0.50 |
−0.10 |
0.44 |
ALT, alkaline transferase; AST, aspartate transferase; GGT, γ-glutamyltransferase. Other abbreviations as in Table 1.
Table 3
lists the results from the linear regression model with peak V̇O2
and 6-min walk distance as the dependent variables. On univariable analysis, kynurenine correlated with peak V̇O2
in the total HF cohort, and in the HFrEF and HFpEF subgroups. Kynurenine level also correlated with 6-min walk distance in the total HF cohort and the HFrEF group, but not in the HFpEF group. Kynurenine level correlated with peak V̇O2
even after adjustment for age, sex, body mass index (BMI), and hemoglobin, but not after adjustment for age, sex, BMI, hemoglobin, and creatinine in the total HF cohort and in the HFrEF group. Correlation between kynurenine, eGFR, and peak V̇O2
is shown in
Figure 2. Kynurenine was significantly higher in 43 patients (17% of all HF) who could not perform spiroergometric treadmill exercise testing than in 206 patients who could (4.0±1.5 vs. 3.3±1.4 μmol/L, P=0.004).
Table 3.
Indicators of Functional Capacity in Linear Regression Models
| |
Peak V̇O2 |
6-min walk distance |
| All HF (n=206) |
HFrEF (n=139) |
HFpEF (n=67) |
All HF (n=226) |
HFrEF (n=156) |
HFpEF (n=70) |
| β |
P-value |
β |
P-value |
β |
P-value |
β |
P-value |
β |
P-value |
β |
P-value |
| Univariable |
| Age (years) |
−0.27 |
<0.001 |
−0.35 |
<0.001 |
−0.17 |
0.17 |
−0.31 |
<0.001 |
−0.41 |
<0.001 |
−0.10 |
0.40 |
| NYHA functional class |
−0.61 |
<0.001 |
−0.63 |
<0.001 |
−0.57 |
<0.001 |
−0.60 |
<0.001 |
−0.57 |
<0.001 |
−0.67 |
<0.001 |
| BMI (kg/m2) |
−0.23 |
<0.001 |
−0.23 |
<0.01 |
−0.34 |
<0.01 |
−0.18 |
<0.01 |
−0.13 |
0.11 |
−0.33 |
<0.01 |
| LVEF (%) |
0.20 |
<0.01 |
0.14 |
0.10 |
−0.19 |
0.13 |
0.07 |
0.33 |
0.05 |
0.57 |
−0.11 |
0.37 |
| Laboratory findings |
| Creatinine (mg/dL) |
−0.40 |
<0.001 |
−0.42 |
<0.001 |
−0.29 |
0.02 |
−0.36 |
<0.001 |
−0.40 |
<0.001 |
−0.22 |
0.07 |
| Hemoglobin (g/dL) |
0.26 |
<0.001 |
0.27 |
<0.01 |
0.31 |
0.01 |
0.26 |
<0.001 |
0.24 |
<0.01 |
0.33 |
<0.01 |
| Albumin (g/L) |
0.22 |
<0.01 |
0.20 |
0.02 |
0.27 |
0.03 |
0.27 |
<0.001 |
0.29 |
<0.001 |
0.20 |
0.09 |
High-sensitivity CRP
(log) |
−0.34 |
<0.001 |
−0.39 |
<0.001 |
−0.20 |
0.11 |
−0.26 |
<0.001 |
−0.26 |
<0.01 |
−0.26 |
0.03 |
| Skeletal muscle |
| ASMI (kg/m2) |
0.21 |
<0.01 |
0.18 |
0.04 |
0.29 |
0.02 |
0.13 |
0.06 |
0.11 |
0.18 |
0.18 |
0.16 |
Handgrip strength
(kg) |
0.34 |
<0.001 |
0.32 |
<0.001 |
0.46 |
<0.001 |
0.41 |
<0.001 |
0.42 |
<0.001 |
0.42 |
<0.001 |
| Leg strength (kg) |
0.42 |
<0.001 |
0.43 |
<0.001 |
0.45 |
<0.01 |
0.42 |
<0.001 |
0.39 |
<0.001 |
0.54 |
<0.001 |
| Kynurenine (μmol/L) |
−0.31 |
<0.001 |
−0.30 |
<0.001 |
−0.36 |
<0.01 |
−0.19 |
<0.01 |
−0.22 |
<0.01 |
−0.11 |
0.37 |
| Multivariable: model 1 |
| Kynurenine (μmol/L) |
−0.25 |
<0.001 |
−0.23 |
<0.01 |
−0.30 |
<0.01 |
−0.12 |
0.07 |
−0.13 |
0.08 |
−0.02 |
0.85 |
| Multivariable: model 2 |
| Kynurenine (μmol/L) |
−0.23 |
<0.001 |
−0.21 |
<0.01 |
−0.29 |
<0.01 |
−0.11 |
0.09 |
−0.13 |
0.09 |
−0.01 |
0.95 |
| Multivariable: model 3 |
| Kynurenine (μmol/L) |
−0.12 |
0.07 |
−0.10 |
0.23 |
−0.23 |
0.04 |
0.02 |
0.82 |
0.00 |
0.98 |
0.09 |
0.48 |
Model 1, adjusted for age, sex, and BMI; model 2, adjusted for age, sex, BMI, and hemoglobin; model 3, adjusted for age, sex, BMI, hemoglobin, and creatinine. Abbreviations as in Tables 1,2.
During the median follow-up period of 32.4 months, a total of 28 patients died from any cause. Kaplan-Meier curves for cumulative survival in total HF cohort according to kynurenine level below/above median and tertiles are shown in
Figure 3. There was a significant difference in mortality across stratified kynurenine levels (log rank, P=0.03 vs. below and above the median; and P=0.03 among tertiles). Furthermore, those with the highest kynurenine tertile had worse prognosis than those with the middle and the lowest tertiles (P=0.01 and P=0.03, respectively) whereas there was no difference in survival between the middle and the lowest tertiles (P=0.55). On multivariate Cox proportional hazards analysis, higher kynurenine level was a predictor of death independently of age, sex, BMI, and hemoglobin (HR, 1.46; 95% CI: 1.15–1.86 for 1-μmol/L increase in kynurenine, P<0.01) but not after adjustment for those 4 factors plus creatinine (HR, 1.13; 95% CI: 0.85–1.51, P=0.41,
Table 4).

Table 4.
Cox Proportional Hazard Analysis for Death
| |
All HF (n=249) |
HFrEF (n=173) |
HFpEF (n=76) |
| HR |
95% CI |
P-value |
HR |
95% CI |
P-value |
HR |
95% CI |
P-value |
| Univariable |
| Age (10 years) |
1.26 |
0.86–1.85 |
0.23 |
1.32 |
0.87–1.99 |
0.19 |
1.76 |
0.44–7.02 |
0.42 |
| Male sex |
3.80 |
0.90–16.0 |
0.07 |
4.82 |
0.65–35.6 |
0.12 |
1.04 |
0.09–11.49 |
0.97 |
| NYHA functional class |
3.10 |
1.62–5.95 |
<0.001 |
2.54 |
1.31–4.93 |
<0.01 |
|
ND |
|
| BMI (kg/m2) |
0.96 |
0.89–1.03 |
0.23 |
0.96 |
0.89–1.04 |
0.31 |
1.02 |
0.85–1.23 |
0.82 |
| LVEF (10%) |
0.54 |
0.39–0.76 |
<0.001 |
0.47 |
0.29–0.76 |
<0.01 |
2.83 |
0.32–25.43 |
0.35 |
| HFrEF |
4.03 |
1.22–13.4 |
0.02 |
|
ND |
|
|
ND |
|
| Ischemic etiology |
2.48 |
1.09–5.64 |
0.03 |
1.69 |
0.68–4.24 |
0.26 |
2.35 |
0.21–26.72 |
0.49 |
| Hypertension |
1.05 |
0.40–2.77 |
0.92 |
1.18 |
0.44–3.17 |
0.74 |
|
ND |
|
| Diabetes |
1.22 |
0.58–2.56 |
0.60 |
1.22 |
0.55–2.69 |
0.62 |
2.38 |
0.22–26.21 |
0.48 |
| Atrial fibrillation |
2.47 |
1.15–5.32 |
0.02 |
2.11 |
0.94–4.76 |
0.07 |
4.30 |
0.39–47.45 |
0.23 |
| Laboratory findings |
| Creatinine (0.1 mg/dL) |
1.18 |
1.11–1.26 |
<0.001 |
1.13 |
1.06–1.22 |
<0.001 |
1.59 |
1.18–2.15 |
<0.01 |
| Urea (mg/dL) |
1.02 |
1.01–1.03 |
<0.001 |
1.02 |
1.00–1.03 |
<0.01 |
1.06 |
1.02–1.10 |
<0.01 |
| Hemoglobin (g/dL) |
0.82 |
0.63–1.07 |
0.14 |
0.81 |
0.61–1.06 |
0.13 |
0.83 |
0.36–1.90 |
0.65 |
| Albumin (g/L) |
0.94 |
0.86–1.02 |
0.13 |
0.95 |
0.87–1.04 |
0.25 |
0.88 |
0.59–1.30 |
0.52 |
| ALP (log) |
2.35 |
0.86–6.43 |
0.10 |
1.89 |
0.69–5.18 |
0.21 |
4.96 |
0.12–210.0 |
0.40 |
| GGT (log) |
1.66 |
1.11–2.49 |
0.01 |
1.51 |
0.98–2.35 |
0.06 |
1.57 |
0.43–5.75 |
0.50 |
| Total bilirubin (mg/dL) |
3.15 |
1.51–6.57 |
<0.01 |
2.58 |
1.21–5.52 |
0.01 |
3.12 |
0.02–408.9 |
0.65 |
| ALT (log) |
1.06 |
0.50–2.23 |
0.87 |
1.20 |
0.52–2.78 |
0.67 |
0.33 |
0.03–3.74 |
0.37 |
| AST (log) |
0.95 |
0.32–2.83 |
0.93 |
0.98 |
0.30–3.19 |
0.97 |
0.12 |
0.00–11.20 |
0.36 |
| High-sensitivity CRP (log) |
1.25 |
0.90–1.72 |
0.18 |
1.19 |
0.85–1.67 |
0.30 |
1.20 |
0.40–3.55 |
0.75 |
| Medications and devices |
| ACEI/ARB |
0.49 |
0.17–1.41 |
0.18 |
0.25 |
0.09–0.73 |
0.01 |
|
ND |
|
| β-blocker |
1.65 |
0.39–6.94 |
0.50 |
1.24 |
0.17–9.20 |
0.83 |
0.68 |
0.06–7.51 |
0.75 |
| MRA |
2.16 |
1.00–4.69 |
0.05 |
1.45 |
0.64–3.28 |
0.38 |
5.74 |
0.52–63.40 |
0.15 |
| Diuretic |
1.39 |
0.56–3.43 |
0.47 |
1.15 |
0.43–3.06 |
0.78 |
1.29 |
0.12–14.24 |
0.83 |
| ICD/CRT |
3.82 |
1.68–8.68 |
<0.01 |
2.72 |
1.09–6.81 |
0.03 |
4.45 |
0.40–49.42 |
0.22 |
| Functional capacity |
| Peak V̇O2 (mL/min/kg) |
0.81 |
0.74–0.90 |
<0.001 |
0.84 |
0.76–0.93 |
<0.01 |
0.70 |
0.46–1.08 |
0.11 |
| 6-min walk distance (100 m) |
0.57 |
0.43–0.75 |
<0.001 |
0.58 |
0.44–0.78 |
<0.001 |
0.57 |
0.24–1.32 |
0.19 |
| Skeletal muscle |
| Handgrip strength (10 kg) |
0.88 |
0.64–1.22 |
0.45 |
0.85 |
0.60–1.19 |
0.35 |
0.72 |
0.20–2.54 |
0.61 |
| Leg strength (10 kg) |
0.82 |
0.61–1.12 |
0.22 |
0.80 |
0.58–1.11 |
0.18 |
0.72 |
0.22–2.35 |
0.59 |
| ASMI (kg/m2) |
0.78 |
0.54–1.11 |
0.17 |
0.82 |
0.57–1.18 |
0.28 |
0.63 |
0.14–2.85 |
0.55 |
| Kynurenine (μmol/L) |
1.52 |
1.20–1.94 |
<0.001 |
1.40 |
1.10–1.79 |
<0.01 |
3.37 |
1.13–10.00 |
0.03 |
| Multivariable: model 1 |
| Kynurenine (μmol/L) |
1.48 |
1.15–1.89 |
<0.01 |
1.35 |
1.05–1.73 |
0.02 |
3.48 |
1.07–11.36 |
0.04 |
| Multivariable: model 1 |
| Kynurenine (μmol/L) |
1.46 |
1.15–1.86 |
<0.01 |
0.79 |
0.59–1.06 |
0.12 |
4.20 |
1.00–17.60 |
0.05 |
| Multivariable: model 1 |
| Kynurenine (μmol/L) |
1.13 |
0.85–1.51 |
0.41 |
1.14 |
0.84–1.54 |
0.40 |
5.83 |
0.23–147.3 |
0.28 |
Model 1, adjusted for age, sex, and BMI; model 2, adjusted for age, sex, BMI, and hemoglobin; model 3, adjusted for age, sex, BMI, hemoglobin, and creatinine. HR, hazard ratio; ND, not done. Other abbreviations as in Tables 1–3.
Discussion
Principal Findings
Among stable HF patients, plasma kynurenine level was inversely correlated with muscle strength (handgrip strength and leg strength) and functional capacity (peak V̇O2
in spiroergometry and 6-min walk distance) but not with muscle mass. The correlation between kynurenine and peak V̇O2
observed in the total HF and HFrEF groups was significant even after adjustment for age, sex, BMI, and hemoglobin, but not for serum creatinine. HF patients with high kynurenine had a poor prognosis. On Cox proportional hazard analysis, higher kynurenine remained as a significant negative prognostic factor after adjustment for age, sex, and BMI.
Potential Mechanisms
Although exercise-induced kynurenine degradation in skeletal muscle has been reported elsewhere,16,17
to the best of our knowledge, the present study is the first to report the association between kynurenine and muscle mass/function in humans. Most recently, Mudry et al reported a decline in kynurenine after exercise in humans,28
suggesting that exercise-induced kynurenine degradation may be one of the reasons for lower kynurenine in those with higher muscle strength and functional capacity. In contrast, in most previous studies, inflammatory processes were regarded as the principal pathophysiological mechanism in patients with activated kynurenine pathway.21,29,30
In the previous studies kynurenine-tryptophan ratio was treated as an established marker of interferon (IFN)-γ activity and T-helper 1 immune responses21,26
because the degradation from tryptophan into kynurenine is mediated mainly by indolamine 2,3-dioxygenase, which is not expressed unless stimulated by IFN-γ (Figure 4). Katz et al, however, advocated that the role of kynurenine metabolites in immune response and inflammation may not be simple,31,32
referring to the notion that depletion of tryptophan from T cells and/or tryptophan metabolites themselves might make T cells unable to trigger the appropriate immune reaction.33
In the present study, kynurenine was associated with CRP, as were some metabolites of the kynurenine pathway in previous studies.30
Given that inflammation is associated with muscle dysfunction34,35
and reduced functional capacity,36
inflammation may be a common background both for higher kynurenine and impaired functional capacity observed in the present study. Kynurenine is an endothelium-derived relaxing factor37
and may also be produced as a feedback mechanism to counteract vasoconstriction,21,38
which is frequently observed and measured as elevated systemic vascular resistance in right heart catheterization in patients with HF. Lewis et al have also hypothesized that kynurenines may be released as vasodilators in response to pulmonary hypertension.14
The vasodilating activity may be worthy of note given that endothelial (dys)function plays an important role not only in functional capacity but also in prognosis both in HFrEF and HFpEF,39–41
at least partially through skeletal muscle dysfunction.42
Oxidative stress or cytotoxicity produced by metabolites in the kynurenine pathway43,44
may have contributed to the present results. In the present study, creatinine and γ-glutamyltransferase remained independent predictors of higher kynurenine after multivariable adjustment. Given that patients with liver and/or renal disease have poor physical activity,45,46
the association between kynurenine and kidney and liver dysfunction may have influenced the present results. The positive correlation between kynurenine and creatinine observed in the present study is in line with previous reports, including our earlier study,30,47,48
and may reflect activated inflammation49
and reduced clearance50
in patients with chronic kidney disease. Plasma kynurenine was not statistically associated with peak V̇O2
when adjusted for creatinine as well as age, sex, BMI and hemoglobin in HFrEF. This suggests that the observed mild correlation between exercise capacity and plasma kynurenine on simple linear regression may be only a reflection of impaired exercise capacity in those with worse kidney function.

The association between high mortality and high kynurenine in the present study may be understandable with respect to the inverse relationship between kynurenine and functional capacity, because poor functional capacity is a strong predictor of mortality in HF.51
So far, the association between kynurenine level and poor outcome has been reported in several kinds of disease, concordant with the present results. Eussen et al reported that kynurenine was a predictor of acute coronary events in 2,819 individuals without known coronary artery disease at baseline. After adjustment for established cardiovascular risk factors, HR for the fourth vs. the first quartile of kynurenine was 1.86.21
Ristagno et al reported that high plasma kynurenine was associated with intensive care unit death and 12-month poor outcome in 245 patients resuscitated from out-of-hospital cardiac arrest.22,29
Study Limitations
The present study used only ELISA plasma kynurenine data, whereas in most of the previous studies, the concentration of several tryptophan metabolites in plasma and also in urine was measured on liquid chromatography/tandem mass spectrometry.29
In contrast, ELISA has the advantage of simplicity and convenience. The assay used seems to depend on the purpose of the study. For example, Pedersen et al advocated that the kynurenine-tryptophan ratio may be ideal to estimate the inflammatory activity.30
Because HFpEF and HFrEF have distinct phenotypes, the association between kynurenine level and muscle strength/functional capacity may be different between these 2 subgroups. Indeed, skeletal muscle strength was inversely associated with kynurenine level in HFrEF patients but not in HFpEF patients. The present cohort, however, had a small number of HFpEF patients, resulting in insufficient statistical assessment in this subgroup. Although the presence of depression was associated with higher kynurenine in this study, the questionnaire used (i.e., EQ-5D) was not specialized to detect depression but to assess general health status. It is not conclusive if the kynurenine pathway plays a role in depression in HF. Because the ability of kynurenine to predict mortality was modest, it remains to be determined whether kynurenine measurement can be justified in clinical practice. In addition, lack of plasma BNP data in the present study is a major limitation, especially in prognostication in HF. Given that the evidence for biomarkers reflecting muscle wasting in HF is scarce and warranted,52–54
further studies exploring the mechanisms underlying these associations are needed. Also, as seen in a recent study showing decline in kynurenine after exercise, measurement before and after intervention (involving exercise and drug treatment) may have some significance, and several drugs affecting the kynurenine pathway have been developed recently.13,15,55
Conclusions
In stable HF patients, plasma kynurenine was inversely correlated with muscle strength and functional capacity as well as liver/kidney function, but no significant correlation between kynurenine level and muscle mass was observed. HF patients with high kynurenine had poor prognosis. Further studies exploring the mechanisms underlying these associations are needed to justify its measurement in clinical practice.
Acknowledgments
Preparation of this manuscript was supported by DZHK (German Centre for Cardiovascular Research) and by BMBF (German Ministry of Education and Research).
Disclosures
S.v.H. has been a paid consultant to Vifor, Respicardia, Pfizer, Novartis, Roche, Sorin, and Thermo Fisher Scientific. He has received lecture fees from Amgen and Sanofi. S.D.A. has been a paid consultant to Bayer, Relypsa, Thermo Fisher Scientific, Novartis, LoneStar Heart and Vifor; he has received speaker fees from Novartis and Vifor; and his institution has received a research grant from Vifor Pharma and Abbott Vascular. T.B.D. is an employee of Immundiagnostik, which distributes the kynurenine ELISA. M.K., N.E., J.S., J.C.S., and W.D. declare no conflicts of interest.
Grants
European Commission’s 7th Framework programme (FP7/2003-2013).
Supplementary Files
Supplementary File 1
Table S1.
Independent indicators of higher kynurenine
Please find supplementary file(s);
http://dx.doi.org/10.1253/circj.CJ-16-0791
References
- 1.
McKee PA, Castelli WP, McNamara PM, Kannel WB. The natural history of congestive heart failure: The Framingham study. N Engl J Med 1971; 285: 1441–1446.
- 2.
Borlaug BA. Cardiac aging and the fountain of youth. Eur J Heart Fail 2016; 18: 611–612.
- 3.
Masoudi FA, Rumsfeld JS, Havranek EP, House JA, Peterson ED, Krumholz HM, et al. Age, functional capacity, and health-related quality of life in patients with heart failure. J Card Fail 2004; 10: 368–373.
- 4.
Myers J. Exercise capacity and prognosis in chronic heart failure. Circulation 2009; 119: 3165–3167.
- 5.
Lainscak M, Anker SD. Heart failure, chronic obstructive pulmonary disease, and asthma: Numbers, facts, and challenges. ESC Heart Fail 2015; 2: 103–107.
- 6.
Haykowsky MJ, Tomczak CR, Scott JM, Paterson DI, Kitzman DW. Determinants of exercise intolerance in patients with heart failure and reduced or preserved ejection fraction. J Appl Physiol (1985) 2015; 119: 739–744.
- 7.
Triposkiadis F, Giamouzis G, Parissis J, Starling RC, Boudoulas H, Skoularigis J, et al. Reframing the association and significance of co-morbidities in heart failure. Eur J Heart Fail 2016; 18: 744–758.
- 8.
Ebner N, Sliziuk V, Scherbakov N, Sandek A. Muscle wasting in ageing and chronic illness. ESC Heart Fail 2015; 2: 58–68.
- 9.
Borlaug BA. Mechanisms of exercise intolerance in heart failure with preserved ejection fraction. Circ J 2014; 78: 20–32.
- 10.
Piepoli MF, Guazzi M, Boriani G, Cicoira M, Corra U, Dalla Libera L, et al. Exercise intolerance in chronic heart failure: Mechanisms and therapies. Part I. Eur J Cardiovasc Prev Rehabil 2010; 17: 637–642.
- 11.
von Haehling S, Lainscak M, Doehner W, Ponikowski P, Rosano G, Jordan J, et al. Diabetes mellitus, cachexia and obesity in heart failure: Rationale and design of the Studies Investigating Co-morbidities Aggravating Heart Failure (SICA-HF). J Cachexia Sarcopenia Muscle 2010; 1: 187–194.
- 12.
Steinbeck L, Ebner N, Valentova M, Bekfani T, Elsner S, Dahinden P, et al. Detection of muscle wasting in patients with chronic heart failure using C-terminal agrin fragment: Results from the Studies Investigating Co-morbidities Aggravating Heart Failure (SICA-HF). Eur J Heart Fail 2015; 17: 1283–1293.
- 13.
Mole DJ, Webster SP, Uings I, Zheng X, Binnie M, Wilson K, et al. Kynurenine-3-monooxygenase inhibition prevents multiple organ failure in rodent models of acute pancreatitis. Nat Med 2016; 22: 202–209.
- 14.
Lewis GD, Ngo D, Hemnes AR, Farrell L, Domos C, Pappagianopoulos PP, et al. Metabolic profiling of right ventricular-pulmonary vascular function reveals circulating biomarkers of pulmonary hypertension. J Am Coll Cardiol 2016; 67: 174–189.
- 15.
Vecsei L, Szalardy L, Fulop F, Toldi J. Kynurenines in the CNS: Recent advances and new questions. Nat Rev Drug Discov 2013; 12: 64–82.
- 16.
Agudelo LZ, Femenia T, Orhan F, Porsmyr-Palmertz M, Goiny M, Martinez-Redondo V, et al. Skeletal muscle PGC-1alpha1 modulates kynurenine metabolism and mediates resilience to stress-induced depression. Cell 2014; 159: 33–45.
- 17.
Harkin A. Muscling in on depression. N Engl J Med 2014; 371: 2333–2334.
- 18.
Mole DJ, McFerran NV, Collett G, O’Neill C, Diamond T, Garden OJ, et al. Tryptophan catabolites in mesenteric lymph may contribute to pancreatitis-associated organ failure. Br J Surg 2008; 95: 855–867.
- 19.
Logters TT, Laryea MD, Altrichter J, Sokolowski J, Cinatl J, Reipen J, et al. Increased plasma kynurenine values and kynurenine-tryptophan ratios after major trauma are early indicators for the development of sepsis. Shock 2009; 32: 29–34.
- 20.
Pawlak K, Domaniewski T, Mysliwiec M, Pawlak D. The kynurenines are associated with oxidative stress, inflammation and the prevalence of cardiovascular disease in patients with end-stage renal disease. Atherosclerosis 2009; 204: 309–314.
- 21.
Eussen SJ, Ueland PM, Vollset SE, Nygard O, Midttun O, Sulo G, et al. Kynurenines as predictors of acute coronary events in the Hordaland Health Study. Int J Cardiol 2015; 189: 18–24.
- 22.
Ristagno G, Latini R, Vaahersalo J, Masson S, Kurola J, Varpula T, et al. Early activation of the kynurenine pathway predicts early death and long-term outcome in patients resuscitated from out-of-hospital cardiac arrest. J Am Heart Assoc 2014; 3: e001094.
- 23.
McMurray JJ, Adamopoulos S, Anker SD, Auricchio A, Bohm M, Dickstein K, et al. ESC Guidelines for the diagnosis and treatment of acute and chronic heart failure 2012: The Task Force for the Diagnosis and Treatment of Acute and Chronic Heart Failure 2012 of the European Society of Cardiology: Developed in collaboration with the Heart Failure Association (HFA) of the ESC. Eur Heart J 2012; 33: 1787–1847.
- 24.
Fulster S, Tacke M, Sandek A, Ebner N, Tschope C, Doehner W, et al. Muscle wasting in patients with chronic heart failure: Results from the studies investigating co-morbidities aggravating heart failure (SICA-HF). Eur Heart J 2013; 34: 512–519.
- 25.
Levey AS, Bosch JP, Lewis JB, Greene T, Rogers N, Roth D. A more accurate method to estimate glomerular filtration rate from serum creatinine: A new prediction equation. Modification of Diet in Renal Disease Study Group. Ann Intern Med 1999; 130: 461–470.
- 26.
EuroQol Group. EuroQol: A new facility for the measurement of health-related quality of life. Health Policy 1990; 16: 199–208.
- 27.
Ambrosy AP, Hernandez AF, Armstrong PW, Butler J, Dunning A, Ezekowitz JA, et al. The clinical course of health status and association with outcomes in patients hospitalized for heart failure: Insights from ASCEND-HF. Eur J Heart Fail 2016; 18: 306–313.
- 28.
Mudry JM, Alm PS, Erhardt S, Goiny M, Fritz T, Caidahl K, et al. Direct effects of exercise on kynurenine metabolism in people with normal glucose tolerance or type 2 diabetes. Diabetes Metab Res Rev 2016; 32: 754–761.
- 29.
Pedersen ER, Svingen GF, Schartum-Hansen H, Ueland PM, Ebbing M, Nordrehaug JE, et al. Urinary excretion of kynurenine and tryptophan, cardiovascular events, and mortality after elective coronary angiography. Eur Heart J 2013; 34: 2689–2696.
- 30.
Pedersen ER, Tuseth N, Eussen SJ, Ueland PM, Strand E, Svingen GF, et al. Associations of plasma kynurenines with risk of acute myocardial infarction in patients with stable angina pectoris. Arterioscler Thromb Vasc Biol 2015; 35: 455–462.
- 31.
Katz JB, Muller AJ, Prendergast GC. Indoleamine 2,3-dioxygenase in T-cell tolerance and tumoral immune escape. Immunol Rev 2008; 222: 206–221.
- 32.
Costantino G. New promises for manipulation of kynurenine pathway in cancer and neurological diseases. Expert Opin Ther Targets 2009; 13: 247–258.
- 33.
Kandanearatchi A, Brew BJ. The kynurenine pathway and quinolinic acid: Pivotal roles in HIV associated neurocognitive disorders. FEBS J 2012; 279: 1366–1374.
- 34.
Supinski GS, Callahan LA. Free radical-mediated skeletal muscle dysfunction in inflammatory conditions. J Appl Physiol (1985) 2007; 102: 2056–2063.
- 35.
Loncar G, Springer J, Anker M, Doehner W, Lainscak M. Cardiac cachexia: Hic et nunc. J Cachexia Sarcopenia Muscle 2016; 7: 246–260.
- 36.
Thierer J, Acosta A, Vainstein N, Sultan M, Francesia A, Marino J, et al. Relation of left ventricular ejection fraction and functional capacity with metabolism and inflammation in chronic heart failure with reduced ejection fraction (from the MIMICA Study). Am J Cardiol 2010; 105: 977–983.
- 37.
Wang Y, Liu H, McKenzie G, Witting PK, Stasch JP, Hahn M, et al. Kynurenine is an endothelium-derived relaxing factor produced during inflammation. Nat Med 2010; 16: 279–285.
- 38.
Mangge H, Stelzer I, Reininghaus EZ, Weghuber D, Postolache TT, Fuchs D. Disturbed tryptophan metabolism in cardiovascular disease. Curr Med Chem 2014; 21: 1931–1937.
- 39.
Fujisue K, Sugiyama S, Matsuzawa Y, Akiyama E, Sugamura K, Matsubara J, et al. Prognostic significance of peripheral microvascular endothelial dysfunction in heart failure with reduced left ventricular ejection fraction. Circ J 2015; 79: 2623–2631.
- 40.
Akiyama E, Sugiyama S, Matsuzawa Y, Konishi M, Suzuki H, Nozaki T, et al. Incremental prognostic significance of peripheral endothelial dysfunction in patients with heart failure with normal left ventricular ejection fraction. J Am Coll Cardiol 2012; 60: 1778–1786.
- 41.
Marti CN, Gheorghiade M, Kalogeropoulos AP, Georgiopoulou VV, Quyyumi AA, Butler J. Endothelial dysfunction, arterial stiffness, and heart failure. J Am Coll Cardiol 2012; 60: 1455–1469.
- 42.
Okita K, Kinugawa S, Tsutsui H. Exercise intolerance in chronic heart failure: Skeletal muscle dysfunction and potential therapies. Circ J 2013; 77: 293–300.
- 43.
Stone TW, Stoy N, Darlington LG. An expanding range of targets for kynurenine metabolites of tryptophan. Trends Pharmacol Sci 2013; 34: 136–143.
- 44.
Sallee M, Dou L, Cerini C, Poitevin S, Brunet P, Burtey S. The aryl hydrocarbon receptor-activating effect of uremic toxins from tryptophan metabolism: A new concept to understand cardiovascular complications of chronic kidney disease. Toxins (Basel) 2014; 6: 934–949.
- 45.
Hayashi F, Momoki C, Yuikawa M, Simotani Y, Kawamura E, Hagihara A, et al. Nutritional status in relation to lifestyle in patients with compensated viral cirrhosis. World J Gastroenterol 2012; 18: 5759–5770.
- 46.
Heiwe S, Jacobson SH. Exercise training for adults with chronic kidney disease. Cochrane Database Syst Rev 2011; (10): CD003236.
- 47.
Sulo G, Vollset SE, Nygard O, Midttun O, Ueland PM, Eussen SJ, et al. Neopterin and kynurenine-tryptophan ratio as predictors of coronary events in older adults, the Hordaland Health Study. Int J Cardiol 2013; 168: 1435–1440.
- 48.
Schefold JC, Zeden JP, Fotopoulou C, von Haehling S, Pschowski R, Hasper D, et al. Increased indoleamine 2,3-dioxygenase (IDO) activity and elevated serum levels of tryptophan catabolites in patients with chronic kidney disease: A possible link between chronic inflammation and uraemic symptoms. Nephrol Dial Transplant 2009; 24: 1901–1908.
- 49.
Saito K, Fujigaki S, Heyes MP, Shibata K, Takemura M, Fujii H, et al. Mechanism of increases in L-kynurenine and quinolinic acid in renal insufficiency. Am J Physiol Renal Physiol 2000; 279: F565–F572.
- 50.
Pawlak D, Tankiewicz A, Matys T, Buczko W. Peripheral distribution of kynurenine metabolites and activity of kynurenine pathway enzymes in renal failure. J Physiol Pharmacol 2003; 54: 175–189.
- 51.
Mancini DM, Eisen H, Kussmaul W, Mull R, Edmunds LH Jr, Wilson JR. Value of peak exercise oxygen consumption for optimal timing of cardiac transplantation in ambulatory patients with heart failure. Circulation 1991; 83: 778–786.
- 52.
de Boer RA, Daniels LB, Maisel AS, Januzzi JL Jr. State of the art: Newer biomarkers in heart failure. Eur J Heart Fail 2015; 17: 559–569.
- 53.
Drescher C, Konishi M, Ebner N, Springer J. Loss of muscle mass: Current developments in cachexia and sarcopenia focused on biomarkers and treatment. J Cachexia Sarcopenia Muscle 2015; 6: 303–311.
- 54.
Matsuo Y, Gleitsmann K, Mangner N, Werner S, Fischer T, Bowen TS, et al. Fibronectin type III domain containing 5 expression in skeletal muscle in chronic heart failure: Relevance of inflammatory cytokines. J Cachexia Sarcopenia Muscle 2015; 6: 62–72.
- 55.
Amaral M, Levy C, Heyes DJ, Lafite P, Outeiro TF, Giorgini F, et al. Structural basis of kynurenine 3-monooxygenase inhibition. Nature 2013; 496: 382–385.

