Abstract
Background:
This study determined the current status of the incidence, management, and prognosis of stroke in Japan using a population-based stroke registry.
Methods and Results:
Shiga Stroke Registry is an ongoing population-based registry that covers approximately 1.4 million residents of Shiga Prefecture. Cases of acute stroke were identified using standard definitions through surveillance of both all acute-care hospitals with neurology/neurosurgery facilities and death certificates in 2011. A total of 2,956 stroke cases and 2,176 first-ever stroke cases were identified. The age- and sex-adjusted incidence rate for first-ever stroke using the 2013 European Standard Population as standard was per 100,000 person-years: 91.3 for ischemic stroke, 36.4 for intracerebral hemorrhage, and 13.7 for subarachnoid hemorrhage. It was estimated that approximately 220,000 new strokes occurred in 2011 in Japan. Among the 2,956 cases, most stroke patients underwent neuroimaging, 268 received surgical or endovascular treatment, and 2,158 had rehabilitation therapy; 78 patients received intravenous thrombolysis. A total of 1,846 stroke patients had died or were dependent at hospital discharge, and 390 died within 28 days of onset.
Conclusions:
Incidence rates of stroke by subtypes were clarified and the total number of new strokes in Japan was estimated. More than half of stroke patients die or become dependent after a stroke. This study re-emphasized the importance of public health measures in reducing the burden of stroke in Japan.
In Japan, the age-standardized mortality rate for stroke has rapidly decreased over the past 5 decades.1
However, stroke is still one of the leading causes of death2
and disability.3
Furthermore, because of the rapid aging of the Japanese population, the absolute number of stroke patients is expected to increase. Effective prevention will require a strategy based on accurate knowledge of the current burden of stroke in Japan. However, there exist only a limited number of population-based registries providing information on the current incidence, management, and prognosis of stroke patients in the real-world setting. The aim of the present study was to investigate the current incidence rates, management, and short-term outcomes of stroke using data from a large-scale, population-based stroke registry in Shiga Prefecture, Japan.
Methods
Study Design
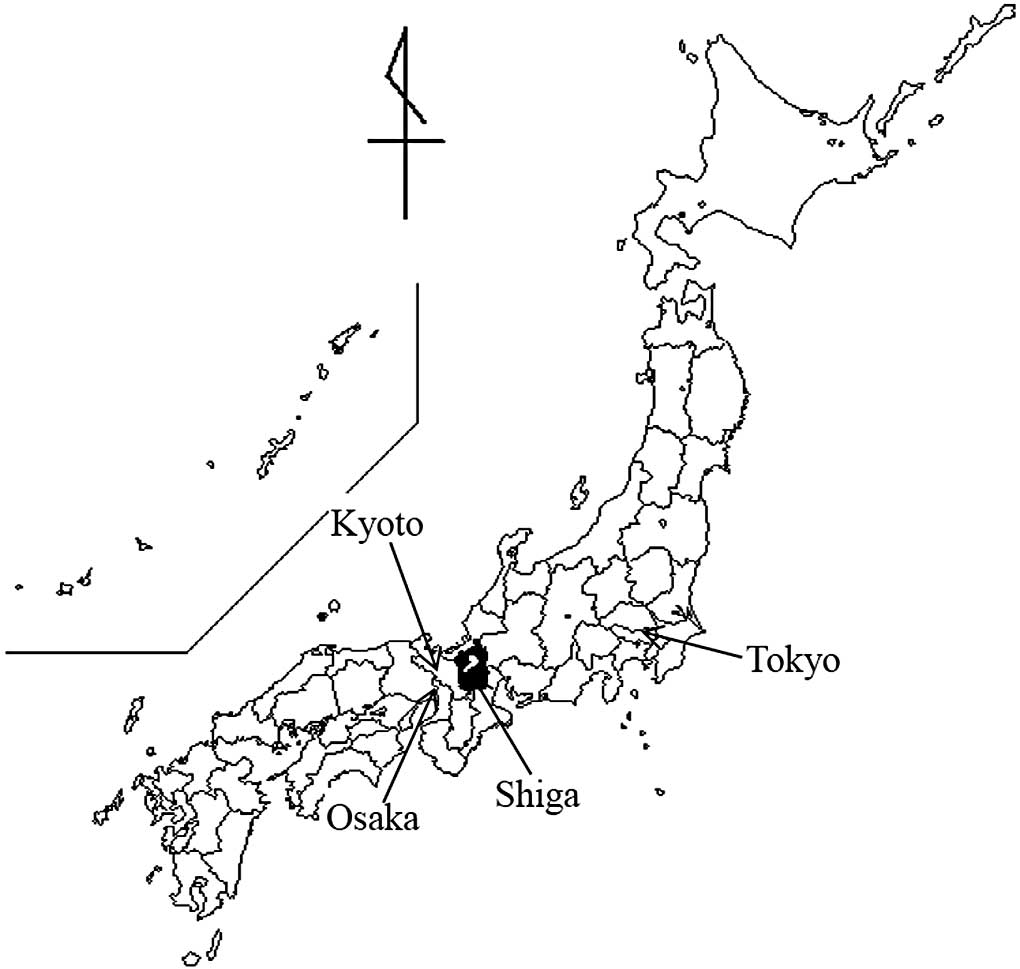
The Shiga Stroke Registry (SSR) is an ongoing multicenter population-based registry study designed to build a complete information system for the management of acute ischemic and non-traumatic hemorrhagic stroke in Shiga Prefecture, Japan. Shiga Prefecture is located in the central part of Honshu Island, more than half of whose residents live in an urban area (Keihanshin Metropolitan Area as specified by the Ministry of Internal Affairs and Communications) (Figure 1). The population of Shiga Prefecture was 1,400,745 (689,859 men and 710,866 women) in the 2011 census. The SSR uses central local coordination and monitoring, combined with remote data collection and quality control systems, to create an integrated surveillance system involving the registration of cases among a network of all acute-care hospitals with neurology/neurosurgery facilities and smaller hospitals with rehabilitation facilities in Shiga Prefecture. Information on the death certificates of all deceased residents is also collected to help detect all cases of stroke, including those leading to rapid death outside hospital, with the approval of the Ministry of Health, Labour and Welfare. All cases of stroke from January 1 to December 31, 2011, were included in the present analysis. The SSR has been approved by the Institutional Review Board of Shiga University of Medical Science.
All stroke cases were ascertained by medical record audit by trained investigators. Information on clinical features, including the Japan Coma Scale score4
on admission, neuroimaging, management, post-stroke rehabilitation therapy, and in-hospital outcomes including modified Rankin scale (mRS) score5
at hospital discharge, was also obtained for all stroke cases. Data were extracted from medical records of the 41 hospitals in the study region by trained investigators using electronic Case Record Forms on a tablet computer. These data were gathered in a central, encrypted database located at Shiga University of Medical Science. Variables were checked for completeness and accuracy by the trained staff; any apparent errors and omissions in the data that required clarification generated queries for resolution. Fatal stroke cases were also confirmed from death certificates and/or autopsy reports.
Definition of Stroke and Its Subtypes
Diagnosis of stroke was defined as sudden onset of focal neurological deficits persisting for more than 24 h according to the Monitoring of Trends and Determinants in Cardiovascular Disease (WHO-MONICA) projects.6
Stroke was then classified as ischemic stroke, intracerebral hemorrhage, subarachnoid hemorrhage, and undetermined type. Ischemic stroke was further divided into 4 clinical categories, namely lacunar infarction, large-artery infarction, cardioembolic infarction, or undetermined type, based on the criteria for the type of stroke in the TOAST study.7
All stroke cases were adjudicated by more than 2 independent investigators. Excellent agreement was observed between investigators (kappa coefficient=0.83 for diagnosis of stroke, 0.93 for stroke subtypes, and 0.85 for ischemic stroke subtypes). For the few cases for which there was a disagreement, more than 3 investigators discussed the cases and consensus was reached in all cases.
Statistical Analysis
The incidence rates of stroke were estimated by the person-year approach (per 100,000 person-years) using 2011 vital statistics. Incidence rates were standardized for age and sex using a direct method with the 2013 European Standard Population.8
We also calculated the age- and sex-standardized incidence rates using the 2010 Japanese population9
as standard and the 2000 World Standard Population (WHO2000).10
Absolute stroke incidence in Japan was estimated using age- and sex-stratified incidence rates and the population of the 2011 Japanese vital statistics. The 95% confidence intervals (CIs) of incidence rates were calculated using a Poisson distribution.
Results
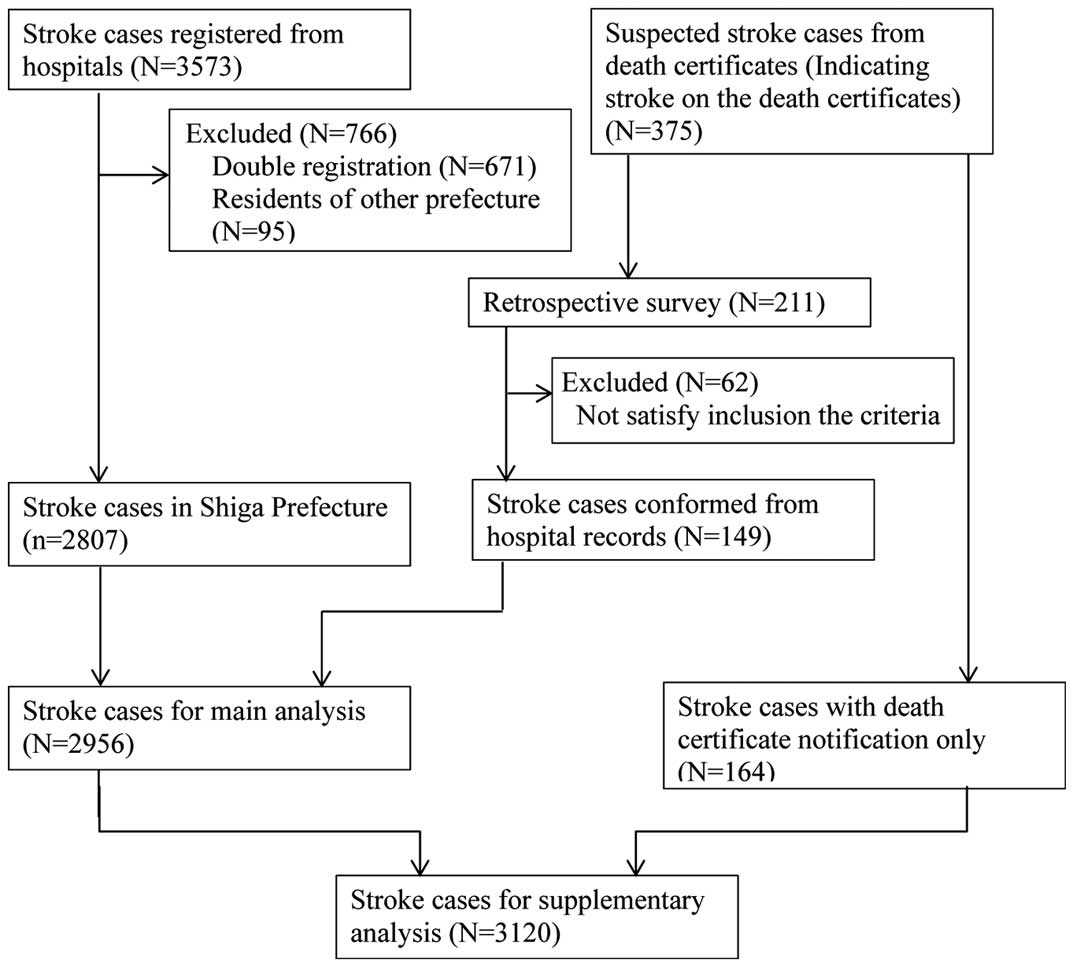
From January 1 to December 31, a total of 3,573 cases were registered from hospital (Figure 2). From these, double-registered cases (766) and residents of other prefectures (95) were excluded. We also identified 375 cases of possible stroke from death certificates (death certificate notification cases). Among these, clinical information was available for 211 patients and stroke diagnoses were confirmed by medical records for 149 of them. Finally, a total of 2,956 cases (2,807 from hospital registry and 149 from death certificate with definite clinical diagnosis) of stroke were identified. There were also 164 patients (5.2%) with death certificate information only who did not have definitive medical information to satisfy the definition of stroke. The total number of stroke cases, including those with death certificate information only, was 3,120 (Figure 2).
The baseline characteristics and final diagnoses of the 2,956 patients are shown in
Table 1. The mean age was 74.1 years, and 46.6% were women. A total of 2,176 patients (73.6%) had their first-ever stroke and 780 (26.4%) had recurrent stroke. The number of patients in each subcategory was 1,948 (65.9%) for ischemic stroke (477 lacunar, 618 large-artery, and 527 cardioembolic infarction), 751 (25.4%) for intracerebral hemorrhage, and 226 (7.6%) for subarachnoid hemorrhage. The total number of stroke patients with atrial fibrillation was 582 (19.7%). Among the ischemic stroke patients, 496 (25.5%) had atrial fibrillation: 16 (3.4%) for lacunar, 35 (5.7%) for large-artery infarction, and 421 (80.5%) for cardioembolic infarction.
Table 1.
Characteristics and Final Diagnosis of Patients With Acute Stroke in the Shiga Stroke Registry (n=2,956)
| |
Median (IQR)
or n (%) |
| Demographics |
| Age (years) |
76.2 (65.9–84.0) |
| Women |
1,377 (46.6) |
| Risk factors |
| Current smoking |
562 (19.0) |
| Past medical history |
| Atrial fibrillation |
582 (19.7) |
| Coronary artery disease |
180 (6.1) |
| Pre-stroke disability (mRS ≥2) |
826 (27.9) |
| Prior stroke |
780 (26.4) |
| Ischemic stroke |
642 (21.7) |
| Intracerebral hemorrhage |
153 (5.2) |
| Subarachnoid hemorrhage |
38 (1.3) |
| Transient ischemic attack |
124 (4.2) |
| Medication before onset |
| Blood pressure-lowering treatment |
1,487 (50.3) |
| Oral anticoagulant |
286 (9.7) |
| Glucose-lowering treatment |
455 (15.4) |
| Lipid-lowering treatment |
443 (15.0) |
| Clinical features |
| First-ever stroke |
2,176 (73.6) |
| Recurrent stroke |
780 (26.4) |
| Days from onset to admission |
0 (0–1) |
| Symptoms |
| Unil ateral weakness |
1,889 (63.9) |
| Dysphasia |
1,598 (54.1) |
| Sensory deficit |
862 (29.2) |
| Japan Coma Scale* |
| 0 |
1,335 (45.2) |
| 1–3 |
740 (25.0) |
| 10–30 |
359 (12.1) |
| 100–300 |
504 (17.1) |
| Final diagnosis |
| Ischemic stroke |
1,948 (65.9) |
| Lacunar infarction |
477 (24.5) |
| Large-artery infarction |
618 (31.7) |
| Cardioembolic infarction |
527 (27.1) |
| Other/undetermined |
326 (16.7) |
| Intracerebral hemorrhage |
751 (25.4) |
| Subarachnoid hemorrhage |
226 (7.6) |
| Stroke of unknown type |
31 (1.0) |
*0 indicates “alert,” 1–3 indicates “possible eye-opening, not lucid,” 10–30 indicates “possible eye-opening upon stimulation,” and 100–300 indicates “no eye-opening and coma.” IQR, interquartile range; mRS, modified Rankin scale.
Incidence rates of stroke and its subtypes are shown in
Table 2
and
Table 3. The age- and sex-adjusted incidence rate of first-ever stroke using the 2013 European Standard Population as standard was 142.9 per 100,000 person-years (95% CI 123.3–168.5): 91.3 per 100,000 person-years for ischemic stroke (23.4 for lacunar, 28.6 for large-artery, and 22.5 for cardioembolic infarction), 36.4 for intracerebral hemorrhage, and 14.3 for subarachnoid hemorrhage (Table 2). When the 2010 Japanese Population and the World Standard Population were used as standard, age- and sex-standardized incidence rates of first-ever stroke were 165.5 and 69.8 per 100,000 person-years, respectively (Table 2). The age- and sex-standardized incidence rate of stroke (first-ever and recurrent) was 192.8 per 100,000 person-years (95% CI 170.5–221.6): 126.3 per 100,000 person-years for ischemic stroke, 49.3 for intracerebral hemorrhage, and 15.4 for subarachnoid hemorrhage (Table 3). The annual estimated number of first-ever stroke cases in Japan was 215,606 and that of recurrent stroke was 77,987 (Table 4). Incidence rates of stroke, including cases with death certificate information only, are also shown in
Table S1. The age- and sex-standardized incidence rate of stroke (first-ever, recurrent and death certificate information only) was 203.2 per 100,000 person-years: 129.9 per 100,000 person-years for ischemic stroke, 53.1 for intracerebral hemorrhage, and 17.5 for subarachnoid hemorrhage (Table S1).
Table 2.
IR of First-Ever Stroke and Its Subtypes (per 100,000 Person-Years) in Shiga Stroke Registry, Shiga, Japan, 2011
| Age and sex |
Population |
Total stroke |
Ischemic stroke |
Intracerebral
hemorrhage |
Subarachnoid
hemorrhage |
| n |
IR |
95% CI |
n |
IR |
95% CI |
n |
IR |
95% CI |
n |
IR |
95% CI |
| Men |
| 0–34 |
275,099 |
14 |
5.1 |
2.8–8.5 |
6 |
2.2 |
0.8–4.7 |
2 |
0.7 |
0.1–2.6 |
6 |
2.2 |
0.8–4.7 |
| 35–44 |
106,181 |
47 |
44.3 |
32.5–
58.9 |
24 |
22.6 |
14.5–
33.6 |
16 |
15.1 |
8.6–
24.5 |
6 |
5.7 |
2.1–12.3 |
| 45–54 |
82,778 |
88 |
106.3 |
85.3–
131.0 |
54 |
65.2 |
49.0–
85.1 |
23 |
27.8 |
17.6–
41.7 |
11 |
13.3 |
6.6–23.8 |
| 55–64 |
98,534 |
245 |
248.6 |
218.5–
281.8 |
140 |
142.1 |
119.5–
167.7 |
82 |
83.2 |
66.2–
103.3 |
20 |
20.3 |
12.4–31.3 |
| 65–74 |
71,418 |
306 |
428.5 |
381.8–
479.3 |
236 |
330.4 |
289.6–
375.4 |
60 |
84.0 |
64.1–
108.1 |
9 |
12.6 |
5.8–23.9 |
| 75–84 |
44,641 |
319 |
714.6 |
638.3–
797.5 |
231 |
517.5 |
452.9–
588.7 |
72 |
161.3 |
126.2–
203.1 |
9 |
20.2 |
9.2–38.3 |
| ≥85 |
11,208 |
119 |
1,061.7 |
879.6–
1,270.5 |
92 |
820.8 |
661.7–
1,006.7 |
25 |
223.1 |
144.3–
329.3 |
0 |
– |
– |
| Total |
689,859 |
1,138 |
165.0 |
155.5–
174.8 |
783 |
113.5 |
105.7–
121.7 |
280 |
40.6 |
36.0–
45.6 |
61 |
8.8 |
6.8–11.4 |
| Age-adjusted rate* |
| ESP2013 |
|
|
173.7 |
140.1–
215.9 |
|
120.6 |
93.7–
155.9 |
|
42.2 |
27.0–
64.1 |
|
8.8 |
3.1–20.8 |
| JP2010 |
|
|
176.2 |
143.3–
217.0 |
|
121.5 |
95.2–
155.4 |
|
43.2 |
28.2–
64.5 |
|
9.3 |
3.3–21.9 |
| WHO2000 |
|
|
87.0 |
68.5–
112.1 |
|
57.6 |
43.5–
77.7 |
|
22.0 |
13.9–
34.1 |
|
6.4 |
2.1–15.9 |
| Women |
| 0–34 |
258,574 |
9 |
3.5 |
1.6–6.6 |
2 |
0.8 |
0.1–2.8 |
6 |
2.3 |
0.9–5.1 |
1 |
0.4 |
0.0–2.2 |
| 35–44 |
103,470 |
22 |
21.3 |
13.3–
32.2 |
7 |
6.8 |
2.7–
13.9 |
6 |
5.8 |
2.1–
12.6 |
9 |
8.7 |
4.0–
16.5 |
| 45–54 |
83,925 |
55 |
65.5 |
49.4–
85.3 |
16 |
19.1 |
10.9–
31.0 |
21 |
25.0 |
15.5–
38.2 |
18 |
21.4 |
12.7–
33.9 |
| 55–64 |
100,078 |
119 |
118.9 |
98.5–
142.3 |
53 |
53.0 |
39.7–
69.3 |
37 |
37.0 |
26.0–
51.0 |
29 |
29.0 |
19.4–
41.6 |
| 65–74 |
75,692 |
185 |
244.4 |
210.5–
282.3 |
108 |
142.7 |
117.0–
172.3 |
43 |
56.8 |
41.1–
76.5 |
33 |
43.6 |
30.0–
61.2 |
| 75–84 |
59,129 |
326 |
551.3 |
493.1–
614.6 |
202 |
341.6 |
296.1–
392.1 |
88 |
148.8 |
119.4–
183.4 |
31 |
52.4 |
35.6–
74.4 |
| ≥85 |
30,018 |
322 |
1,072.7 |
958.7–
1,196.5 |
227 |
756.2 |
661.0–
861.3 |
70 |
233.2 |
181.8–
294.6 |
19 |
63.3 |
38.1–
98.8 |
| Total |
710,886 |
1,038 |
146.0 |
137.3–
155.2 |
615 |
86.5 |
79.8–
93.6 |
271 |
38.1 |
33.7–
42.9 |
140 |
19.7 |
16.6–
23.2 |
| Age-adjusted rate* |
| ESP2013 |
|
|
115.2 |
92.7–147.7 |
|
65.5 |
50.5–88.0 |
|
31.1 |
19.6–51.3 |
|
17.4 |
9.1–31.3 |
| JP2010 |
|
|
154.5 |
125.3–
191.6 |
|
91.4 |
70.9–
118.2 |
|
40.3 |
26.0–
63.0 |
|
20.9 |
11.0–
36.9 |
| WHO2000 |
|
|
53.6 |
40.4–
74.7 |
|
27.4 |
19.7–
39.9 |
|
15.7 |
8.8–
30.7 |
|
10.0 |
5.0–19.0 |
| Men and women |
| Total |
1,400,745 |
2,176 |
155.3 |
148.9–
162.0 |
1,398 |
99.8 |
94.6–
105.2 |
551 |
39.3 |
36.1–
42.8 |
201 |
14.3 |
12.4–
16.5 |
| Age- and sex-adjusted rate* |
| ESP2013 |
|
|
142.9 |
123.3–
168.5 |
|
91.3 |
76.5–
111.2 |
|
36.4 |
26.6–
50.6 |
|
13.7 |
7.8–23.2 |
| JP2010 |
|
|
165.5 |
142.7–
192.6 |
|
106.6 |
89.2–
127.9 |
|
41.8 |
30.8–
57.0 |
|
15.2 |
8.7–25.4 |
| WHO2000 |
|
|
69.8 |
58.1–85.7 |
|
41.9 |
33.7–53.6 |
|
18.8 |
13.0–28.4 |
|
8.4 |
4.6–15.2 |
| Age and sex |
Ischemic stroke |
| Lacunar infarction |
Large-artery infarction |
Cardioembolic infarction |
Other/undetermined |
| n |
IR |
95% CI |
n |
IR |
95% CI |
n |
IR |
95% CI |
n |
IR |
95% CI |
| Men |
| 0–34 |
1 |
0.4 |
0.0–2.0 |
3 |
1.1 |
0.2–3.2 |
0 |
– |
– |
2 |
0.7 |
0.1–2.6 |
| 35–44 |
7 |
6.6 |
2.7–13.6 |
3 |
2.8 |
0.6–8.3 |
0 |
– |
– |
14 |
13.2 |
7.2–22.1 |
| 45–54 |
22 |
26.6 |
16.7–40.2 |
17 |
20.5 |
12.0–32.9 |
3 |
3.6 |
0.7–10.6 |
12 |
14.5 |
7.5–25.3 |
| 55–64 |
48 |
48.7 |
35.9–
64.6 |
47 |
47.7 |
35.0–
63.4 |
19 |
19.3 |
11.6–
30.1 |
26 |
26.4 |
17.2–
38.7 |
| 65–74 |
62 |
86.8 |
66.6–
111.3 |
73 |
102.2 |
80.1–
128.5 |
51 |
71.4 |
53.2–
93.9 |
50 |
70.0 |
52.0–
92.3 |
| 75–84 |
54 |
121.0 |
90.9–
157.8 |
88 |
197.1 |
158.1–
242.9 |
61 |
136.6 |
104.5–
175.5 |
28 |
62.7 |
41.7–
90.7 |
| ≥85 |
14 |
124.9 |
68.3–
209.6 |
31 |
276.6 |
187.9–
392.6 |
36 |
321.2 |
225.0–
444.7 |
11 |
98.1 |
49.0–
175.6 |
| Total |
208 |
30.2 |
26.2–34.5 |
262 |
38.0 |
33.5–42.9 |
170 |
24.6 |
21.1–28.6 |
143 |
20.7 |
17.5–24.4 |
| Age-adjusted rate* |
| ESP2013 |
|
31.6 |
19.0–50.9 |
|
40.0 |
25.9–62.0 |
|
27.4 |
16.8–43.4 |
|
21.7 |
11.2–39.5 |
| JP2010 |
|
32.3 |
19.9–51.1 |
|
40.7 |
26.8–61.9 |
|
26.4 |
16.4–41.3 |
|
22.2 |
11.8–39.4 |
| WHO2000 |
|
16.3 |
9.7–27.0 |
|
18.8 |
11.7–31.5 |
|
10.8 |
6.5–17.7 |
|
11.7 |
5.9–22.4 |
| Women |
| 0–34 |
0 |
– |
– |
1 |
0.4 |
0.0–2.2 |
0 |
– |
– |
1 |
0.4 |
0.0–2.2 |
| 35–44 |
2 |
1.9 |
0.2–7.0 |
3 |
2.9 |
0.6–8.5 |
0 |
– |
– |
2 |
1.9 |
0.2–7.0 |
| 45–54 |
3 |
3.6 |
0.7–10.4 |
5 |
6.0 |
1.9–13.9 |
4 |
4.8 |
1.3–12.2 |
4 |
4.8 |
1.3–12.2 |
| 55–64 |
16 |
16.0 |
9.1–26.0 |
19 |
19.0 |
11.4–29.6 |
6 |
6.0 |
2.2–13.0 |
12 |
12.0 |
6.2–20.9 |
| 65–74 |
32 |
42.3 |
28.9–
59.7 |
28 |
37.0 |
24.6–
53.5 |
19 |
25.1 |
15.1–
39.2 |
29 |
38.3 |
25.7–
55.0 |
| 75–84 |
51 |
86.3 |
64.2–
113.4 |
51 |
86.3 |
64.2–
113.4 |
63 |
106.5 |
81.9–
136.3 |
37 |
62.6 |
44.1–
86.3 |
| ≥85 |
40 |
133.3 |
95.2–
181.5 |
70 |
233.2 |
181.8–
294.6 |
92 |
306.5 |
247.1–
375.9 |
25 |
83.3 |
53.9–
122.9 |
| Total |
144 |
20.3 |
17.1–23.8 |
177 |
24.9 |
21.4–28.8 |
184 |
25.9 |
22.3–29.9 |
110 |
15.5 |
12.7–18.6 |
| Age-adjusted rate* |
| ESP2013 |
|
16.0 |
9.2–27.7 |
|
18.7 |
11.0–32.3 |
|
18.2 |
11.8–29.4 |
|
12.6 |
6.4–24.1 |
| JP2010 |
|
21.7 |
12.6–35.9 |
|
26.2 |
15.9–42.6 |
|
27.0 |
17.7–41.0 |
|
16.6 |
8.6–30.3 |
| WHO2000 |
|
6.9 |
3.7–13.0 |
|
8.1 |
4.2–15.8 |
|
6.5 |
3.8–11.7 |
|
5.9 |
2.7–12.8 |
| Men and women |
| Total |
352 |
25.1 |
22.6–27.9 |
439 |
31.3 |
28.5–34.4 |
354 |
25.3 |
22.7–28.0 |
253 |
18.1 |
15.9–20.4 |
| Age- and sex-adjusted ratea* |
| ESP2013 |
|
23.4 |
16.2–33.6 |
|
28.6 |
20.7–40.3 |
|
22.5 |
16.5–31.2 |
|
16.8 |
10.6–26.6 |
| JP2010 |
|
26.9 |
18.7–38.2 |
|
33.5 |
24.3–46.2 |
|
26.8 |
19.5–36.5 |
|
19.3 |
12.3–29.9 |
| WHO2000 |
|
11.5 |
7.6–17.2 |
|
13.2 |
8.9–20.1 |
|
8.5 |
5.9–12.4 |
|
8.8 |
5.1–15.1 |
*Standardized for age to the 2013 European Standard Population (ESP2013), the 2010 Japanese Population (JP2010) and the 2000 World Standard Population (WHO2000) using direct method. CI, confidence interval; IR, incidence rates.
Table 3.
IR of Stroke (First-Ever and Recurrent) and Its Subtypes (per 100,000 Person-Years) in Shiga Stroke Registry, Shiga, Japan, 2011
| Age and sex |
Population |
Total stroke |
Ischemic stroke |
Intracerebral
hemorrhage |
Subarachnoid
hemorrhage |
| n |
IR |
95% CI |
n |
IR |
95% CI |
n |
IR |
95% CI |
n |
IR |
95% CI |
| Men |
| 0–34 |
275,099 |
15 |
5.5 |
3.1–9.0 |
6 |
2.2 |
0.8–4.7 |
3 |
1.1 |
0.2–3.2 |
6 |
2.2 |
0.8–4.7 |
| 35–44 |
106,181 |
50 |
47.1 |
35.0–
62.1 |
27 |
25.4 |
16.8–
37.0 |
16 |
15.1 |
8.6–
24.5 |
6 |
5.7 |
2.1–12.3 |
| 45–54 |
82,778 |
100 |
120.8 |
98.3–
146.9 |
58 |
70.1 |
53.2–
90.6 |
30 |
36.2 |
24.5–
51.7 |
12 |
14.5 |
7.5–25.3 |
| 55–64 |
98,534 |
308 |
312.6 |
278.6–
349.5 |
174 |
176.6 |
151.3–
204.9 |
109 |
110.6 |
90.8–
133.4 |
20 |
20.3 |
12.4–31.3 |
| 65–74 |
71,418 |
418 |
585.3 |
530.5–
644.2 |
321 |
449.5 |
401.6–
501.4 |
86 |
120.4 |
96.3–
148.7 |
10 |
14.0 |
6.7–25.8 |
| 75–84 |
44,641 |
503 |
1,126.8 |
1,030.4–
1,229.7 |
372 |
833.3 |
750.8–
922.5 |
112 |
250.9 |
206.6–
301.9 |
11 |
24.6 |
12.3–
44.1 |
| ≥85 |
11,208 |
185 |
1,650.6 |
1,421.3–
1,906.4 |
147 |
1,311.6 |
1,108.1–
1,541.5 |
35 |
312.3 |
217.5–
434.3 |
0 |
– |
– |
| Total |
689,859 |
1,579 |
228.9 |
217.7–
240.5 |
1,105 |
160.2 |
150.9–
169.9 |
391 |
56.7 |
51.2–
62.6 |
65 |
9.4 |
7.3–12.0 |
| Age-adjusted rate* |
| ESP2013 |
|
|
241.9 |
202.6–
290.1 |
|
171.1 |
139.2–
211.3 |
|
58.7 |
40.6–
84.1 |
|
9.4 |
3.5–21.6 |
| JP2010 |
|
|
244.5 |
206.1–
291.0 |
|
171.4 |
140.4–
210.0 |
|
60.4 |
42.4–
85.1 |
|
10.0 |
3.7–22.7 |
| WHO2000 |
|
|
115.8 |
94.8–
143.4 |
|
78.0 |
61.8–
100.0 |
|
30.0 |
20.3–
44.2 |
|
6.7 |
2.3–16.3 |
| Women |
| 0–34 |
258,574 |
10 |
3.9 |
1.9–7.1 |
2 |
0.8 |
0.1–2.8 |
6 |
2.3 |
0.9–5.1 |
2 |
0.8 |
0.1–2.8 |
| 35–44 |
103,470 |
24 |
23.2 |
14.9–
34.5 |
8 |
7.7 |
3.3–
15.2 |
7 |
6.8 |
2.7–
13.9 |
9 |
8.7 |
4.0–16.5 |
| 45–54 |
83,925 |
59 |
70.3 |
53.5–
90.7 |
18 |
21.4 |
12.7–
33.9 |
22 |
26.2 |
16.4–
39.7 |
19 |
22.6 |
13.6–
35.4 |
| 55–64 |
100,078 |
142 |
141.9 |
119.5–
167.2 |
68 |
67.9 |
52.8–
86.1 |
44 |
44.0 |
31.9
–59.0 |
30 |
30.0 |
20.2–
42.8 |
| 65–74 |
75,692 |
230 |
303.9 |
265.9–
345.8 |
131 |
173.1 |
144.7–
205.4 |
61 |
80.6 |
61.6–
103.5 |
37 |
48.9 |
34.4–
67.4 |
| 75–84 |
59,129 |
450 |
761.0 |
692.3–
834.7 |
277 |
468.5 |
414.9–
527.0 |
127 |
214.8 |
179.1–
255.6 |
40 |
67.6 |
48.3–
92.1 |
| ≥85 |
30,018 |
462 |
1,539.1 |
1,401.9–
1,686.0 |
339 |
1,129.3 |
1,012.3–
1,256.2 |
93 |
309.8 |
250.1–
379.5 |
24 |
80.0 |
51.2–
119.0 |
| Total |
710,886 |
1,377 |
193.7 |
183.6–
204.2 |
843 |
118.6 |
110.7–
126.9 |
360 |
50.6 |
45.5–
56.2 |
161 |
22.6 |
19.3–
26.4 |
| Age-adjusted rate* |
| ESP2013 |
|
|
150.5 |
125.3–
186.3 |
|
88.4 |
71.3–
113.6 |
|
40.8 |
27.7–
62.6 |
|
19.9 |
10.8–
34.5 |
| JP2010 |
|
|
204.9 |
171.6–
246.0 |
|
125.0 |
101.2–
155.0 |
|
53.8 |
37.3–
78.6 |
|
24.1 |
13.3–
40.9 |
| WHO2000 |
|
|
67.3 |
52.7–
89.8 |
|
35.8 |
27.1–
49.3 |
|
19.8 |
12.1–
35.4 |
|
11.2 |
5.8–
20.6 |
| Men and women |
| Total |
1,400,745 |
2,956 |
211.0 |
203.5–
218.8 |
1,948 |
139.1 |
133.0–
145.4 |
751 |
53.6 |
49.8–
57.6 |
226 |
16.1 |
14.1–
18.4 |
| Age- and sex-adjusted rate* |
| ESP2013 |
|
|
192.8 |
170.5–
221.6 |
|
126.3 |
109.2–
148.9 |
|
49.3 |
38.0–
65.1 |
|
15.4 |
9.1–25.4 |
| JP2010 |
|
|
225.1 |
198.8–
255.5 |
|
148.5 |
128.2–
172.7 |
|
57.1 |
44.2–
74.1 |
|
17.1 |
10.2–
27.8 |
| WHO2000 |
|
|
90.4 |
77.4–
107.7 |
|
55.7 |
46.5–
68.4 |
|
24.7 |
18.1–
35.1 |
|
9.2 |
5.1–16.3 |
| Age and sex |
Ischemic stroke |
| Lacunar infarction |
Large-artery infarction |
Cardioembolic infarction |
Other/undetermined |
| n |
IR |
95% CI |
n |
IR |
95% CI |
n |
IR |
95% CI |
n |
IR |
95% CI |
| Men |
| 0–34 |
1 |
0.4 |
0.0–2.0 |
3 |
1.1 |
0.2–3.2 |
0 |
– |
– |
2 |
0.7 |
0.1–2.6 |
| 35–44 |
8 |
7.5 |
3.3–14.8 |
5 |
4.7 |
1.5–11.0 |
0 |
– |
– |
14 |
13.2 |
7.2–22.1 |
| 45–54 |
23 |
27.8 |
17.6–41.7 |
18 |
21.7 |
12.9–34.4 |
3 |
3.6 |
0.7–10.6 |
14 |
16.9 |
9.2–28.4 |
| 55–64 |
60 |
60.9 |
46.5–
78.4 |
56 |
56.8 |
42.9–
73.8 |
27 |
27.4 |
18.1–
39.9 |
31 |
31.5 |
21.4–
44.7 |
| 65–74 |
78 |
109.2 |
86.3–
136.3 |
109 |
152.6 |
125.3–
184.1 |
70 |
98.0 |
76.4–
123.8 |
64 |
89.6 |
69.0–
114.4 |
| 75–84 |
80 |
179.2 |
142.1–
223.0 |
141 |
315.9 |
265.9–
372.5 |
104 |
233.0 |
190.4–
282.3 |
47 |
105.3 |
77.4–
140.0 |
| ≥85 |
26 |
232.0 |
151.5–
339.9 |
43 |
383.7 |
277.7–
516.8 |
61 |
544.3 |
416.3–
699.1 |
17 |
151.7 |
88.4–
242.9 |
| Total |
276 |
40.0 |
35.4–45.0 |
375 |
54.4 |
49.0–60.1 |
265 |
38.4 |
33.9–43.3 |
189 |
27.4 |
23.6–31.6 |
| Age-adjusted rate* |
| ESP2013 |
|
42.2 |
27.3–63.8 |
|
57.4 |
40.4–82.3 |
|
43.0 |
29.5–62.0 |
|
28.5 |
16.4–48.0 |
| JP2010 |
|
42.8 |
28.2–63.7 |
|
58.3 |
41.6–82.3 |
|
41.0 |
28.4–58.6 |
|
29.3 |
17.3–48.1 |
| WHO2000 |
|
20.7 |
13.1–32.3 |
|
26.0 |
17.6–40.0 |
|
16.4 |
11.1–24.4 |
|
14.7 |
8.1–26.1 |
| Women |
| 0–34 |
0 |
– |
– |
1 |
0.4 |
0.0–2.2 |
0 |
– |
– |
1 |
0.4 |
0.0–2.2 |
| 35–44 |
2 |
1.9 |
0.2–7.0 |
3 |
2.9 |
0.6–8.5 |
1 |
1.0 |
0.0–5.4 |
2 |
1.9 |
0.2–7.0 |
| 45–54 |
4 |
4.8 |
1.3–12.2 |
6 |
7.1 |
2.6–15.6 |
4 |
4.8 |
1.3–12.2 |
4 |
4.8 |
1.3–12.2 |
| 55–64 |
19 |
19.0 |
11.4–29.6 |
25 |
25.0 |
16.2–36.9 |
8 |
8.0 |
3.5–15.8 |
16 |
16.0 |
9.1–26.0 |
| 65–74 |
36 |
47.6 |
33.3–
65.8 |
36 |
47.6 |
33.3–
65.8 |
27 |
35.7 |
23.5–
51.9 |
32 |
42.3 |
28.9–
59.7 |
| 75–84 |
75 |
126.8 |
99.8–
159.0 |
69 |
116.7 |
90.8–
147.7 |
87 |
147.1 |
117.8–
181.5 |
46 |
77.8 |
57.0–
103.8 |
| ≥85 |
65 |
216.5 |
167.1–
276 |
103 |
343.1 |
280.1–
416.1 |
135 |
449.7 |
377.1–
532.3 |
36 |
119.9 |
84.0–
166.0 |
| Total |
201 |
28.3 |
24.5–32.5 |
243 |
34.2 |
30.0–38.8 |
262 |
36.9 |
32.5–41.6 |
137 |
19.3 |
16.2–22.8 |
| Age-adjusted rate* |
| ESP2013 |
|
21.8 |
13.8–34.6 |
|
25.4 |
16.5–40.5 |
|
25.8 |
18.1–39.1 |
|
15.4 |
8.5–27.7 |
| JP2010 |
|
30.1 |
19.4–46.0 |
|
35.9 |
23.7–54.1 |
|
38.4 |
27.1–54.9 |
|
20.6 |
11.6–35.3 |
| WHO2000 |
|
9.0 |
5.3–15.5 |
|
10.6 |
6.2–18.9 |
|
9.1 |
5.8–15.4 |
|
7.0 |
3.5–14.2 |
| Men and women |
| Total |
477 |
34.1 |
31.1–37.3 |
618 |
44.1 |
40.7–47.7 |
527 |
37.6 |
34.5–41.0 |
326 |
23.3 |
20.8–25.9 |
| Age- and sex-adjusted rate* |
| ESP2013 |
|
31.3 |
22.9–42.7 |
|
40.2 |
30.8–53.4 |
|
33.3 |
26.0–43.8 |
|
21.5 |
14.4–32.2 |
| JP2010 |
|
36.4 |
26.8–49.1 |
|
47.2 |
36.3–61.6 |
|
39.9 |
30.9–51.5 |
|
24.9 |
16.9–36.5 |
| WHO2000 |
|
14.7 |
10.3–20.9 |
|
17.9 |
13.0–25.4 |
|
12.4 |
9.2–17.1 |
|
10.7 |
6.8–17.5 |
*Standardized for age to the 2013 European Standard Population (ESP2013), the 2010 Japanese Population (JP2010) and the 2000 World Standard Population (WHO2000) using direct method. Abbreviations as in Table 2.
Table 4.
Estimated Number of Strokes (First-Ever and Recurrent or First-Ever Stroke) and Its Subtypes in 2011 in Japan
Age and
sex |
Japanese
population*
(thousands) |
Estimate no. of strokes (first-ever and recurrent) |
Estimate no. of strokes (first-ever) |
Total
stroke
(n) |
Ischemic
stroke
(n) |
Intracerebral
hemorrhage
(n) |
Subarachnoid
hemorrhage
(n) |
Total
stroke
(n) |
Ischemic
stroke
(n) |
Intracerebral
hemorrhage
(n) |
Subarachnoid
hemorrhage
(n) |
| Men |
| 0–34 |
22,705 |
1,295 |
505 |
267 |
522 |
1,205 |
505 |
177 |
522 |
| 35–44 |
9,631 |
4,557 |
2,462 |
1,461 |
545 |
4,282 |
2,188 |
1,461 |
545 |
| 45–54 |
7,823 |
9,455 |
5,484 |
2,838 |
1,133 |
8,321 |
5,106 |
2,176 |
1,039 |
| 55–64 |
9,347 |
29,210 |
16,499 |
10,338 |
1,898 |
23,237 |
13,276 |
7,777 |
1,898 |
| 65–74 |
7,092 |
41,719 |
32,064 |
8,563 |
996 |
30,508 |
23,563 |
5,956 |
893 |
| 75–84 |
4,441 |
49,903 |
36,877 |
11,137 |
1,104 |
31,662 |
22,906 |
7,167 |
900 |
| ≥85 |
1,145 |
18,967 |
15,063 |
3,597 |
– |
12,223 |
9,442 |
2,579 |
– |
| Total |
62,184 |
155,106 |
108,954 |
38,200 |
6,199 |
111,439 |
76,986 |
27,294 |
5,798 |
| |
95% CI |
130,761–
184,451 |
89,291–
133,394 |
26,839–
53,814 |
2,294–
14,149 |
90,655–
137,225 |
60,329–
98,421 |
17,813–
40,732 |
2,051–
13,601 |
| Women |
| 0–34 |
21,759 |
848 |
169 |
509 |
170 |
763 |
169 |
509 |
85 |
| 35–44 |
9,394 |
2,196 |
738 |
630 |
827 |
2,010 |
646 |
538 |
827 |
| 45–54 |
7,782 |
5,470 |
1,670 |
2,038 |
1,762 |
5,099 |
1,484 |
1,945 |
1,670 |
| 55–64 |
9,606 |
13,657 |
6,540 |
4,234 |
2,883 |
11,440 |
5,095 |
3,558 |
2,788 |
| 65–74 |
7,952 |
24,434 |
13,924 |
6,479 |
3,929 |
19,610 |
11,447 |
4,569 |
3,493 |
| 75–84 |
6,194 |
46,934 |
28,840 |
13,282 |
4,186 |
33,959 |
20,998 |
9,208 |
3,233 |
| ≥85 |
2,926 |
44,949 |
32,937 |
9,069 |
2,351 |
31,286 |
22,023 |
6,809 |
1,864 |
| Total |
65,613 |
138,488 |
84,819 |
36,241 |
16,108 |
104,168 |
61,861 |
27,134 |
13,959 |
| |
95% CI |
116,094–
165,855 |
68,712–
104,887 |
25,197–
52,715 |
8,930–
27,291 |
84,557–
128,862 |
48,043–
79,738 |
17,573–
42,165 |
7,378–
24,578 |
| Men and women |
| Total |
127,797 |
293,593 |
193,773 |
74,441 |
22,307 |
215,606 |
138,847 |
54,428 |
19,757 |
| |
95% CI |
260,392–
334,179 |
168,259–
226,258 |
57,816–
96,590 |
13,217–
35,970 |
186,519–
251,215 |
116,746–
167,111 |
40,146–
74,148 |
11,308–
32,851 |
*2011 Japanese population from the 2011 vital statistics data; The age- and sex-stratified Japanese population was based on 2011 vital statistics data. CI, confidence interval.
Table 5
shows the current management of stroke. Among patients with ischemic stroke, 1,739 (89.3%) underwent MRI and 1,934 (99.3%) underwent CT, MRI, or conventional angiography. A total of 741 (98.7%) patients with intracerebral hemorrhage and 219 (96.9%) with subarachnoid hemorrhage underwent CT scanning. Among patients with ischemic stroke, 78 (4.0%) received an intravenous recombinant tissue plasminogen activator, and 82 (10.9%) patients with intracerebral hemorrhage underwent a neurosurgical procedure (craniotomy without cerebral shunt). A total of 1,291 (43.7%) patients received neuroprotective agents (edaravone) and 717 (24.3%) received treatment for raised intracranial pressure (glyceol or mannitol). Intravenous antihypertensive agents were administered to 392 (52.2%) patients with intracerebral hemorrhage and 104 (46.0%) with subarachnoid hemorrhage. For the 2,158 (73.0%) stroke patients who received rehabilitation therapy, the median duration from stroke onset to initiation of rehabilitation therapy was 3 days. Only 1,225 (41.4%) patients received antihypertensive medication at discharge (Table 5).
Table 5.
Management of Stroke in Shiga Stroke Registry, Shiga, Japan, 2011
| |
Total
stroke
(n=2,956) |
Ischemic stroke |
Intracerebral
hemorrhage
(n=751) |
Subarachnoid
hemorrhage
(n=226) |
Total
(n=1,948) |
Lacunar
infarction
(n=477) |
Large-artery
infarction
(n=618) |
Cardioembolic
infarction
(n=527) |
Other/
undetermined
(n=326) |
| Neuroimaging |
| Brain CT |
2,707
(91.6) |
1,746
(89.6) |
401 (84.1) |
561 (90.8) |
494 (93.7) |
290 (89.0) |
741 (98.7) |
219 (96.9) |
| CT angiography |
434 (14.7) |
195 (10.0) |
33 (6.9) |
83 (13.4) |
41 (7.8) |
38 (11.7) |
102 (13.6) |
137 (60.6) |
| Brain MRI |
2,147
(72.6) |
1,739
(89.3) |
451 (94.5) |
586 (94.8) |
440 (83.5) |
262 (80.4) |
307 (40.9) |
100 (44.2) |
| MR angiography |
1,952
(66.0) |
1,602
(82.2) |
405 (84.9) |
554 (89.6) |
401 (76.1) |
242 (74.2) |
255 (34.0) |
94 (41.6) |
| Conventional angiography |
263 (8.9) |
107 (5.5) |
14 (2.9) |
63 (10.2) |
15 (2.8) |
15 (4.6) |
47 (6.3) |
109 (48.2) |
| Treatment in acute phase |
| Endovascular treatment |
63 (2.1) |
18 (0.9) |
1 (0.2) |
12 (1.9) |
4 (0.8) |
1 (0.3) |
0 (0.0) |
45 (19.9) |
Other neurosurgical
procedures* |
222 (7.5) |
24 (1.2) |
0 (0.0) |
11 (1.8) |
11 (2.1) |
2 (0.6) |
82 (10.9) |
116 (51.3) |
| Intravenous treatment |
Recombinant tissue
plasminogen activator |
– |
– |
78 (4.0) |
3 (0.6) |
27 (4.4) |
41 (7.8) |
7 (2.1) |
– |
Neuroprotective agent
(edaravone) |
1,291
(43.7) |
1,248
(64.1) |
303 (63.5) |
410 (66.3) |
341 (64.7) |
194 (59.5) |
1 (0.1) |
41 (18.1) |
Drugs for raised
intracranial pressure** |
717 (24.3) |
357 (18.3) |
31 (6.5) |
99 (16.0) |
168 (31.9) |
59 (18.1) |
279 (37.2) |
81 (35.8) |
| BP-lowering agent |
588 (19.9) |
92 (4.7) |
12 (2.5) |
30 (4.9) |
37 (7.0) |
13 (4.0) |
392 (52.2) |
104 (46.0) |
| Rehabilitation therapy |
2,158
(73.0) |
1,490
(76.5) |
379 (79.5) |
480 (77.7) |
390 (74.0) |
241 (73.9) |
548 (73.0) |
117 (51.8) |
| Physical therapy |
2,027
(68.6) |
1,383
(71.0) |
351 (73.6) |
445 (72.0) |
359 (68.1) |
228 (69.9) |
528 (70.3) |
113 (50.0) |
| Occupational therapy |
1,630
(55.1) |
1,112
(57.1) |
288 (60.4) |
358 (57.9) |
277 (52.6) |
189 (58.0) |
429 (57.1) |
86 (38.1) |
| Speech therapy |
1,222
(41.3) |
834 (42.8) |
193 (40.5) |
281 (45.5) |
231 (43.8) |
129 (39.6) |
321 (42.7) |
64 (28.3) |
Days from onset to
rehabilitation therapy |
3
(2–6) |
3
(2–6) |
3
(2–5) |
4
(2–6) |
3
(2–6) |
4
(2–6) |
3
(1–5) |
7
(3–14) |
Length of hospital stay
(days) |
24
(11–47) |
23
(12–45) |
18
(10–35) |
25
(13–46) |
28
(13–51) |
21
(12–45) |
28
(10–50) |
28
(6–58) |
| Treatment at discharge |
| Antiplatelet agent |
1,321
(44.7) |
1,266
(65.0) |
425 (89.1) |
482 (78.0) |
133 (25.2) |
226 (69.3) |
26 (3.5) |
28 (12.4) |
| Anticoagulant agent |
427 (14.4) |
395 (20.3) |
19 (4.0) |
48 (7.8) |
292 (55.4) |
36 (11.0) |
30 (4.0) |
2 (0.9) |
| BP-lowering agent |
1,225
(41.4) |
767 (39.4) |
212 (44.4) |
249 (40.3) |
188 (35.7) |
118 (36.2) |
407 (54.2) |
50 (22.1) |
Values are median (interquartile range) or number (%). *Other neurosurgical procedures includes all neurosurgical procedures except for endovascular treatment and cerebral shunt. **Glycerol and/or mannitol. BP, blood pressure; CT, computed tomography; MRI, magnetic resonance imaging.
Table 6
shows the functional outcomes at discharge and mortality within 28 days. A total of 1,846 (62.8%) stroke patients had died (mRS score 6) or were dependent (mRS score 3–5) at hospital discharge. Furthermore, 390 (13.2%) patients died within 28 days of stroke onset.
Table 6.
Short-Term Prognosis of Stroke and Its Subtypes in Shiga Stroke Registry, Shiga, Japan, 2011
| |
Total
stroke,
n (%) |
Ischemic stroke |
Intracerebral
hemorrhag,
n (%) |
Subarachnoid
hemorrhage,
n (%) |
Total,
n (%) |
Lacunar
infarction,
n (%) |
Large-artery
infarction,
n (%) |
Cardioembolic
infarction,
n (%) |
Other/
undetermined,
n (%) |
| First-ever and recurrent stroke |
| mRS at hospital discharge |
| 0 |
209 (8.6) |
167 (8.6) |
58 (12.3) |
52 (8.5) |
23 (4.4) |
34 (10.5) |
19 (2.5) |
23 (10.2) |
| 1 |
539 (18.3) |
411 (21.2) |
142 (30.1) |
113 (18.4) |
77 (14.7) |
79 (24.3) |
96 (12.8) |
31 (13.7) |
| 2 |
347 (11.8) |
261 (13.5) |
64 (13.6) |
95 (15.4) |
41 (7.8) |
61 (18.8) |
72 (9.6) |
14 (6.2) |
| 3 |
305 (10.4) |
230 (11.9) |
62 (13.1) |
76 (12.4) |
66 (12.6) |
26 (8.0) |
61 (8.2) |
14 (6.2) |
| 4 |
652 (22.2) |
416 (21.5) |
96 (20.3) |
158 (25.7) |
106 (20.2) |
56 (17.2) |
206 (27.5) |
30 (13.3) |
| 5 |
404 (13.7) |
239 (12.3) |
39 (8.3) |
72 (11.7) |
106 (20.2) |
22 (6.8) |
133 (17.8) |
32 (14.2) |
| 6 |
485 (16.5) |
212 (11.0) |
11 (2.3) |
49 (8.0) |
105 (20.0) |
47 (14.5) |
161 (21.5) |
82 (36.3) |
| Unknown |
15 (–) |
12 (–) |
5 (–) |
3 (–) |
3 (–) |
1 (–) |
3 (–) |
0 (–) |
| Death within 28 days |
390 (13.2) |
151 (7.8) |
6 (1.3) |
35 (5.7) |
77 (14.6) |
33 (10.1) |
145 (19.3) |
70 (31.0) |
| First-ever stroke |
| mRS at hospital discharge |
| 0 |
187 (8.6) |
150 (10.8) |
52 (15.0) |
45 (10.3) |
21 (6.0) |
32 (12.7) |
17 (3.1) |
20 (10.0) |
| 1 |
444 (20.5) |
335 (24.2) |
119 (34.3) |
89 (20.4) |
61 (17.3) |
66 (26.2) |
78 (14.2) |
30 (14.9) |
| 2 |
269 (12.4) |
194 (14.0) |
49 (14.1) |
72 (16.5) |
27 (7.7) |
46 (18.3) |
62 (11.3) |
13 (6.5) |
| 3 |
203 (9.4) |
146 (10.5) |
40 (11.5) |
50 (11.5) |
39 (11.1) |
17 (6.7) |
46 (8.4) |
11 (5.5) |
| 4 |
449 (20.8) |
269 (19.4) |
58 (16.7) |
97 (22.2) |
71 (20.2) |
43 (17.1) |
152 (27.7) |
28 (13.9) |
| 5 |
262 (12.1) |
155 (11.2) |
20 (5.8) |
47 (10.8) |
71 (20.2) |
17 (6.7) |
78 (14.2) |
29 (14.4) |
| 6 |
349 (16.1) |
138 (9.9) |
9 (2.6) |
36 (8.3) |
62 (17.6) |
31 (12.3) |
116 (21.1) |
70 (34.8) |
| Unknown |
13 (–) |
11 (–) |
5 (–) |
3 (–) |
2 (–) |
1 (–) |
2 (–) |
0 (–) |
| Death within 28 days |
281 (12.9) |
97 (6.9) |
5 (1.4) |
25 (5.7) |
47 (13.3) |
20 (7.9) |
104 (18.9) |
61 (30.3) |
mRS, modified rank scale.5
Discussion
The present study using a large-scale, comprehensive, population-based stroke registry demonstrated the current status in incidence rates, management, and prognosis of stroke in a Japanese real-world setting. We also estimated the total number of stroke onsets. Age- and sex-standardized incidence rates of first-ever stroke and that of overall stroke were 142.9 and 192.8 per 100,000 person-years, respectively. In 2011 the estimated annual number of new strokes in Japan was 220,000. Although most patients underwent a neuroimaging examination, the frequency of patients who received intravenous thrombolysis was still low among those with ischemic stroke (4%). Furthermore, more than half of the stroke patients died or became dependent after stroke.
Several population-based stroke registries have been conducted in Japan. The Takashima Stroke Registry,11,12
located in Takashima City in the northwestern part of Shiga Prefecture, reported that incidence rates of first-ever stroke standardized for age using the 2000 Japanese population were 152 per 100,000 person-years in men and 97 in women12
during the study period from 1999 to 2001 (125 in men and 79 in women as age-standardized by WHO 2000). Another population-based stroke registry conducted in Akita Prefecture reported that incidence rates of first-ever stroke standardized for age using the 1976 European Standard Population13
were 176 per 100,000 person-years in men and 107 in women during the study period 1995–2004.14
Compared with those previous studies conducted in the 1990 s and early 2000 s, the present analysis of the SSR demonstrated lower incidence rates (≈70% of previous studies). Likewise, the present analysis demonstrated lower incidence rates of ischemic stroke and intracerebral hemorrhage than in the previous studies. These findings are consistent with those of the Global Burden of Disease, Injuries, and Risk Factors Study (GBD2010), which demonstrated a slight reduction in age-standardized rates of stroke in high-income countries from 1990 to 2010.15
To our knowledge, our study is the first to report the incidence rate in the 2010 s in Japan based on a large-scale, comprehensive, population-based registry. We therefore considered it appropriate to estimate the number of stroke onsets in Japan using the incidence rates in the present study. A previous study from Japan estimated that approximately 154,000 new strokes occurred in 2000.12
The estimated absolute number of stroke onsets in Japan appears to show a 1.4-fold increase from 2000 to 2011. Although the age-standardized incidence rate of stroke in Japan has been decreasing during the past few decades, absolute number of new strokes might be increasing because of the rapid aging of the Japanese society.
Incidence rates of lacunar infarction and intracerebral hemorrhage, which are strongly associated with small vessel disease,16,17
have been shown to be higher in Asian than in Western populations.18,19
On the other hand, incidence rates of large-artery infarction and cardioembolic infarction have been shown to be lower in Asian individuals than in their Western counterparts. Compared with previous studies conducted during the 1990 s in Japan,20
however, the present study conducted in 2011 demonstrated a lower incidence of lacunar infarction and a higher incidence of large-artery infarction. The rapid aging of the Japanese population and the change from traditional to Western lifestyle21
might be an influential factor in the changing incidence rates of ischemic stroke subtypes, particularly the increase in large-artery infarctions.
In previous population-based studies from Europe, case-fatality rates at 30 days have been reported to be 20.6–21.6% for total stroke22,23
and 31.6% for intracerebral hemorrhage.22
In several recent hospital-based studies, the percentage of patients with death or dependency (mRS score 3 to 6) at discharge has been reported to be 43.4% in men and 49.6% in women for ischemic stroke in the USA,24
and 30.9% in men and 39.8% in women for total stroke in Korea.25
In a large-scale Japanese hospital-based registry, the frequency of death or dependency (mRS score 3–6) at discharge has been reported as 45.2% for large-artery infarction, 26.6% for lacunar infarction, 59.5% for cardioembolic infarction, and 67.4% for hypertensive intracerebral hemorrhage.26
Although the present results from the SSR demonstrated lower mortality rates and higher frequency of dependency than previous studies, the discrepancy may be attributable to differences in study design and characteristics of the patients.
Study Limitations
Although, to our knowledge, this is the first study to report the current status of incidence rate, management, and short-term outcome of stroke based on a large-scale, comprehensive, population-based registry in Japan, it does have several limitations. First, because of the retrospective nature of registration, there may have been a slight variation in clinical scores, such as mRS, reported by investigators. Furthermore, requisite information was not available from the medical records of some patients. Another limitation is that we had no information on some patients with minor stroke who visited small clinics only or those who did not visit a doctor, which may have led us to underestimate the incidence rates of stroke. We also had no information on stroke patients who were admitted to hospitals outside of Shiga Prefecture, although an underestimation of stroke incidence due to such bias seem to be somewhat limited because the rate of patients who were transported outside of the city using the public ambulance service in Otsu City, which is on the border to the Kyoto prefecture, has been reported to be much lower than that in other regions in Japan.27
Finally, the cause of death might have not been investigated for patients with sudden death or cardiopulmonary arrest on hospital arrival, which may have led to inaccurate diagnosis of stroke among cases with death certificate only.
Conclusions
In the present Japanese population-based stroke registry in a real-world setting, incidence rates of stroke by subtype were clarified and the total number of new strokes in Japan was estimated. More than half of stroke patients in Japan die or become dependent after stroke. This study re-emphasizes the importance of public health measures to reduce the burden of stroke in Japan and other high-income countries facing the rapid aging of society.
Acknowledgments
We thank all investigators, participating hospitals, study staff at the Shiga Stroke Data Center, Shiga Medical Association, Shiga Prefecture Hospital Association, Biwako Brain Attack Consortium (BIWA-BAC), and the Department of Health Care and Welfare, Shiga Prefecture government.
Conflict of Interest
None declared.
Grants
SSR is supported by Shiga Prefecture, Japan. This study was supported by Japan Agency for Medical Research and Development (AMED).
Appendix
Members of the Shiga Stroke Data Center
Management Committee
Yoshitaka Matsusue (Chair), Kiyoshi Murata (Vice Chair), Kazuhiko Nozaki (Principal Investigator), Katsuyuki Miura, Yoshikuni Kita, Naoyuki Takashima, Masaru Komori, Satoru Nagata, Yoshihisa Sugimoto, Naomi Miyamatsu.
Supplementary Files
Supplementary File 1
Steering Committee of Biwako Brain Attack Consortium (BIWA-BAC) and the Participating Hospitals
Table S1.
IR of stroke (first-ever, recurrent and death certificate only) and its subtypes (per 100,000 person-years) in Shiga Stroke Registry, Shiga, Japan, 2011
Please find supplementary file(s);
http://dx.doi.org/10.1253/circj.CJ-17-0177
References
- 1.
Ueshima H. Explanation for the Japanese paradox: Prevention of increase in coronary heart disease and reduction in stroke. J Atheroscler Thromb 2007; 14: 278–286.
- 2.
Ministry of Health, Labour and Welfare. Results of Vital Statistics, 2014.
http://www.mhlw.go.jp/toukei/saikin/hw/jinkou/kakutei14/index.html (accessed February 12, 2016).
- 3.
Ministry of Health, Labour and Welfare. The results of Comprehensive Survey of Living Conditions, 2013. http://www.mhlw.go.jp/toukei/saikin/hw/k-tyosa/k-tyosa13/index.html (accessed February 12, 2016).
- 4.
Ohta T, Wage S, Handa H, Saito I, Takeuchi K, Suzuki J, et al. New grading of level of disordered consiousness. Neurol Surg 1974; 2: 623–627 (in Japanese).
- 5.
van Swieten JC, Koudstaal PJ, Visser MC, Schouten HJ, van Gijn J. Interobserver agreement for the assessment of handicap in stroke patients. Stroke 1988; 19: 604–607.
- 6.
Tunstall-Pedoe H. Monitoring trends in cardiovascular disease and risk factors: The WHO “Monica” project. WHO Chronicle 1985; 39: 3–5.
- 7.
Adams HP Jr, Bendixen BH, Kappelle LJ, Biller J, Love BB, Gordon DL, et al. Classification of subtype of acute ischemic stroke: Definitions for use in a multicenter clinical trial. TOAST [Trial of Org 10172 in Acute Stroke Treatment]. Stroke 1993; 24: 35–41.
- 8.
Pace M, Lanzieri G, Glickman M, Zupanič T. Revision of the European Standard Population: Report of Eurostat’s task force. Publications Office of the European Union, 2013.
- 9.
Statistics Bureau, Ministry of Internal Affairs and Communications, Japan. Population Census 2011.
http://www.stat.go.jp/english/data/kokusei/index.htm (accessed February 17, 2016).
- 10.
Ahmad O, Boschi-Pinto C, Lopez A, Murray C, Lozano R, Inoue M. Age standardization of rates: A new WHO standard. Vol 9. Geneva: World Health Organization, 2001.
- 11.
Kita Y, Turin TC, Rumana N, Sugihara H, Morita Y, Hirose K, et al. Surveillance and measuring trends of stroke in Japan: The Takashima Stroke Registry (1988–present). Int J Stroke 2007; 2: 129–132.
- 12.
Kita Y, Turin TC, Ichikawa M, Sugihara H, Morita Y, Tomioka N, et al. Trend of stroke incidence in a Japanese population: Takashima stroke registry, 1990–2001. Int J Stroke 2009; 4: 241–249.
- 13.
Waterhouse J, Muir C, Correa P, Powell J. Cancer incidence in five continents. Vol. III. International Agency for Research on Cancer. Lyon: IARC Scientific Publications, 1976; 15.
- 14.
Suzuki K, Izumi M. The incidence of hemorrhagic stroke in Japan is twice compared with western countries: The Akita stroke registry. Neurol Sci 2015; 36: 155–160.
- 15.
Feigin VL, Forouzanfar MH, Krishnamurthi R, Mensah GA, Connor M, Bennett DA, et al. Global and regional burden of stroke during 1990–2010: Findings from the Global Burden of Disease Study 2010. Lancet 2014; 383: 245–254.
- 16.
Pantoni L. Cerebral small vessel disease: From pathogenesis and clinical characteristics to therapeutic challenges. Lancet Neurol 2010; 9: 689–701.
- 17.
Sato S, Delcourt C, Heeley E, Arima H, Zhang S, Al-Shahi Salman R, et al. Significance of cerebral small-vessel disease in acute intracerebral hemorrhage. Stroke 2016; 47: 701–707.
- 18.
Kim BJ, Kim JS. Ischemic stroke subtype classification: An Asian viewpoint. J Stroke 2014; 16: 8–17.
- 19.
Ueshima H, Sekikawa A, Miura K, Turin TC, Takashima N, Kita Y, et al. Cardiovascular disease and risk factors in Asia: A selected review. Circulation 2008; 118: 2702–2709.
- 20.
Turin TC, Kita Y, Rumana N, Nakamura Y, Takashima N, Ichikawa M, et al. Ischemic stroke subtypes in a Japanese population: Takashima Stroke Registry, 1988–2004. Stroke 2010; 41: 1871–1876.
- 21.
Sekikawa A, Miyamoto Y, Miura K, Nishimura K, Willcox BJ, Masaki KH, et al. Continuous decline in mortality from coronary heart disease in Japan despite a continuous and marked rise in total cholesterol: Japanese experience after the Seven Countries Study. Int J Epidemiol 2015; 44: 1614–1624.
- 22.
Janes F, Gigli GL, D’Anna L, Cancelli I, Perelli A, Canal G, et al. Stroke incidence and 30-day and six-month case fatality rates in Udine, Italy: A population-based prospective study. Int J Stroke 2013; 8(Suppl A100): 100–105.
- 23.
Cabral NL, Muller M, Franco SC, Longo A, Moro C, Nagel V, et al. Three-year survival and recurrence after first-ever stroke: The Joinville stroke registry. BMC Neurol 2015; 15: 70.
- 24.
Boehme AK, Siegler JE, Mullen MT, Albright KC, Lyerly MJ, Monlezun DJ, et al. Racial and gender differences in stroke severity, outcomes, and treatment in patients with acute ischemic stroke. J Stroke Cerebrovasc Dis 2014; 23: e255–e261.
- 25.
Kim JS, Lee KB, Roh H, Ahn MY, Hwang HW. Gender differences in the functional recovery after acute stroke. J Clin Neurol 2010; 6: 183–188.
- 26.
Kobayashi S. Japanese Stroke Data Bank 2015. Tokyo: Nakayama Shoten; 2015.
- 27.
Shiga Prefecture. Results of Emergency service, 2014.
http://www.pref.shiga.lg.jp/c/shobo/shobohoan/bosainenpo/h24.html (accessed April 12, 2017) (in Japanese).
