Abstract
Background:
Both inflammation and malnutrition have been reported to be closely linked to atherosclerosis, especially in patients with chronic kidney disease (CKD). The combined effects of serum albumin and C-reactive protein (CRP) on clinical outcomes after percutaneous coronary intervention (PCI) were investigated.
Methods and Results:
A total of 2,164 all-comer patients with coronary artery disease who underwent their first PCI and had data available for preprocedural serum albumin and hs-CRP levels between 2000 and 2011 were studied. Patients were assigned to 4 groups according to their median serum albumin and CRP levels (4.1 g/dL and 0.10 mg/dL, respectively). The incidence of major adverse cardiac events (MACE), including all-cause death and non-fatal myocardial infarction (MI), was evaluated. During a median follow-up period of 7.5 years, 331 cases of MACE (15.3%), including 270 deaths and 61 non-fatal MIs, occurred. Kaplan-Meier curves showed that the rates of MACE differed significantly among the groups (log-rank P<0.0001), even stratified by with or without CKD (both log-rank P<0.0001). After adjustment for established cardiovascular risk factors, low serum albumin with high CRP levels was associated with adverse cardiac events (hazard ratio 2.55, 95% confidence interval 1.72–3,88, P<0.0001, high albumin/low CRP group as reference).
Conclusions:
The presence of both low serum albumin and high CRP levels conferred a synergistic adverse effect on the risk for long-term MACE in patients undergoing PCI.
Inflammation plays an important role in the progression and destabilization of atherosclerosis.1,2
The level of C-reactive protein (CRP), an acute-phase reactant and a marker of systemic inflammation, has been reported to be a predictor of cardiovascular events.3–5
The presence of low-grade inflammation has become detectable using high-sensitivity CRP (hs-CRP), and previous studies showed that elevation of preprocedural hs-CRP levels in patients with coronary artery disease (CAD) or undergoing percutaneous coronary intervention (PCI) was associated with adverse cardiac events.5–7
Editorial p 1268
Malnutrition has been reported to be closely linked with inflammation and atherosclerosis.8
The malnutrition, inflammation, and atherosclerosis (MIA) syndrome was thus considered to be an important issue, especially for patients with end-stage renal disease (ESRD).9
Serum albumin has generally been used as a quantitative measure of nutritional status and some studies showed that hs-CRP elevation with hypoalbuminemia was associated with higher rates of death and cardiac events in patients with chronic kidney disease (CKD).10,11
However, these synergic effects of hs-CRP and serum albumin levels on clinical outcomes in patients with CAD remain uncertain.
In the present study, therefore, the prognostic value of combined preprocedural serum albumin and hs-CRP levels for long-term clinical outcomes was evaluated in CAD patients undergoing PCI.
Methods
Study Population and Data Collection
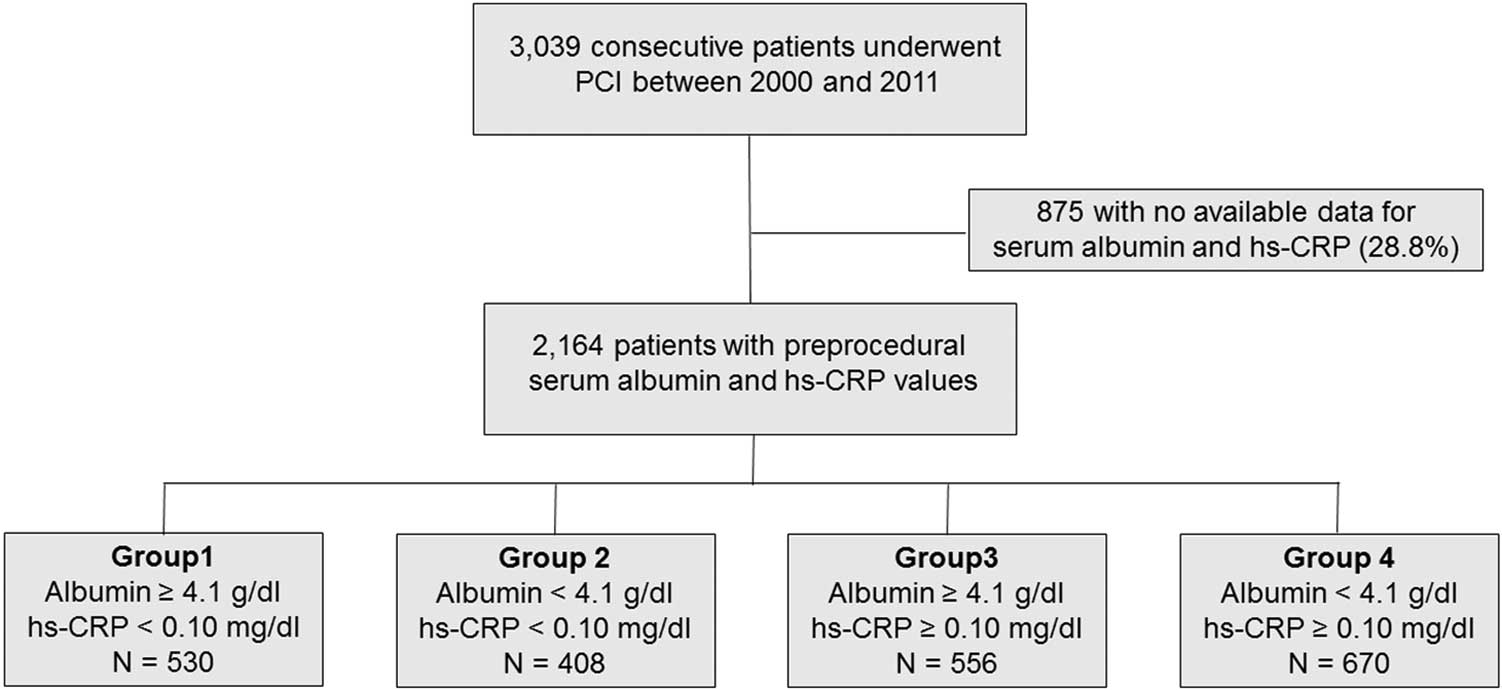
The present investigation was a single-center, observational, retrospective cohort study. Among consecutive patients with CAD who underwent their first PCI at Juntendo University Hospital between 2000 and 2011, only patients for whom preprocedural serum albumin and hs-CRP values were available were included. Patients with known malignancy and active inflammatory disease (hs-CRP >1.0 mg/dL) or without available preprocedural albumin and hs-CRP values were excluded. Median values of serum albumin (4.1 g/dL) and hs-CRP (0.10 mg/dL) were used as cutoff levels for allocating the patients to 4 groups: Group 1 included those with higher albumin and lower CRP levels; Group 4 included those with lower albumin and higher CRP levels; Groups 2 and 3 included patients with lower and higher levels of both components, respectively (Figure 1).
Demographic data, coronary risk factors, and medication use were collected from the institutional database. Blood samples were collected in the early morning after overnight fasting, and blood pressure (BP) was measured on admission. Patients with BP >140/90 mmHg or who were receiving antihypertensive drugs were regarded as hypertensive. Dyslipidemia was defined as low-density lipoprotein cholesterol (LDL-C) ≥140 mg/dL, high-density lipoprotein-cholesterol (HDL-C) ≤40 mg/dL, triglycerides (TG) ≥150 mg/dL, or current treatment with statins and/or other lipid-lowering agents.12
Diabetes mellitus was defined as either hemoglobin A1c (HbA1c) of 6.5% or medication with insulin or oral hypoglycemic drugs. The estimated HbA1c (%) was calculated as National Glycohemoglobin Standardization Program equivalent values (%) using the formula HbA1c (%)=1.02×HbA1c (JDS; %)+0.25%.13
CKD was defined as an estimated glomerular filtration rate (eGFR) <60 mL/min/1.73 m2
calculated using the Modification of the Diet in Renal Disease equation modified with a Japanese coefficient using baseline serum creatinine.14
Levels of serum hs-CRP were measured using a validated immunoassay and an auto-analyzer. Other markers were determined by routine laboratory methods.
Written informed consent was given by all patients prior to PCI. This study was performed in accordance with the Declaration of Helsinki and with approval from the institutional review board.
Primary Endpoints
The primary outcome was major adverse cardiac events (MACE), defined as a composite of all-cause death and non-fatal myocardial infarction (MI). Clinical follow-up included a review of medical charts, telephone contact, and questionnaires sent to patients or their families. Mortality data were collected from the medical records of patients who died or who were treated at the institution, and the details and causes of death were obtained from other hospitals to which patients had been admitted. MI was defined as evidence of myocardial necrosis in a clinical setting consistent with myocardial ischemia.
Statistical Analysis
Quantitative data are presented as mean±standard deviation (SD) or median (interquartile range, IQR). Categorical variables are presented as frequencies. Continuous variables across groups were compared using one-way analysis of variance or the Kruskal-Wallis test. Categorical variables (presented as frequencies) were compared using the chi-squared test. Unadjusted cumulative event rates were estimated using Kaplan-Meier curves and compared across groups; patients were also stratified by the presence or absence of CKD in the Kaplan-Meier analysis. Cox proportional hazards models were used to assess univariate and multivariable covariates. Hazard ratios (HRs) and confidence intervals (CIs) were calculated for each factor by Cox proportional hazards analysis. Adjusted variables were acute coronary syndrome (ACS), age, body mass index (BMI), CKD, current smoker, diabetes, hypertension, left ventricular ejection fraction (LVEF), multivessel coronary disease and statin use on admission. Among these, only the variables showing P<0.05 on the univariate analyses were included in multivariate analyses. To assess whether internal correlation between serum albumin or hs-CRP levels and cardiac events was affected by any other covariates, we conducted a Cox proportional hazard regression with an interaction term between serum albumin and hs-CRP, and between serum albumin or hs-CRP and other covariates. To assess whether the accuracy of predicting adverse cardiac events would improve after adding serum albumin and hs-CRP levels to a baseline model with established risk factors (ACS, age, BMI, CKD, LVEF, multivessel disease, and use of statins), the C-index, net reclassification improvement (NRI), and integrated discrimination improvement (IDI) were calculated. The C-index is defined as the area under the receiver-operating characteristic curves between individual predictive probabilities for events and the incidence of events, and it was compared for the baseline model and enriched models containing the established risk factors plus serum albumin and hs-CRP levels, either alone or both. The NRI indicates relatively how many patients improved their predicted probability for events, and the IDI represents the average improvement in predicted probability for events after adding variables to the baseline model. Differences were considered significant at P<0.05. Statistical analyses were carried out using JMP version 12.0 (SAS Institute, Cary, NC, USA) and R version 3.2.3 (http://www.R-project.org/; R Foundation for Statistical Computing, Vienna, Austria).
Results
Baseline and Procedural Characteristics
Of the 3,039 patients who underwent PCI, preprocedural serum albumin and hs-CRP data were available for 2,164 (71.2%). For these patients, the mean and median serum albumin values were 4.0±0.4 and 4.1 (IQR, 3.8–4.3) g/dL, respectively, and the median hs-CRP value was 0.11 (IQR, 0.05–0.25) mg/dL. Clinical and procedural characteristics of the patients are shown in
Table 1. Patients in the low albumin/high CRP group were likely to be older and have higher prevalences of CKD, ACS, and hypertension, as well as lower HDL-C values on admission. Patients in this group were also less likely to be taking statins and had lower LVEF.
Table 1.
Clinical, Angiographic, and Procedural Characteristics of Patients Undergoing 1st PCI
| |
Overall
(n=2,164) |
Group 1 |
Group 2 |
Group 3 |
Group 4 |
P value |
Albumin ≥4.1 g/dL
CRP <0.10 mg/dL
(n=530) |
Albumin <4.1 g/dL
CRP <0.10 mg/dL
(n=408) |
Albumin ≥4.1 g/dL
CRP ≥0.10 mg/dL
(n=556) |
Albumin <4.1 g/dL
CRP ≥0.10 mg/dL
(n=670) |
| Albumin, g/dL |
4.0±0.4 |
4.4±0.2 |
3.7±0.3 |
4.4±0.2 |
3.6±0.3 |
<0.0001 |
| hs-CRP, mg/dL |
0.11 [0.05, 0.25] |
0.04 [0.02, 0.06] |
0.04 [0.03, 0.07] |
0.20 [0.13, 0.35] |
0.24 [0.15, 0.44] |
<0.0001 |
| Baseline characteristics |
| Age, years |
65.6±10.0 |
63.8±9.6 |
68.1±8.7 |
62.8±9.5 |
67.9±10.4 |
<0.0001 |
| Male, n (%) |
1,789 (82.7) |
442 (83.4) |
334 (81.9) |
482 (86.7) |
531 (79.3) |
0.006 |
| Hypertension, n (%) |
1,557 (72.0) |
373 (70.4) |
291 (71.3) |
392 (70.5) |
501 (74.8) |
0.26 |
| Diabetes, n (%) |
991 (45.8) |
225 (42.5) |
201 (49.3) |
245 (44.1) |
320 (47.8) |
0.11 |
| Dyslipidemia, n (%) |
1,567 (72.5) |
410 (77.4) |
275 (67.4) |
437 (78.6) |
445 (66.6) |
<0.0001 |
| Current smoker, n (%) |
573 (26.5) |
119 (22.5) |
98 (24.0) |
190 (34.2) |
166 (24.8) |
<0.0001 |
| Family history, n (%) |
612 (28.4) |
162 (30.7) |
112 (27.5) |
156 (28.2) |
182 (27.3) |
0.57 |
| ACS presentation, n (%) |
548 (25.3) |
68 (12.8) |
79 (19.4) |
149 (26.8) |
252 (37.6) |
<0.0001 |
| Multivessel, n (%) |
1,227 (56.7) |
292 (55.1) |
241 (59.1) |
299 (53.8) |
395 (59.0) |
0.19 |
| BMI, kg/m2 |
24.3±3.3 |
24.3±3.0 |
23.8±3.2 |
24.9±3.1 |
24.0±3.8 |
<0.0001 |
| SBP, mmHg |
133.9±22.6 |
133.4±22.0 |
135.3±24.1 |
133.2±21.2 |
134.0±23.2 |
0.51 |
| DBP, mmHg |
72.4±13.1 |
72.8±12.4 |
72.2±13.5 |
73.0±13.1 |
71.8±13.7 |
0.40 |
| TC, mg/dL |
184.9±38.2 |
184.0±36.8 |
177.2±33.3 |
196.5±39.9 |
180.8±38.6 |
<0.0001 |
| LDL-C, mg/dL |
112.1±32.8 |
108.5±31.8 |
106.4±28.5 |
120.7±35.7 |
111.3±32.3 |
<0.0001 |
| HDL-C, mg/dL |
45.1±13.3 |
47.2±14.6 |
45.2±12.6 |
44.6±12.3 |
43.9±13.2 |
0.0002 |
| TG, mg/dL |
137.6±92.0 |
142.3±96.0 |
124.7±65.6 |
156.4±89.3 |
126.2±101.0 |
<0.0001 |
| FBG, mg/dL |
113.2±39.4 |
110.5±34.1 |
108.2±32.0 |
113.5±40.6 |
118.1±45.4 |
0.0002 |
| HbA1c, % |
6.4±1.3 |
6.3±1.3 |
6.4±1.3 |
6.4±1.3 |
6.4±1.2 |
0.82 |
| eGFR, mL/min/1.73 m2 |
68.5±22.5 |
72.8±17.1 |
66.8±24.1 |
70.8±20.4 |
64.1±25.8 |
<0.0001 |
| CKD, n (%) |
640 (29.6) |
93 (17.6) |
137 (33.6) |
152 (27.3) |
258 (38.5) |
<0.0001 |
| HD, n (%) |
110 (5.1) |
9 (1.7) |
27 (6.6) |
16 (2.9) |
58 (8.7) |
<0.0001 |
| Medications |
| Aspirin, n (%) |
2,027 (94.9) |
499 (95.2) |
387 (96.3) |
523 (95.1) |
618 (93.5) |
0.23 |
| ACEI/ARB, n (%) |
1,112 (52.0) |
251 (47.9) |
216 (53.7) |
266 (48.4) |
379 (57.3) |
0.002 |
| β-blocker, n (%) |
1,072 (50.2) |
254 (48.5) |
203 (50.5) |
279 (50.7) |
336 (50.8) |
0.85 |
| OHA, n (%) |
616 (28.9) |
152 (29.0) |
131 (32.6) |
142 (25.9) |
191 (28.9) |
0.16 |
| Insulin, n (%) |
235 (10.9) |
38 (7.2) |
75 (18.4) |
36 (6.5) |
86 (12.8) |
<0.0001 |
| Statin, n (%) |
1,273 (59.6) |
342 (65.5) |
237 (59.0) |
356 (64.7) |
337 (51.1) |
<0.0001 |
| Angiographic profile |
| LAD culprit lesion, n (%) |
1,008 (46.6) |
250 (47.2) |
193 (47.3) |
266 (47.8) |
299 (44.6) |
0.67 |
| Reference lumen diameter, mm |
2.8 [2.5, 3.2] |
2.7 [2.5, 3.1] |
2.8 [2.5, 3.1] |
2.9 [2.6, 3.3] |
2.9 [2.6, 3.2] |
<0.0001 |
| Stent size, mm |
3.0 [2.75, 3.5] |
3.0 [2.5, 3.0] |
3.0 [2.75, 3.0] |
3.0 [2.75, 3.5] |
3.0 [2.75, 3.5] |
<0.0001 |
| LVEF, % |
62.2±11.9 |
64.0±10.0 |
62.9±10.4 |
63.7±11.2 |
59.0±13.9 |
<0.0001 |
ACEI, angiotensin-converting enzyme inhibitor; ACS, acute coronary syndrome; ARB, angiotensin-receptor blocker; BMI, body mass index; CKD, chronic kidney disease; DBP, diastolic blood pressure; eGFR, estimated glomerular filtration rate; FBG, fasting blood glucose; HbA1c, hemoglobin A1c; HD, hemodialysis; HDL-C, high-density lipoprotein-cholesterol; hs-CRP, high-sensitivity C-reactive protein; LAD, left anterior descending artery; LDL-C, low-density lipoprotein-cholesterol; LVEF, left ventricular ejection fraction; MLD, minimal lumen diameter; OHA, oral hypoglycemic agent; PCI, percutaneous coronary intervention; SBP, systolic blood pressure; TC, total cholesterol; TG, triglycerides.
The median follow-up period was 7.5 years (IQR, 4.7–10.0 years). In total, 331 (frequency, 15.3%) cases of MACE were identified during follow-up, including 270 (12.5%) deaths and 61 (2.8%) non-fatal MIs.
Figure 2
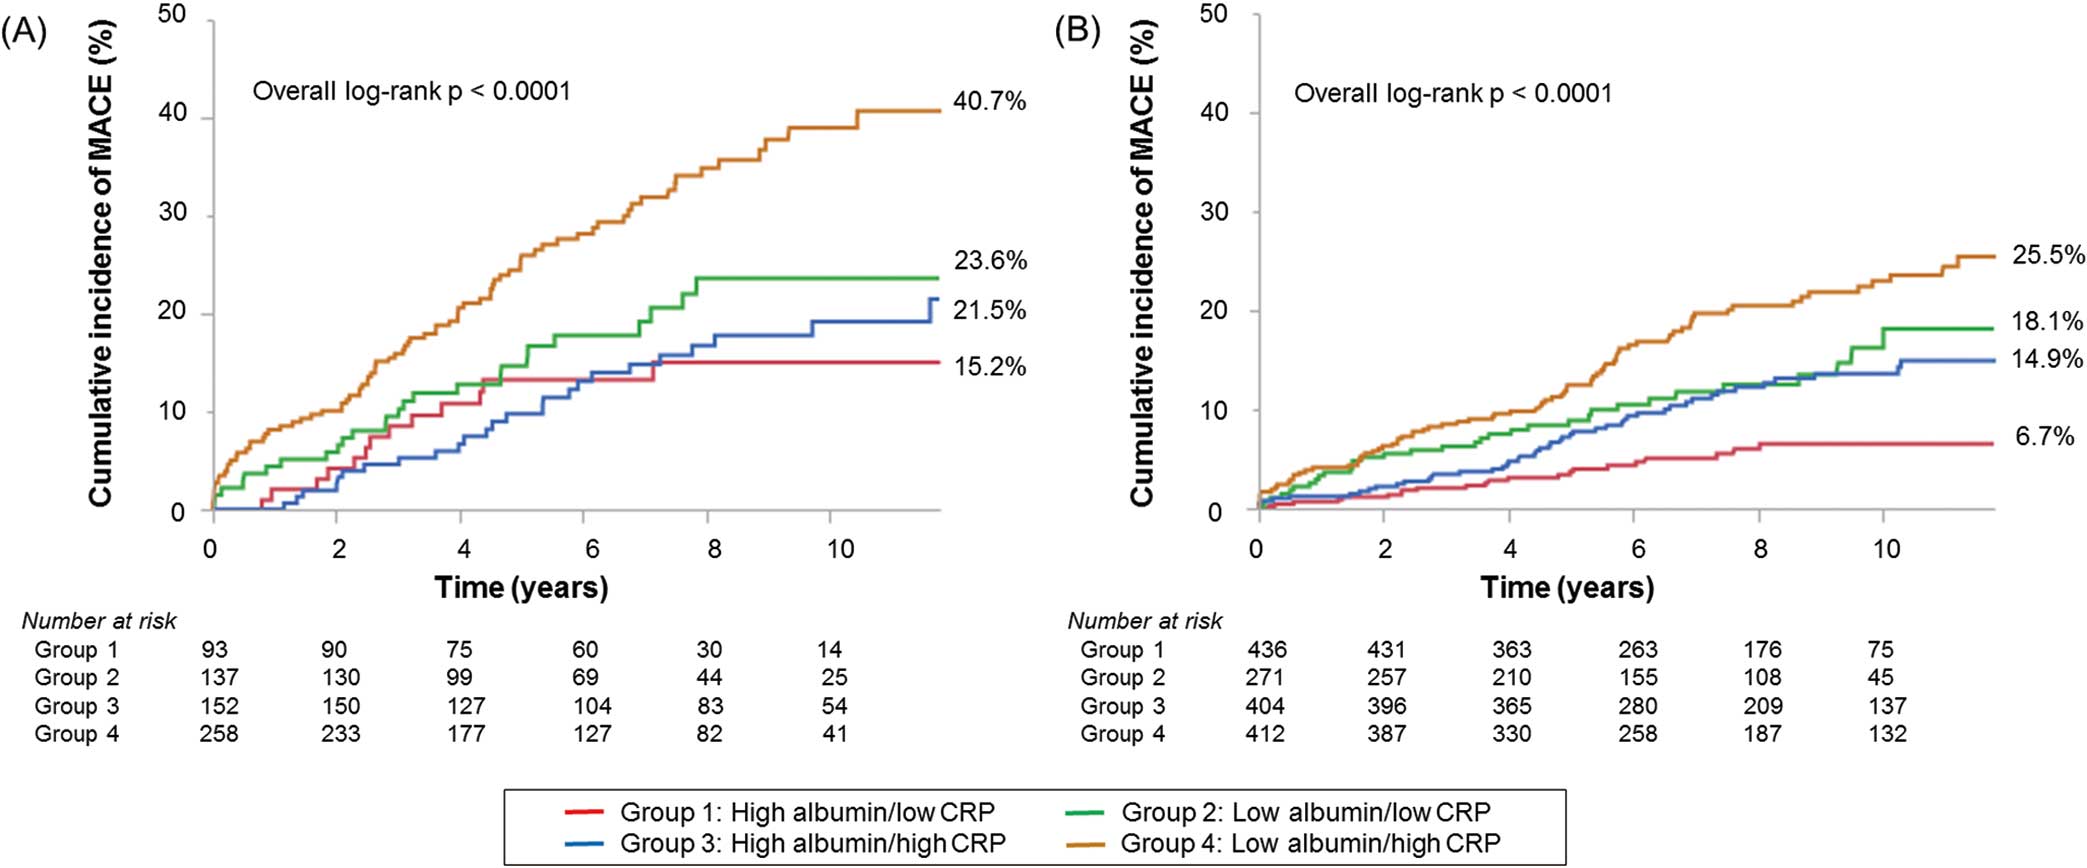
shows the Kaplan-Meier curves for MACE and all-cause death for the groups. The curves of the groups differed significantly (log-rank test, both P<0.0001), and the cumulative incidences of these clinical events increased clearly in the low albumin/high CRP group. Furthermore, Kaplan-Meier curves for MACE showed significant differences in the incidence of events between the low albumin/high CRP group and other groups, even stratified by CKD (Figure 3). Risk analyses using Cox proportional hazard models revealed significant interactions between serum albumin and hs-CRP levels (P=0.006).
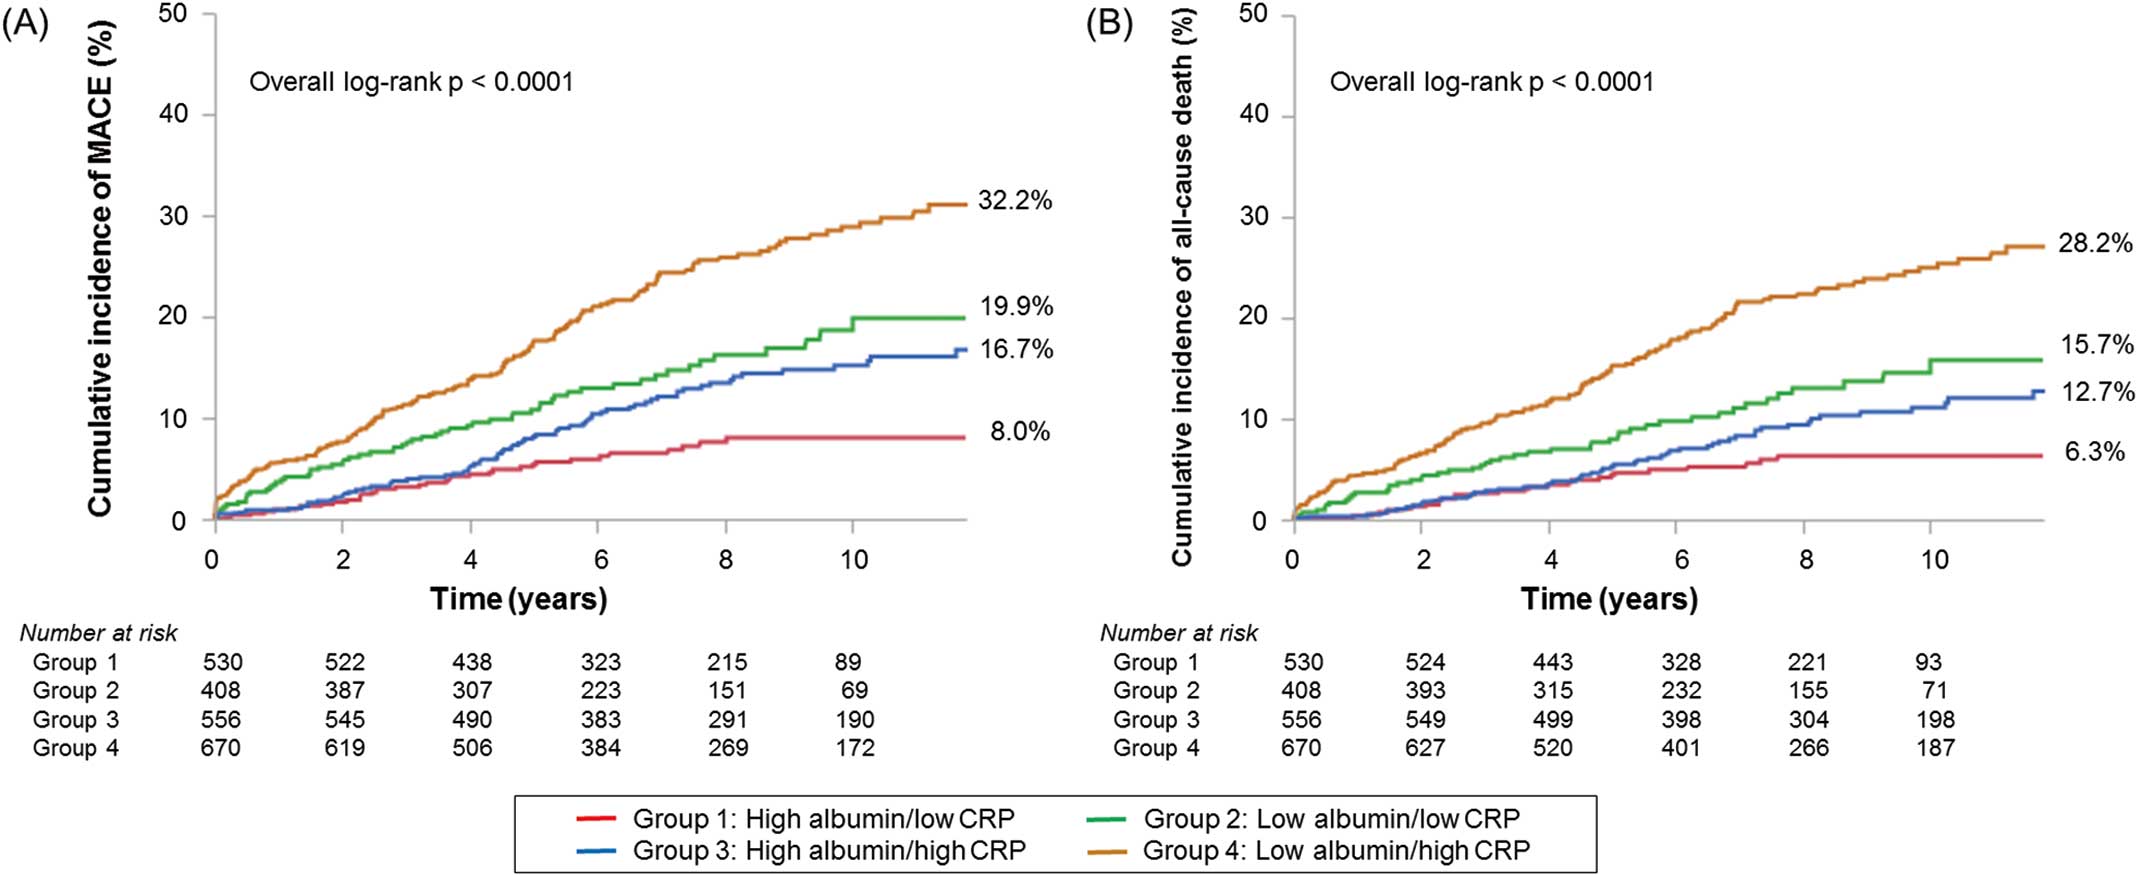
Table 2
shows the Cox proportional hazard analyses for MACE and all-cause death. After adjustment for other confounders, serum albumin and hs-CRP levels were independent predictors for MACE and all-cause death. In the analysis of serum albumin and CRP combined, patients in the low albumin/high CRP group had significantly higher MACE and mortality compared with the high albumin/low CRP group (HR 2.55, 95% CI 1.72–3.88, P<0.0001; HR 2.51, 95% CI 1.62–4.06, P<0.0001, respectively) (Table 3).
Table 2.
Cox Hazard Analyses for MACE and All-Cause Death of Study Patients Undergoing 1st PCI
| |
Univariate |
Multivariate |
| HR |
95% CI |
P value |
HR |
95% CI |
P value |
| MACE (all-cause death+non-fatal MI) |
| Serum albumin, 1 g/dL decrease |
2.94 |
2.38–3.70 |
<0.0001 |
1.75 |
1.35–2.33 |
<0.0001 |
| hs-CRP, 1 mg/dL increase |
2.80 |
1.80–4.25 |
<0.0001 |
1.85 |
1.15–2.99 |
0.01 |
| ACS |
1.57 |
1.25–1.96 |
<0.0001 |
1.43 |
1.10–1.84 |
0.006 |
| Age |
1.05 |
1.04–1.06 |
<0.0001 |
1.03 |
1.02–1.05 |
<0.0001 |
| BMI |
0.91 |
0.88–0.94 |
<0.0001 |
0.97 |
0.93–1.00 |
0.07 |
| CKD |
2.05 |
1.64–2.54 |
<0.0001 |
1.62 |
1.28–2.06 |
<0.0001 |
| Current smoker |
0.97 |
0.76–1.23 |
0.81 |
– |
– |
– |
| Diabetes |
1.20 |
0.97–1.49 |
0.10 |
– |
– |
– |
| Hypertension |
1.26 |
0.98–1.62 |
0.07 |
– |
– |
– |
| LVEF |
0.98 |
0.97–0.99 |
<0.0001 |
0.99 |
0.980–0.996 |
0.006 |
| Multivessel disease |
1.26 |
1.01–1.58 |
0.04 |
1.26 |
0.997–1.603 |
0.05 |
| Statin use |
0.54 |
0.43–0.67 |
<0.0001 |
0.56 |
0.44–0.70 |
<0.0001 |
| All-cause death |
| Serum albumin, 1 g/dL decrease |
3.23 |
2.50–4.17 |
<0.0001 |
1.75 |
1.32–2.38 |
0.0002 |
| hs-CRP, 1 mg/dL increase |
3.42 |
2.14–5.37 |
<0.0001 |
2.21 |
1.32–3.71 |
0.004 |
| ACS |
1.52 |
1.18–1.95 |
0.002 |
1.31 |
0.99–1.73 |
0.06 |
| Age |
1.07 |
1.05–1.09 |
<0.0001 |
1.05 |
1.04–1.07 |
<0.0001 |
| BMI |
0.89 |
0.85–0.92 |
<0.0001 |
0.95 |
0.916–0.996 |
0.03 |
| CKD |
2.30 |
1.81–2.92 |
<0.0001 |
1.65 |
1.27–2.15 |
0.0002 |
| Current smoker |
1.03 |
0.78–1.33 |
0.85 |
– |
– |
– |
| Diabetes |
1.16 |
0.91–1.48 |
0.22 |
– |
– |
– |
| Hypertension |
1.30 |
0.99–1.72 |
0.06 |
– |
– |
– |
| LVEF |
0.98 |
0.97–0.99 |
<0.0001 |
0.98 |
0.97–0.99 |
0.0006 |
| Multivessel disease |
1.26 |
0.99–1.61 |
0.06 |
– |
– |
– |
| Statin use |
0.53 |
0.42–0.68 |
<0.0001 |
0.56 |
0.43–0.72 |
<0.0001 |
CI, confidence interval; HR, hazard ratio; MACE, major adverse cardiac events; MI, myocardial infarction. Other abbreviations as in Table 1.
Table 3.
Cox Proportional Hazards Models for MACE and All-Cause Death of Study Patients Undergoing 1st PCI
| |
Univariate |
Multivariate |
| HR |
95% CI |
P value |
P for trend |
HR |
95% CI |
P value |
P for trend |
| MACE |
| High albumin/low CRP |
Ref. |
– |
– |
<0.0001 |
Ref. |
– |
– |
<0.0001 |
| Low albumin/low CRP |
2.33 |
1.54–3.57 |
<0.0001 |
|
1.84 |
1.18–2.90 |
0.007 |
|
| High albumin/high CRP |
1.80 |
1.21–2.72 |
0.003 |
|
1.82 |
1.20–2.83 |
0.005 |
|
| Low albumin/high CRP |
3.84 |
2.70–5.62 |
<0.0001 |
|
2.55 |
1.72–3.88 |
<0.0001 |
|
| All-cause death |
| High albumin/low CRP |
Ref. |
– |
– |
<0.0001 |
Ref. |
– |
– |
0.0005 |
| Low albumin/low CRP |
2.25 |
1.41–3.64 |
0.0006 |
|
1.76 |
1.07–2.95 |
0.03 |
|
| High albumin/high CRP |
1.61 |
1.02–2.57 |
0.04 |
|
1.66 |
1.03–2.76 |
0.04 |
|
| Low albumin/high CRP |
4.10 |
2.78–6.28 |
<0.0001 |
|
2.51 |
1.62–4.06 |
<0.0001 |
|
Adjusted-for variables were ACS, age, BMI, CKD, LVEF, multivessel disease, and use of statins. These covariates were added to this model only if identified as significant predictors of MACE and all-cause death (P<0.05). CRP, C-reactive protein. Other abbreviations as in Tables 1,2.
The C-index for MACE and all-cause death was greater in the baseline model with serum albumin and with hs-CRP compared with the baseline model alone, and it was much greater in the model with both serum albumin and hs-CRP values (Table 4). The NRI and IDI for MACE and all-cause death were also significantly increased after serum albumin or hs-CRP or both were added to the baseline model. Furthermore, NRI and IDI increased significantly in the model with both serum albumin and hs-CRP, even compared with the models with serum albumin alone and with hs-CRP alone.
Table 4.
Discrimination of Each Predictive Model for MACE and Death Using the C-Index, NRI, and IDI
| |
C-index |
P value |
NRI |
P value |
IDI |
P value |
| MACE (death+non-fatal MI) |
| Established risk factors |
0.69 |
Ref. |
– |
Ref. |
– |
Ref. |
| Established risk factors+serum albumin |
0.70 |
0.01 |
0.19 |
0.003 |
0.010 |
0.001 |
| Established risk factors+hs-CRP |
0.70 |
0.04 |
0.23 |
0.0002 |
0.006 |
0.01 |
| Established risk factors+serum albumin and hs-CRP |
0.71 |
0.002 |
0.18 |
0.003 |
0.014 |
0.0001 |
| Serum albumin vs. serum albumin and hs-CRP |
– |
– |
0.22 |
0.0003 |
0.004 |
0.04 |
| hs-CRP vs. serum albumin and hs-CRP |
– |
– |
0.14 |
0.02 |
0.008 |
0.003 |
| Death |
| Established risk factors |
0.72 |
Ref. |
– |
Ref. |
– |
Ref. |
| Established risk factors+serum albumin |
0.74 |
0.03 |
0.21 |
0.002 |
0.008 |
0.01 |
| Established risk factors+hs-CRP |
0.74 |
0.045 |
0.27 |
<0.0001 |
0.008 |
0.02 |
| Established risk factors+serum albumin and hs-CRP |
0.74 |
0.006 |
0.16 |
0.02 |
0.014 |
0.0006 |
| Serum albumin vs. serum albumin+hs-CRP |
– |
– |
0.24 |
0.0003 |
0.006 |
0.03 |
| hs-CRP vs. serum albumin+hs-CRP |
– |
– |
0.14 |
0.04 |
0.007 |
0.02 |
Established risk factors included ACS, age, BMI, CKD, LVEF, multivessel disease, and use of statins. IDI, integrated discrimination improvement; NRI, net reclassification improvement. Other abbreviations as in Tables 1,2.
Discussion
The major findings of the present study were as follows: (1) patients with low serum albumin and high hs-CRP levels showed significantly higher incidences of MACE and all-cause death than other patients; (2) multivariate Cox hazard analysis showed that both decreased serum albumin and increased hs-CRP levels were independent predictors of adverse cardiac events in post-PCI patients; and (3) the combination of serum albumin and hs-CRP was more closely related to clinical outcomes than either variable alone.
The hs-CRP level is one of the most useful inflammatory biomarkers for predicting cardiovascular diseases or clinical outcomes. Preprocedural hs-CRP elevation in post-PCI patients has been shown to be associated with higher rates of adverse cardiac events.6,15–17
On the other hand, hypoalbuminemia is a common finding in patients with chronic disease or poor nutritional status, and it becomes more prevalent in older patients or those with CKD.18,19
Previous studies showed that hypoalbuminemia was associated with worse clinical outcomes among patients with heart failure, cancer, stroke, or various other diseases.19–22
Plakht et al demonstrated that the serum albumin level on admission of patients with acute MI is an independent prognostic marker for long-term death.23
Recently, the relationship between CRP and serum albumin (the ratio of CRP to albumin) has been reported as a prognostic marker in patients with various diseases such as severe sepsis, CKD, or cancer.24–27
Furthermore, Ishii et al showed that the combination of lower serum albumin and elevated hs-CRP levels could strongly predict increased risk of amputation and death after endovascular therapy in hemodialysis patients with peripheral artery disease.28
The present study showed that the serum albumin and hs-CRP levels were both significantly associated with long-term clinical outcomes, and that the combination of these markers was an even stronger predictor in CAD patients who underwent PCI using Cox hazard analysis and discrimination analysis. To the best of our knowledge, this is the first study to show the combined effects of serum albumin and CRP on long-term outcomes in patients following PCI. We also believe that our results point to a promising and simple risk stratification tool for these CAD patients.
Patients in the lower serum albumin and higher hs-CRP group tended to have poor clinical status, such as older age, CKD, or lower BMI in the present study. However, even after adjusting for these factors, multivariate Cox hazard analysis showed that patients in this group had significantly worse clinical outcomes than patients in the other groups. One possible explanation is the various properties of albumin. The albumin plasma level is influenced by many factors, such as albumin synthesis, clearance, and dilution.29,30
Albumin synthesis is regulated by stimuli that include nutrient intake, insulin level, and oncotic pressure. Hypoalbuminemia is therefore thought to result from malnutrition, inflammation, or cachexia. Indeed, a previous study showed a significant association between decreased serum albumin levels and elevation of several inflammatory markers in patients with acute MI.31
These relationships suggest synergistic effects of the serum albumin and hs-CRP levels for predicting long-term clinical outcomes in patients with atherosclerotic diseases. Moreover, serum albumin has been shown to have antioxidant activity,32
related to its ligand-binding capacity.33
Serum albumin has also been reported to be a specific inhibitor of human endothelial apoptosis34
and a significant inhibitor of platelet activation and aggregation.35
Malnutrition is a complex state involving reduction of protein reserves, caloric collapse, and weakening of immune defenses. The MIA syndrome describes the high correlation of 3 significant separate clinical entities, namely malnutrition, inflammation, and atherosclerosis, which coexist in patients with CKD, especially ESRD.36
The MIA syndrome is considered to be an important issue for clinical management because of its high mortality rate. Nakagomi et al also found that malnutrition correlated with inflammation and atherosclerosis in patients with chronic heart failure and was associated with worse clinical outcomes.37
In the present study, patients with low serum albumin and high hs-CRP levels had a higher prevalence of cardiac events, even in the non-CKD population. We therefore believe that MIA should be evaluated not only in CKD patients, but also non-CKD patients.
Study Limitations
First, as a single-center, observational study of a small patient cohort, unknown confounding factors might have affected the outcomes, regardless of analytical adjustments. The relatively small number of events may also have contributed to the lack of statistically significant differences. Second, although variables showing P<0.05 in univariate analyses were included in multivariate analyses, it is possible that other parameters affect the occurrence of cardiac events. Third, in some patients, high hs-CRP might be affected by the underlying disease or undetected infection. Finally, we only collected the information about medications on admission. Thus, information was not available about medical therapy after PCI that may have affected the prognosis of these patients.
Conclusions
Low serum albumin levels with high CRP levels were independently associated with long-term outcomes in post-PCI patients. Serum albumin and hs-CRP values had a combined predictive effect in CAD patients.
Acknowledgments
The authors are grateful to the staff of the Department of Cardiovascular Medicine at Juntendo University and the Department of Cardiology at Juntendo University Shizuoka Hospital. The authors also appreciate the secretarial assistance of Yumi Nozawa and Ayako Onodera.
Conflict of Interest / Funding
None.
References
- 1.
Ridker PM, Cushman M, Stampfer MJ, Tracy RP, Hennekens CH. Inflammation, aspirin, and the risk of cardiovascular disease in apparently healthy men. N Engl J Med 1997; 336: 973–979.
- 2.
Ross R. Atherosclerosis: An inflammatory disease. N Engl J Med 1999; 340: 115–126.
- 3.
Danesh J, Wheeler JG, Hirschfield GM, Eda S, Eiriksdottir G, Rumley A, et al. C-reactive protein and other circulating markers of inflammation in the prediction of coronary heart disease. N Engl J Med 2004; 350: 1387–1397.
- 4.
Ridker PM. High-sensitivity C-reactive protein: Potential adjunct for global risk assessment in the primary prevention of cardiovascular disease. Circulation 2001; 103: 1813–1818.
- 5.
Speidl WS, Graf S, Hornykewycz S, Nikfardjam M, Niessner A, Zorn G, et al. High-sensitivity C-reactive protein in the prediction of coronary events in patients with premature coronary artery disease. Am Heart J 2002; 144: 449–455.
- 6.
Razzouk L, Muntner P, Bansilal S, Kini AS, Aneja A, Mozes J, et al. C-reactive protein predicts long-term mortality independently of low-density lipoprotein cholesterol in patients undergoing percutaneous coronary intervention. Am Heart J 2009; 158: 277–283.
- 7.
Shimada K, Fujita M, Tanaka A, Yoshida K, Jisso S, Tanaka H, et al. Elevated serum C-reactive protein levels predict cardiovascular events in the Japanese coronary artery disease (JCAD) study. Circ J 2009; 73: 78–85.
- 8.
Stenvinkel P, Heimburger O, Paultre F, Diczfalusy U, Wang T, Berglund L, et al. Strong association between malnutrition, inflammation, and atherosclerosis in chronic renal failure. Kidney Int 1999; 55: 1899–1911.
- 9.
Stenvinkel P, Heimburger O, Lindholm B, Kaysen GA, Bergstrom J. Are there two types of malnutrition in chronic renal failure?: Evidence for relationships between malnutrition, inflammation and atherosclerosis (MIA syndrome). Nephrol Dial Transplant 2000; 15: 953–960.
- 10.
Menon V, Greene T, Wang X, Pereira AA, Marcovina SM, Beck GJ, et al. C-reactive protein and albumin as predictors of all-cause and cardiovascular mortality in chronic kidney disease. Kidney Int 2005; 68: 766–772.
- 11.
Takahashi R, Ito Y, Takahashi H, Ishii H, Kasuga H, Mizuno M, et al. Combined values of serum albumin, C-reactive protein and body mass index at dialysis initiation accurately predicts long-term mortality. Am J Nephrol 2012; 36: 136–143.
- 12.
Teramoto T, Sasaki J, Ishibashi S, Birou S, Daida H, Dohi S, et al. Diagnostic criteria for dyslipidemia. J Atheroscler Thromb 2013; 20: 655–660.
- 13.
Seino Y, Nanjo K, Tajima N, Kadowaki T, Kashiwagi A, Araki E, et al. Report of the committee on the classification and diagnostic criteria of diabetes mellitus. J Diabetes Investig 2010; 1: 212–228.
- 14.
Matsuo S, Imai E, Horio M, Yasuda Y, Tomita K, Nitta K, et al. Revised equations for estimated GFR from serum creatinine in Japan. Am J Kidney Dis 2009; 53: 982–992.
- 15.
Karha J, Bavry AA, Rajagopal V, Henderson MR, Ellis SG, Brener SJ. Relation of C-reactive protein level and long-term risk of death or myocardial infarction following percutaneous coronary intervention with a sirolimus-eluting stent. Am J Cardiol 2006; 98: 616–618.
- 16.
Sabatine MS, Morrow DA, Jablonski KA, Rice MM, Warnica JW, Domanski MJ, et al. Prognostic significance of the Centers for Disease Control/American Heart Association high-sensitivity C-reactive protein cut points for cardiovascular and other outcomes in patients with stable coronary artery disease. Circulation 2007; 115: 1528–1536.
- 17.
Wada H, Dohi T, Miyauchi K, Shitara J, Endo H, Doi S, et al. Preprocedural high-sensitivity C-reactive protein predicts long-term outcome of percutaneous coronary intervention. Circ J 2016; 81: 90–95.
- 18.
Arques S, Roux E, Sbragia P, Gelisse R, Pieri B, Ambrosi P. Usefulness of serum albumin concentration for in-hospital risk stratification in frail, elderly patients with acute heart failure: Insights from a prospective, monocenter study. Int J Cardiol 2008; 125: 265–267.
- 19.
Liu M, Chan CP, Yan BP, Zhang Q, Lam YY, Li RJ, et al. Albumin levels predict survival in patients with heart failure and preserved ejection fraction. Eur J Heart Fail 2012; 14: 39–44.
- 20.
Corti MC, Guralnik JM, Salive ME, Sorkin JD. Serum albumin level and physical disability as predictors of mortality in older persons. JAMA 1994; 272: 1036–1042.
- 21.
Dziedzic T, Slowik A, Szczudlik A. Serum albumin level as a predictor of ischemic stroke outcome. Stroke 2004; 35: e156–e158.
- 22.
Uthamalingam S, Kandala J, Daley M, Patvardhan E, Capodilupo R, Moore SA, et al. Serum albumin and mortality in acutely decompensated heart failure. Am Heart J 2010; 160: 1149–1155.
- 23.
Plakht Y, Gilutz H, Shiyovich A. Decreased admission serum albumin level is an independent predictor of long-term mortality in hospital survivors of acute myocardial infarction: Soroka Acute Myocardial Infarction II (SAMI-II) project. Int J Cardiol 2016; 219: 20–24.
- 24.
Hwang JC, Jiang MY, Lu YH, Wang CT. Precedent fluctuation of serum hs-CRP to albumin ratios and mortality risk of clinically stable hemodialysis patients. PLoS One 2015; 10: e0120266.
- 25.
Kim MH, Ahn JY, Song JE, Choi H, Ann HW, Kim JK, et al. The C-reactive protein/albumin ratio as an independent predictor of mortality in patients with severe sepsis or septic shock treated with early goal-directed therapy. PLoS One 2015; 10: e0132109.
- 26.
Kinoshita A, Onoda H, Imai N, Iwaku A, Oishi M, Tanaka K, et al. The C-reactive protein/albumin ratio, a novel inflammation-based prognostic score, predicts outcomes in patients with hepatocellular carcinoma. Ann Surg Oncol 2015; 22: 803–810.
- 27.
Wei XL, Wang FH, Zhang DS, Qiu MZ, Ren C, Jin Y, et al. A novel inflammation-based prognostic score in esophageal squamous cell carcinoma: The C-reactive protein/albumin ratio. BMC Cancer 2015; 15: 350.
- 28.
Ishii H, Aoyama T, Takahashi H, Kamoi D, Tanaka M, Yoshikawa D, et al. Serum albumin and C-reactive protein levels predict clinical outcome in hemodialysis patients undergoing endovascular therapy for peripheral artery disease. Atherosclerosis 2013; 227: 130–134.
- 29.
Levitt DG, Levitt MD. Human serum albumin homeostasis: A new look at the roles of synthesis, catabolism, renal and gastrointestinal excretion, and the clinical value of serum albumin measurements. Int J Gen Med 2016; 9: 229–255.
- 30.
Don BR, Kaysen G. Serum albumin: Relationship to inflammation and nutrition. Semin Dial 2004; 17: 432–437.
- 31.
Oduncu V, Erkol A, Karabay CY, Kurt M, Akgun T, Bulut M, et al. The prognostic value of serum albumin levels on admission in patients with acute ST-segment elevation myocardial infarction undergoing a primary percutaneous coronary intervention. Coron Artery Dis 2013; 24: 88–94.
- 32.
Turell L, Carballal S, Botti H, Radi R, Alvarez B. Oxidation of the albumin thiol to sulfenic acid and its implications in the intravascular compartment. Braz J Med Biol Res 2009; 42: 305–311.
- 33.
Roche M, Rondeau P, Singh NR, Tarnus E, Bourdon E. The antioxidant properties of serum albumin. FEBS Lett 2008; 582: 1783–1787.
- 34.
Zoellner H, Hofler M, Beckmann R, Hufnagl P, Vanyek E, Bielek E, et al. Serum albumin is a specific inhibitor of apoptosis in human endothelial cells. J Cell Sci 1996; 109: 2571–2580.
- 35.
Dhindsa S, Ghanim H, Dandona P. Nonesterified fatty acids, albumin, and platelet aggregation. Diabetes 2015; 64: 703–705.
- 36.
Jeznach-Steinhagen A, Slotwinski R, Szczygiel B. Malnutrition, inflammation, atherosclerosis in hemodialysis patients. Rocz Panstw Zakl Hig 2007; 58: 83–88.
- 37.
Nakagomi A, Kohashi K, Morisawa T, Kosugi M, Endoh I, Kusama Y, et al. Nutritional status is associated with inflammation and predicts a poor outcome in patients with chronic heart failure. J Atheroscler Thromb 2016; 23: 713–727.