Abstract
Background:
The associations between body mass index (BMI) and incidence of atrial fibrillation (AF) in young men are scarce, especially in Asian countries, given the differences in BMI between Asians and Western populations.
Methods and Results:
This study analyzed 17,865 middle-aged Japanese men without AF from a cohort of employees undergoing annual health examinations. AF incidence was evaluated during a follow-up period (median 4.0 years, interquartile range 2.0–7.1 years). Among young men aged 30–49 years, AF incidence was 0.64/1,000 person-years, whereas it was 2.54/1,000 and 7.60/1,000 person-years among men aged 50–59 and ≥60 years, respectively. Multivariable Cox regression analysis among young men revealed age (hazard ratio [HR] 3.28 by 10-years’ increase, 95% confidence interval [CI] 1.72–6.25, P<0.001), BMI (BMI-quadratic, HR 1.01, 95% CI 1.00–1.01, P<0.001, BMI-linear, HR 0.95, 95% CI 0.86–1.05, P=0.33), and electrocardiogram (ECG) abnormalities, such as PQ prolongation, supraventricular beat, and p wave abnormality (HR 8.79, 95% CI 3.05–25.32, P<0.001), were significantly associated with AF incidence. There was a reverse J-shaped association between BMI and AF incidence in young men, whereby the presence of ECG abnormality inversely influenced the BMI-incident AF relationship. A linear association between BMI and AF incidence in men aged 50–59 and ≥60 years was present.
Conclusions:
AF incidence displays a reverse J-shaped relationship with BMI in young men, but a linear association in men aged ≥50 years. The paradoxical relationship seen in young men only may reflect atrial electrical or structural abnormalities.
Obesity is associated with many cardiovascular diseases (CVD) and inherently has an independent association with an increased risk of incident atrial fibrillation (AF).1
A meta-analysis of cohort and case-control studies validated the hypothesis that obesity is closely associated with the risk of AF.2,3
Furthermore, we previously reported that body mass index (BMI) affects age-related changes in AF incidence.4
Several studies (predominantly from Western cohorts) have quantified the magnitude of the association between an increase in BMI and the development of incident AF in middle-aged and older subjects,1,5–11
although the associations between BMI and incidence of AF in young men are scarce, especially in Asian countries. The latter is relevant given the differences in BMI between Asians and Western populations.12
The aim of the present study is to elucidate the shape of the association between BMI and AF incidence in young men in Japan and, second, to explore age group-based differences regarding this association.
Methods
The Nishimura Health Survey is an ongoing cohort investigation of risk factors for chronic diseases including hypertension, metabolic syndrome, and diabetes mellitus, as well as AF.4
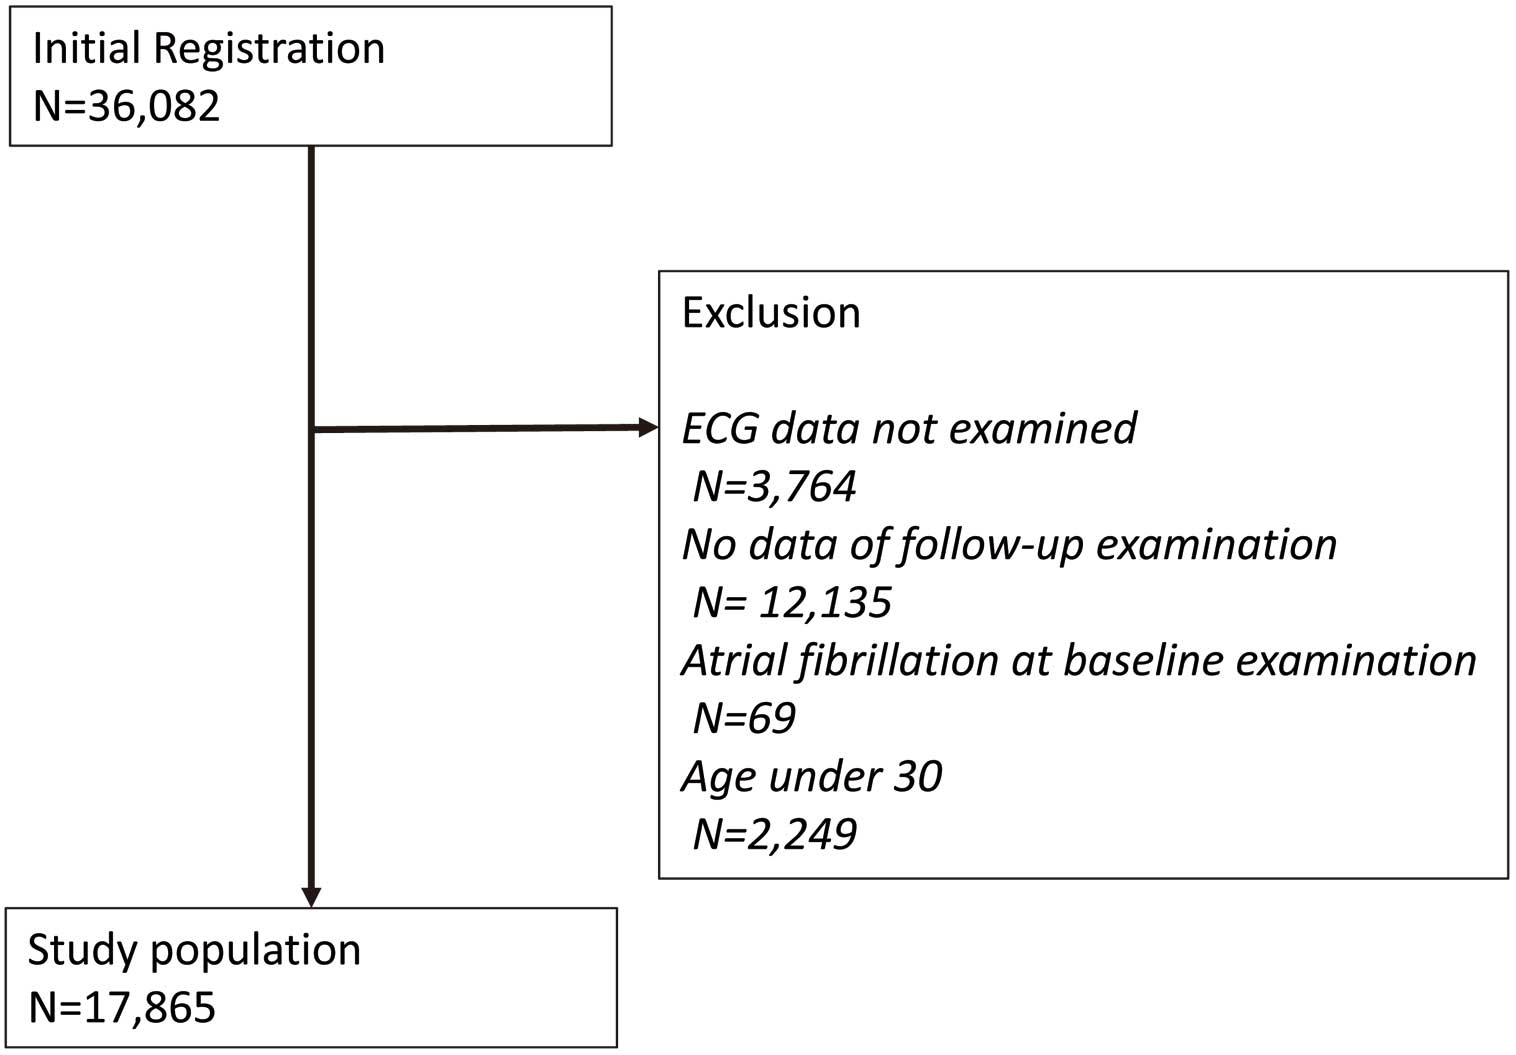
The Nishimura Clinic (Kyoto, Japan) provides regular health check-ups for employees of various companies. In Japan, annual routine health examinations of employees are legally mandated, and the employers usually pay all or most of the health examination costs. We conducted a retrospective cohort study to assess the patterns of age-specific associations between BMI and the incidence of AF during a follow-up period of a median 4.0 years (interquartile range 2.0–7.1 years). Among 36,082 men who underwent health examinations between 1 January 2005 and 27 March 2019, we excluded 12,135 subjects who underwent only 1 health examination. We also excluded 3,764 subjects with electrocardiogram (ECG) data that were not examined and 69 subjects with ECG indicating AF at recruitment. From the remaining 20,114 subjects, we excluded 2,249 subjects aged <30 years at baseline. Finally, 17,865 subjects were selected as being eligible according to the study criteria (Figure 1). The clinical characteristics of the participants who were excluded from the analyses were almost identical to that of the study participants (data not shown).
The subjects were divided into the following groups according to age strata: 30–49, 50–59, and ≥60 years. All procedures conducted in the present study were approved by the local research ethics committee and were conducted in accordance with the Declaration of Helsinki. Informed consent was obtained from all subjects.
Data Collection and Measurements
All subjects provided details of their demographic characteristics. BMI was calculated as weight in kilograms divided by height in square meters. After an overnight fast, venous blood was collected for the measurement of various factors including fasting plasma glucose, high-density lipoprotein (HDL) cholesterol, and triglyceride (TG). Well-trained nurses measured each participant’s blood pressure (BP) 2 times using an automatic BP monitor, and BP values were taken as the average of the 2 measurements. ECG abnormality was defined as having at least 1 of the following diagnosis at baseline: PQ prolongation, supraventricular beat, and p wave abnormality. Hypertension was defined as systolic BP ≥140 mmHg or diastolic BP ≥90 mmHg and/or current use of antihypertensives. Diabetes was defined as fasting plasma glucose levels ≥126 mg/dL and/or current use of antidiabetic drugs. Hyperuricemia was defined as uric acid ≥7 mg/dL and/or current use of drugs lowering the level of uric acid. Dyslipidemia was defined as low-density lipoprotein cholesterol ≥140 mg/dL or HDL cholesterol <40 mg/dL or TGs ≥150 mg/dL and/or current use of lipid-lowering drugs.
Physicians and nurses administered questionnaires covering personal habits and present illness. Smoking habits were classified as current smoker, ex-smoker, never smoker, and unknown, and drinking habits were daily, sometimes, seldom, never drinking, and unknown. Participants were diagnosed with AF if AF (Minnesota Codes 8-3-1 and 8-3-3) was present on their ECG (n=47) or when indicated while interviewing a patient (n=76). The endpoint of the follow up for each participant was determined by 1 of the following, whichever occurred first: (1) the date of the first AF event; (2) the date of the last health examination; or (3) 27 March 2019 (censored).
Statistical Analysis
The clinical characteristics of study participants are presented as mean±standard deviation for continuous variables and as numbers (percentage) for categorical variables by age categories. The prevalence of AF across the study groups is shown using bar graphs. This study used the data of annual health checkups. Therefore, if a subject is diagnosed with AF at his/her regular checkup, the occurrence of AF is considered to be between his/her last visit and the current visit. Such time-to-event data are called interval-censored data, and the semi-parametric Cox proportional hazard model is not feasible because the time-to-event is expressed as the interval, not a certain time point. Thus, we estimated the baseline hazard parametrically, using a cubic spline model.13
The following variables were analyzed as potential covariates: age, hypertension, diabetes mellitus, dyslipidemia, and hyperuricemia. Drinking and smoking habits, history of myocardial infarction, angina, stroke, and/or heart disease, and family history of heart disease were not included in Cox regression analyses because the sample size was small.
To assess the linearity of BMI with incident AF, the BMI-linear model and the BMI-quadratic model were compared using Akaike Information Criterion (AIC) in both all cohort and each subgroup of age, by adding the BMI-quadratic term. In order to prevent collinearity, both BMI-linear and BMI-quadratic terms were centered. Then, the model with the lower AIC was chosen to estimate the log hazard ratio (HR) of BMI for incident AF in both all cohort and each subgroup, with BMI=23.4 as a reference (log hazard=0). For each subgroup of age, we further explored the effect of BMI on incident AF by ECG abnormality status at baseline by adding the interaction term between BMI-linear term and ECG abnormality status at baseline. A P value <0.05 was considered to indicate statistical significance. Statistical analyses were conducted using SAS software, version 9.4, and JMP Pro 15 (both from the SAS Institute Inc., Cary, NC, USA).
Results
Baseline characteristics of the 17,865 study participants are shown in
Table 1. Overall, the mean age of the participants was 43.8±9.4 years. When compared with those who were older in age, participants who were younger in age had a lower proportion of the following variables: waist circumference; BP; total cholesterol; TG; fasting glucose; drinking habit; history of heart disease; family history of heart disease; ECG abnormality such as PQ prolongation and supraventricular beat; and had a higher proportion of smokers.
Table 1.
Clinical Characteristics of the Study Participants by Age Category
| |
Age (years) |
Total (N=17,865) |
| 30–49 (N=13,057) |
50–59 (N=3,565) |
≥60 (N=1,243) |
P value |
| Age (years) |
39.1±5.5 |
54.0±2.8 |
63.7±3.7 |
<0.001 |
43.8±9.4 |
| BMI (kg/m2) |
23.4±3.4 |
23.7±3.0 |
23.2±2.8 |
<0.001 |
23.4±3.3 |
| Waist circumference (cm) |
82.8±9.3a |
85.5±8.2b |
85.1±8.1c |
<0.001 |
83.5±9.1 |
| SBP (mmHg) |
122.6±14.5d |
127.8±16.7 |
132.7±18.2e |
<0.001 |
124.4±15.6 |
| DBP (mmHg) |
75.7±10.8d |
81.2±11.3 |
82.1±11.1e |
<0.001 |
77.3±11.2 |
| Total cholesterol (mg/dL) |
200±33f |
208±33g |
206±33h |
<0.001 |
202±33 |
| LDL cholesterol (mg/dL) |
122±31i |
125±30j |
123±31k |
<0.001 |
122±31 |
| HDL cholesterol (mg/dL) |
62±16l |
63±17m |
63±17 |
<0.001 |
62±16 |
| Triglyceride (mg/dL) |
118±95n |
133±107m |
121±75 |
<0.001 |
121±96 |
| Fasting glucose (mg/dL) |
95±16o |
103±20p |
105±23q |
<0.001 |
97±18 |
| Uric acid (mg/dL) |
6.1±1.2r |
6.1±1.2s |
5.9±1.2t |
<0.001 |
6.1±1.2 |
| Drinking |
| Never |
457 (8.7) |
130 (9.4) |
57 (10.9) |
<0.001 |
644 (9.0) |
| Seldom |
1,347 (25.6) |
245 (17.8) |
84 (16.1) |
|
1,676 (23.4) |
| Sometimes |
2,010 (38.2) |
430 (31.2) |
138 (26.5) |
|
2,578 (36.0) |
| Daily |
1,441 (27.4) |
572 (41.5) |
242 (46.4) |
|
2,255 (31.5) |
| Unknown |
7,802 |
2,188 |
722 |
|
10,712 |
| Smoking |
| Never-smoker |
2,448 (46.7) |
480 (34.9) |
200 (38.5) |
<0.001 |
3,128 (43.8) |
| Ex-smoker |
972 (18.5) |
454 (33.0) |
204 (39.3) |
|
1,630 (22.8) |
| Smoker |
1,824 (34.8) |
442 (32.1) |
115 (22.2) |
|
2,381 (33.4) |
| Unknown |
7,813 |
2,189 |
724 |
|
10,726 |
| Hypertension |
| No |
11,304 (86.6) |
2,481 (69.6) |
745 (60.0) |
<0.001 |
14,530 (81.4) |
| Yes |
1,748 (13.4) |
1,084 (30.4) |
497 (40.0) |
|
3,329 (18.6) |
| Unknown |
5 |
|
1 |
|
6 |
| Diabetes mellitus |
| No |
12,672 (97.7) |
3,258 (91.7) |
1,090 (87.8) |
<0.001 |
17,020 (95.8) |
| Yes |
302 (2.3) |
295 (8.3) |
152 (12.2) |
|
749 (4.2) |
| Unknown |
83 |
12 |
1 |
|
96 |
| Dyslipidemia |
| No |
8,054 (61.9) |
1,926 (54.1) |
696 (56.0) |
<0.001 |
10,676 (59.9) |
| Yes |
4,954 (38.1) |
1,634 (45.9) |
547 (44.0) |
|
7,135 (40.1) |
| Unknown |
49 |
5 |
|
|
54 |
| Hyperuricemia |
| No |
9,969 (78.7) |
2,610 (75.9) |
945 (77.9) |
0.002 |
13,524 (78.1) |
| Yes |
2,696 (21.3) |
827 (24.1) |
268 (22.1) |
|
3,791 (21.9) |
| Unknown |
392 |
128 |
30 |
|
550 |
| History of myocardial infarction and/or angina |
| No |
269 (98.2) |
85 (78.7) |
35 (70.0) |
<0.001 |
389 (90.0) |
| Yes |
5 (1.8) |
23 (21.3) |
15 (30.0) |
|
43 (10.0) |
| Unknown |
12,783 |
3,457 |
1,193 |
|
17,433 |
| History of stroke |
| No |
671 (97.0) |
147 (88.6) |
56 (77.8) |
<0.001 |
874 (94.0) |
| Yes |
21 (3.0) |
19 (11.4) |
16 (22.2) |
|
56 (6.0) |
| Unknown |
12,365 |
3,399 |
1,171 |
|
16,935 |
| History of heart disease |
| No |
4,154 (95.3) |
688 (88.9) |
185 (76.1) |
<0.001 |
5,027 (93.5) |
| Yes |
207 (4.7) |
86 (11.1) |
58 (23.9) |
|
351 (6.5) |
| Unknown |
8,696 |
2,791 |
1,000 |
|
12,487 |
| Family history of heart disease |
| No |
5,394 (91.1) |
1,260 (87.0) |
486 (87.7) |
<0.001 |
7,140 (90.1) |
| Yes |
528 (8.9) |
189 (13.0) |
68 (12.3) |
|
785 (9.9) |
| Unknown |
7,135 |
2,116 |
689 |
|
9,940 |
| ECG abnormality |
| PQ extension |
71 (0.5) |
37 (1.0) |
15 (1.2) |
<0.001 |
123 (0.7) |
| Supraventricular beat |
37 (0.3) |
25 (0.7) |
12 (1.0) |
<0.001 |
74 (0.4) |
| P wave abnormality |
52 (0.4) |
11 (0.3) |
8 (0.6) |
0.27 |
71 (0.4) |
BMI, body mass index; DBP, diastolic blood pressure; HDL, high-density lipoprotein; LDL, low-density lipoprotein; SBP, systolic blood pressure. Data are presented as mean±SD for the continuous variables and N (%) for the categorical variables. P value is for the comparison between groups by using a 1-way analysis of variance or a chi-squared test. Numbers of missing values: na=2,488; nb=748; nc=25;7 nd=6; ne=1; nf=2,270; ng=383; nh=128; ni=2,345; nj=734; nk=256; nl=78; nm=9; nn=92; no=131; np=18; nq=4; nr=611; ns=157; nt=39 otherwise there were no missing values. Drinking and smoking status were only available for those participants who had their first visit after April 2013.
During follow-up periods (median 4.0 years, interquartile range 2.0–7.1 years), AF developed in 123 participants (mean age, 53.0±9.0 years; incidence, 1.39 per 1,000 person-years). The age-specific prevalence of AF is shown in
Figure 2. Incidence rates of AF were higher with advanced age (P for trend <0.001) as follows: 0.64/1,000 person-years, 2.54/1,000 person-years, and 7.60/1,000 person-years for men in the age groups 30–49, 50–59, and ≥60 years, respectively.

In multivariable Cox proportional hazard models, the BMI-quadratic model showed a smaller AIC than the BMI-linear model in all cohort and the 30- to 49-year age group, whereas the BMI-linear model showed a smaller AIC among for the age groups 50–59 and ≥60 years. Multivariable Cox regression analysis among young men revealed that age (HR 3.28 by 10-year increase, 95% confidence interval [CI] 1.72–6.25, P<0.001), BMI (BMI-quadratic, HR 1.01, 95% CI 1.00–1.01, P<0.001; BMI-linear, HR 0.95, 95% CI 0.86–1.05, P=0.33), and ECG abnormalities, such as PQ prolongation, supraventricular beat, and p wave abnormality (HR 8.79, 95% CI 3.05–25.32, P<0.001), were significantly associated with AF risk (Table 2).
Table 2.
Multivariable Cox Regression Analysis in the Age Group 30–49 Years
| |
Univariable |
Multivariable (N=12,626)
BMI-linear |
Multivariable (N=12,626)
BMI-quadratic |
| HR |
95% CI |
P value |
HR |
95% CI |
P value |
HR |
95% CI |
P value |
| Age (10 years) |
3.56 |
1.93–6.57 |
<0.001 |
3.06 |
1.62–5.76 |
<0.001 |
3.28 |
1.72–6.25 |
<0.001 |
| BMI-linear term (1 unit) |
1.10 |
1.02–1.19 |
0.01 |
1.07 |
0.98–1.17 |
0.12 |
0.95 |
0.86–1.05 |
0.33 |
BMI-quadratic term
(1-unit) |
1.01 |
1.00–1.01 |
<0.001 |
Not included in the model |
1.01 |
1.00–1.01 |
<0.001 |
| Hypertension |
2.64 |
1.35–5.13 |
0.004 |
1.69 |
0.82–3.50 |
0.16 |
1.74 |
0.81–3.72 |
0.15 |
| Diabetes mellitus |
4.18 |
1.49–11.71 |
0.01 |
1.90 |
0.62–5.83 |
0.26 |
2.47 |
0.80–7.58 |
0.12 |
| Dyslipidemia |
0.98 |
0.52–1.83 |
0.94 |
0.66 |
0.34–1.29 |
0.23 |
0.71 |
0.36–1.43 |
0.34 |
| Hyperuricemia |
1.75 |
0.92–3.33 |
0.09 |
1.39 |
0.71–2.72 |
0.34 |
1.67 |
0.85–3.30 |
0.14 |
| ECG abnormality |
9.75 |
3.48–27.33 |
<0.001 |
9.52 |
3.31–27.38 |
<0.001 |
8.79 |
3.05–25.32 |
<0.001 |
BMI, body mass index; CI, confidence interval; ECG, electrocardiogram; ECG, abnormality includes one of these conditions; HR, hazard ratio; PQ, prolongation, supraventricular beat, and p wave abnormality. The BMI-quadratic model showed a smaller value for AIC than the BMI-linear model.
The estimated log hazard by BMI for the incidence of AF using the model with a smaller AIC is shown in
Figure 3. BMI showed a clear difference between age categories: a reverse J-shaped association in participants in the age range 30–49 years and a linear association in participants in the age range 50–59 and ≥60 years (Figure 3A), thus representing a J-shaped association with incidence of AF in the whole cohort (Figure 3B).
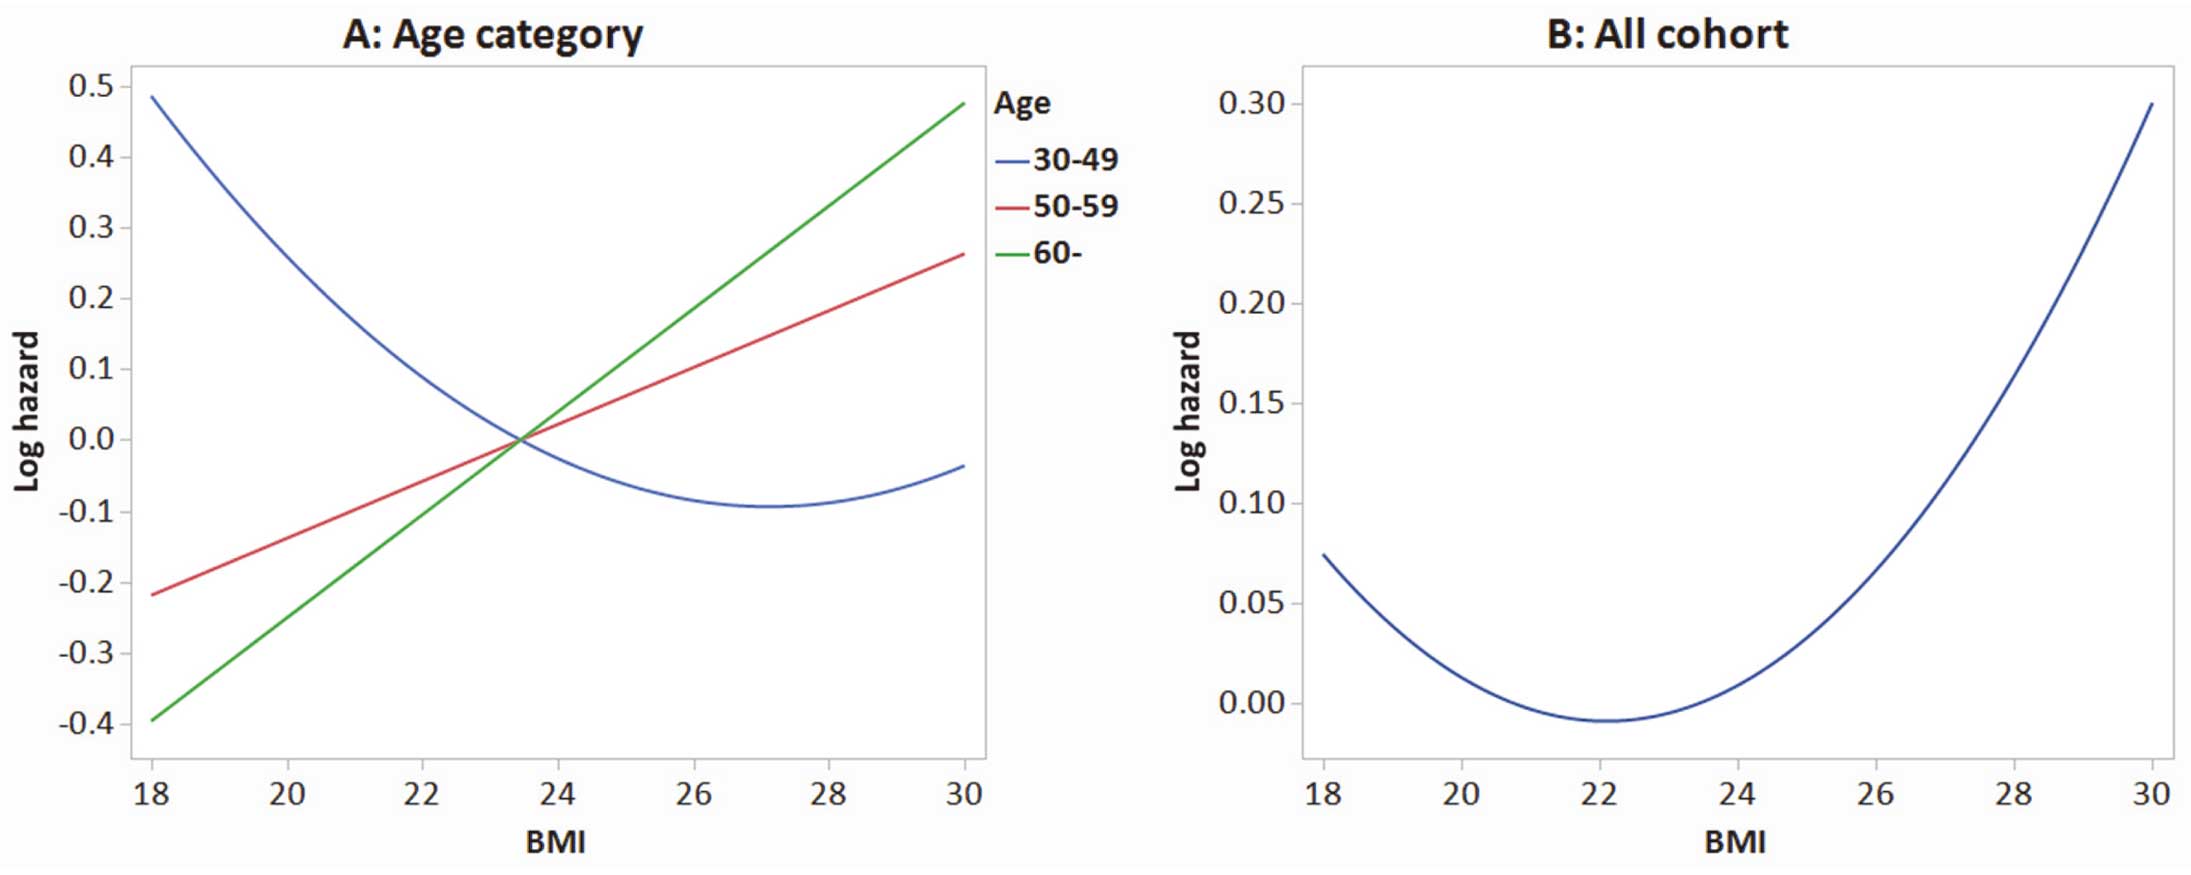
Table 3
shows the clinical characteristics of the study participants in the age group 30–49 years with (n=160) and without ECG abnormality (n=12,897). A lower BMI and waist circumference were evident in participants with ECG abnormality (22.5±3.4 and 80.7±9.3, respectively) than in those without (23.4±3.4 and 82.9±9.3, respectively). In participants with ECG abnormality, a history of heart disease (15.5%) was higher than in participants without ECG abnormality (4.6%, P<0.001), but this pattern was not associated with a family history of heart disease (10.4% and 8.9%, P=0.65).
Table 3.
Clinical Characteristics of the Study Participants by ECG Abnormality in Participants Aged 30–49 Years
| |
ECG abnormality |
| Yes (N=160) |
No (N=12,897) |
P value |
| Age (years) |
39.3±5.5 |
39.1±5.5 |
0.66 |
| BMI (kg/m2) |
22.5±3.4 |
23.4±3.4 |
<0.001 |
| Waist circumference (cm) |
80.7±9.3b |
82.9±9.3a |
0.006 |
| SBP (mmHg) |
122.9±14.3 |
122.6±14.5c |
0.81 |
| DBP (mmHg) |
76.6±10.5 |
75.7±10.8c |
0.30 |
| Total cholesterol (mg/dL) |
198±33e |
200±33d |
0.58 |
| LDL cholesterol (mg/dL) |
117±31g |
122±31f |
0.07 |
| HDL cholesterol (mg/dL) |
64±16i |
62±16h |
0.12 |
| Triglyceride (mg/dL) |
110±96i |
118±95j |
0.26 |
| Fasting glucose (mg/dL) |
95±17l |
95±16k |
0.69 |
| Uric acid (mg/dL) |
6.1±1.3n |
6.1±1.2m |
0.86 |
| Drinking |
| Never |
6 (9.5) |
451 (8.7) |
0.52 |
| Seldom |
11 (17.5) |
1,336 (25.7) |
|
| Sometimes |
27 (42.9) |
1,983 (38.2) |
|
| Daily |
19 (30.2) |
1,422 (27.4) |
|
| Unknown |
97 |
7,705 |
|
| Smoking |
| Never-smoker |
28 (44.4) |
2,420 (46.7) |
0.55 |
| Ex-smoker |
15 (23.8) |
957 (18.5) |
|
| Smoker |
20 (31.7) |
1,804 (34.8) |
|
| Unknown |
97 |
7,716 |
|
| Hypertension |
| No |
11,162 (86.6) |
142 (88.8) |
0.42 |
| Yes |
1,730 (13.4) |
18 (11.3) |
|
| Unknown |
5 |
|
|
| Diabetes mellitus |
| No |
12,522 (97.7) |
150 (96.2) |
0.18 |
| Yes |
296 (2.3) |
6 (3.8) |
|
| Unknown |
79 |
4 |
|
| Dyslipidemia |
| No |
7,949 (61.9) |
105 (67.3) |
0.16 |
| Yes |
4,903 (38.1) |
51 (32.7) |
|
| Unknown |
45 |
4 |
|
| Hyperuricemia |
| No |
9,856 (78.8) |
113 (75.3) |
0.31 |
| Yes |
2,659 (21.2) |
37 (24.7) |
|
| Unknown |
382 |
10 |
|
| History of myocardial infarction and/or angina |
| No |
3 (100.0) |
266 (98.2) |
1.00 |
| Yes |
0 (0) |
5 (1.8) |
|
| Unknown |
157 |
12,626 |
|
| History of stroke |
| No |
5 (83.3) |
666 (97.1) |
0.17 |
| Yes |
1 (16.7) |
20 (2.9) |
|
| Unknown |
154 |
12,211 |
|
| History of heart disease |
| No |
60 (84.5) |
4,094 (95.4) |
<0.001 |
| Yes |
11 (15.5) |
196 (4.6) |
|
| Unknown |
89 |
8,607 |
|
| Family history of heart disease |
| No |
69 (89.6) |
5,325 (91.1) |
0.65 |
| Yes |
8 (10.4) |
520 (8.9) |
|
| Unknown |
83 |
7,052 |
|
ECG, electrocardiogram. Other abbreviations as in Table 1. Data are presented as mean±SD for the continuous variables and N (%) for the categorical variables. P value is for the comparison between the groups by using a chi-squared test, Fisher’s exact test, or a t-test. Numbers of missing values: na=2,465; nb=23; nc=6; nd=2,239; ne=31; nf=2,323; ng=22; nh=73; ni=5; nj=87; nk=127; nl=4; nm=598; nn=13 otherwise there were no missing values. Drinking and smoking status were only available for those participants who had their first visit after April 2013.
When the interaction term between the BMI-linear term and ECG abnormality was added to the BMI-quadratic model in the subgroup of participants aged 30–49 years, a reverse J-shaped association between BMI and incident AF remained in participants with ECG abnormality, and such a paradoxical association disappeared in those participants without ECG abnormality (Figure 4). Such a paradoxical association was not found in those participants with ECG abnormality for both subgroups aged 50–59 and ≥60 years.
Discussion
To the best of our knowledge, the present study is the first large cohort study to investigate the shape of the association between BMI and AF incidence in young men, and to clarify age-group-based differences regarding this association. Our principal finding was that AF incidence displays a reverse J-shaped relationship with BMI in young men, with a linear association present in those age ≥50 years. Among young men, it was revealed that age, BMI and ECG abnormality, such as PQ prolongation, supraventricular beat, and p wave abnormality, were significantly associated with AF risk.
J-Shaped Association Between BMI and AF
Strong associations between obesity (defined as BMI ≥30 kg/m2) and AF have been consistently demonstrated, mostly from Western populations.2,5
In Japan, high BMI has been associated with a risk of incident AF, and the effect of BMI was greater in elderly men than in non-elderly men, although East Asians, including Japanese, tend to have lower BMI than Westerners.4
Of note, BMI (whether alone or adjusted for covariates) is inversely related to mortality, CVD death, stroke death, and many specific cancers.14
Moreover, BMI has a J- or U-shaped relationship with mortality among middle-aged and older adults; for example, mortality rates increase sharply at BMI values <18.5 and >30 kg/m2.15–17
The elevated mortality rate observed with lower BMI values could be related to the effects of unmeasured confounding variables, particularly preexisting disease.15–21
In our study, the BMI-incident AF relationship was J-shaped in all cohorts, and a clear difference between age categories was evident. A linear association was detected in participants in both the age 50–59 and ≥60 years groups, whereas a reverse J-shaped association was seen in participants in the age range 30–49 years (young men). Given the interaction term between BMI and ECG abnormality, a reverse J-shaped association between BMI and incident AF was shown in participants with ECG abnormality, but such a paradoxical association was not observed in those with ECG abnormality in both the 50–59 and ≥60 years subgroups. Thus, the effect of atrial structural or electrical abnormalities, which manifests as an ‘ECG abnormality’ for the purposes of the present study, played an important role in AF incidence in leaner young men aged 30–49 years. Of note, the average BMI of Japanese people is generally lower than that of Western countries. The same tendency is also observed in each age group (Supplementary Figure). The paradoxical relationship between BMI and AF incidence seen in the young men is evident from our cohort study, with many subjects having low BMI.
Characteristics of Young Men With AF
Many patients with AF are increasingly diagnosed with their first AF episode at younger ages; however, the number of young patients is low, and data on incident AF are scarce.22
In contrast to older patients, in whom fibrosis, atrial dilation, and oxidative stress are the known key pathogenic mechanisms,23–26
the pathophysiology of AF in younger patients can be diverse. Causes of AF in the young include ion-channel disease, cardiomyopathy, and genetic factors;27–30
therefore, atrial abnormalities detected on an ECG could be the initial manifestation of clinically detectable AF. However, it is unclear whether our cohort participants had any comorbidities such as atrial structural or electrical changes in their heart that could only be demonstrated with detailed investigations.
In obese young men, weight-loss programs and programs to increase physical activity, exercise, and cardiorespiratory fitness (CRF) can reduce recurrences of AF in patients with established AF, and higher levels of CRF are apparently associated with the primary prevention of AF.31
In leaner young men, it has not been reported that such programs may not be as effective in preventing AF as in obese individuals, although exercising is generally good for maintaining their health. Therefore, at the very least, it is important to acknowledge that simple evidence of ‘ECG abnormality’ may be the initial manifestation of clinically detectable AF in the long term, even for leaner young men.
Study Limitations
The present study has some limitations. First, there were missing data on lifestyle factors (e.g., drinking and smoking status were only available among those who had a first visit after April 2013), concomitant medication status, and a history or family history of heart disease, and therefore, we could not include these factors as possible confounding factors in the analyses. Second, ECG abnormalities were defined automatically using the Minnesota code classification system, such as supraventricular beat (8-1-1, 8-1-3, 8-4-2, 8-9-1-1), PQ prolongation (6-3) and p-wave abnormality (9-3-1, 9-3-2), and those lists of codes are provided for reference purposes only and may not be all inclusive. Third, the manner and frequency of evaluation of AF during the follow-up period may lead to underestimation of incident AF, and the incidence of AF appears lower in this study than in studies from Western countries.32,33
Finally, due to a few AF cases in women, the data were not robust enough to be compared with men, so we decided only use data from men to ensure data reliability, and this group might not be representative of the general population.
Conclusions
AF incidence displays a reverse J-shaped relationship with BMI in young men, but a liner association was present in those aged ≥50 years. The paradoxical relationship seen in young men may only reflect atrial electrical or structural abnormalities.
Author Contributions
K.S. and S.M. contributed to the conception and design of the work. M.K., T.Y. and H.N. contributed to the acquisition and interpretation of data for the work. M.N. and S.T. contributed to the analysis of data for the work. G.Y.H.L. contributed to the interpretation of data for the work. K.S. drafted the manuscript. The other authors critically revised the manuscript. All authors gave final approval and agreed to be accountable for all aspects of the work ensuring integrity and accuracy.
Ethics Approval and Consent to Participate
All participants were informed about the study and provided written informed consent for study participation. The study adhered to the Declaration of Helsinki and ethics approval was obtained from the Institutional Review Board of Kyoto Prefectural University of Medicine.
Sources of Funding
This research received no specific grant from any funding agency in the public, commercial, or not-for-profit sectors.
Disclosures
K.S. is affiliated with an endowed department sponsored by Japan Lifeline and Biotronik.
G.Y.H.L. is a Consultant for Bayer/Janssen, BMS/Pfizer, Medtronic, Boehringer Ingelheim, Novartis, Verseon and Daiichi-Sankyo and a speaker for BMS/Pfizer, Medtronic, Boehringer Ingelheim, and Daiichi-Sankyo. No fees are directly received personally.
The other authors declare that there are no conflicts of interest.
IRB Information
The present study was approved by the institutional Clinical Research Review Board of Kyoto Prefectural University of Medicine (approval no.: ERB-C-1512).
Data Availability
The deidentified participant data will not be shared.
Supplementary Files
Please find supplementary file(s);
http://dx.doi.org/10.1253/circj.CJ-20-0864
References
- 1.
Frost L, Hune LJ, Vestergaard P. Overweight and obesity as risk factors for atrial fibrillation or flutter: The Danish Diet, Cancer, and Health Study. Am J Med 2005; 118: 489–495.
- 2.
Wong CX, Sullivan T, Sun MT, Mahajan R, Pathak RK, Middeldorp M, et al. Obesity and the risk of incident, post-operative, and post-ablation atrial fibrillation: A meta-analysis of 626,603 individuals in 51 studies. JACC Clin Electrophysiol 2015; 1: 139–152.
- 3.
Allan V, Honarbakhsh S, Casas JP, Wallace J, Hunter R, Schilling R, et al. Are cardiovascular risk factors also associated with the incidence of atrial fibrillation?: A systematic review and field synopsis of 23 factors in 32 population-based cohorts of 20 million participants. Thromb Haemost 2017; 117: 837–850.
- 4.
Senoo K, Nakata M, Teramukai S, Yamamoto T, Nishimura H, Matoba S. Age-specific associations between body mass index and the incidence of atrial fibrillation in Japanese men. Circ Rep 2020; 2: 466–470.
- 5.
Wang TJ, Parise H, Levy D, D’Agostino RB, Wolf PA, Vasan RS, et al. Obesity and the risk of new-onset atrial fibrillation. JAMA 2004; 292: 2471–2477.
- 6.
Murphy NF, MacIntyre K, Stewart S, Hart CL, Hole D, McMurray JJV, et al. Long-term cardiovascular consequences of obesity: 20-year follow-up of more than 15 000 middle-aged men and women (the Renfrew-Paisley study). Eur Heart J 2006; 27: 96–106.
- 7.
Gami AS, Hodge DO, Herges RM, Olson EJ, Nykodym J, Kara T, et al. Obstructive sleep apnea, obesity, and the risk of incident atrial fibrillation. J Am Coll Cardiol 2007; 49: 565–571.
- 8.
Rosengren A, Hauptman PJ, Lappas G, Olsson L, Wilhelmsen L, Swedberg K, et al. Big men and atrial fibrillation: Effects of body size and weight gain on risk of atrial fibrillation in men. Eur Heart J 2009; 30: 1113–1120.
- 9.
Schnabel RB, Aspelund T, Li G, Sullivan LM, Dicey AS, Harris TB, et al. Validation of an atrial fibrillation risk algorithm in whites and African Americans. Arch Intern Med 2010; 170: 1909–1917.
- 10.
Smith JG, Platonov PG, Hedblad B, Engstroöm G, Melander O. Atrial fibrillation in the Malmo Diet and Cancer study: A study of occurrence, risk factors and diagnostic validity. Eur J Epidemiol 2010; 25: 95–102.
- 11.
Tedrow UB, Conen D, Ridker PM, Cook NR, Koplan BA, Manson JE, et al. The long- and short-term impact of elevated body mass index on the risk of new atrial fibrillation the WHS (women’s health study). J Am Coll Cardiol 2010; 55: 2319–2327.
- 12.
WHO Expert Consultation. Appropriate body-mass index for Asian populations and its implications for policy and intervention strategies. Lancet (London, England) 2004; 363: 157–163.
- 13.
Royston P, Parmar MK. Flexible parametric proportional-hazards and proportional-odds models for censored survival data, with application to prognostic modelling and estimation of treatment effects. Stat Med 2002; 21: 2175–2197.
- 14.
Whitlock G, Lewington S, Sherliker P, Clarke R, Emberson J, Halsey J, et al. Body-mass index and cause-specific mortality in 900 000 adults: Collaborative analyses of 57 prospective studies. Lancet (London, England) 2009; 373: 1083–1096.
- 15.
Yuan JM, Ross RK, Gao YT, Yu MC. Body weight and mortality: A prospective evaluation in a cohort of middle-aged men in Shanghai, China. Int J Epidemiol 1998; 27: 824–832.
- 16.
Orpana HM, Berthelot JM, Kaplan MS, Feeny DH, McFarland B, Ross NA. BMI and mortality: Results from a national longitudinal study of Canadian adults. Obesity (Silver Spring) 2010; 18: 214–218.
- 17.
Pan WH, Yeh WT, Chen HJ, Chuang SY, Chang HY, Chen L, et al. The U-shaped relationship between BMI and all-cause mortality contrasts with a progressive increase in medical expenditure: A prospective cohort study. Asia Pac J Clin Nutr 2012; 21: 577–587.
- 18.
Jee SH, Sull JW, Park J, Lee SY, Ohrr H, Guallar E, et al. Body-mass index and mortality in Korean men and women. N Engl J Med 2006; 355: 779–787.
- 19.
Tamakoshi A, Yatsuya H, Lin Y, Tamakoshi K, Kondo T, Suzuki S, et al. BMI and all-cause mortality among Japanese older adults: Findings from the Japan collaborative cohort study. Obesity (Silver Spring) 2010; 18: 362–369.
- 20.
Heymsfield SB, Cefalu WT. Does body mass index adequately convey a patient’s mortality risk? JAMA 2013; 309: 87–88.
- 21.
Chung WS, Ho FM, Cheng NC, Lee MC, Yeh CJ. BMI and all-cause mortality among middle-aged and older adults in Taiwan: A population-based cohort study. Public Health Nutr 2015; 18: 1839–1846.
- 22.
Rutzen-Lopez H, Khanna V, Reynolds MR. Atrial fibrillation: Epidemiology, prognosis and therapy. Minerva Med 2011; 102: 187–207.
- 23.
Hayashi H, Wang C, Miyauchi Y, Omichi C, Pak HN, Zhou S, et al. Aging-related increase to inducible atrial fibrillation in the rat model. J Cardiovasc Electrophysiol 2002; 13: 801–808.
- 24.
Lin PH, Lee SH, Su CP, Wei YH. Oxidative damage to mitochondrial DNA in atrial muscle of patients with atrial fibrillation. Free Radic Biol Med 2003; 35: 1310–1318.
- 25.
Pan NH, Tsao HM, Chang NC, Chen YJ, Chen SA. Aging dilates atrium and pulmonary veins: Implications for the genesis of atrial fibrillation. Chest 2008; 133: 190–196.
- 26.
Verheule S, Tuyls E, van Hunnik A, Kuiper M, Schotten U, Allessie M. Fibrillatory conduction in the atrial free walls of goats in persistent and permanent atrial fibrillation. Circ Arrhythm Electrophysiol 2010; 3: 590–599.
- 27.
Maron BJ, Casey SA, Poliac LC, Gohman TE, Almquist AK, Aeppli DM. Clinical course of hypertrophic cardiomyopathy in a regional United States cohort. JAMA 1999; 281: 650–655.
- 28.
Mestroni L. Genomic medicine and atrial fibrillation. J Am Coll Cardiol 2003; 41: 2193–2196.
- 29.
Fatkin D, Otway R, Vandenberg JI. Genes and atrial fibrillation: A new look at an old problem. Circulation 2007; 116: 782–792.
- 30.
Verma A, Macle L, Cox J, Skanes AC, CCS Atrial Fibrillation Guidelines Committee. Canadian Cardiovascular Society atrial fibrillation guidelines 2010: Catheter ablation for atrial fibrillation/atrial flutter. Can J Cardiol 2011; 27: 60–66.
- 31.
Lavie CJ, Pandey A, Lau DH, Alpert MA, Sanders P. Obesity and atrial fibrillation prevalence, pathogenesis, and prognosis: Effects of weight loss and exercise. J Am Coll Cardiol 2017; 70: 2022–2035.
- 32.
Miyasaka Y, Barnes ME, Gersh BJ, Cha SS, Bailey KR, Abhayaratna WP, et al. Secular trends in incidence of atrial fibrillation in Olmsted County, Minnesota, 1980 to 2000, and implications on the projections for future prevalence. Circulation 2006; 114: 119–125.
- 33.
Hobbs FD, Fitzmaurice DA, Mant J, Murray E, Jowett S, Bryan S, et al. A randomised controlled trial and cost-effectiveness study of systematic screening (targeted and total population screening) versus routine practice for the detection of atrial fibrillation in people aged 65 and over: The SAFE study. Health Technol Assess 2005; 9: iii–iv, ix–x, 1–74.

