Abstract
Background:
The effect of sex on mortality is controversial; furthermore, sex differences in left ventricular (LV) remodeling after transcatheter aortic valve implantation (TAVI) remain unknown.
Methods and Results:
This study included 2,588 patients (1,793 [69.3%] female) enrolled in the Optimized CathEter vAlvular iNtervention (OCEAN)-TAVI Japanese multicenter registry between October 2013 and May 2017. We retrospectively analyzed the effect of sex on mortality, and evaluated changes in the LV mass index (LVMI) after TAVI. Female sex was significantly associated with lower all-cause and cardiovascular mortality (log-rank P<0.001 for both). Multivariate analysis showed that female sex was independently associated with lower cumulative long-term mortality (hazard ratio 0.615; 95% confidence interval 0.512–0.738; P<0.001). Regression in the LVMI was observed in both sexes, and there was no significant difference in the percentage LVMI regression from baseline to 1 year after TAVI between women and men. Women had a survival advantage compared with men among patients with LVMI regression at 1 year, but not among patients with no LVMI regression.
Conclusions:
We found that female sex is associated with better survival outcomes after TAVI in a large Japanese registry. Although LVMI regression was observed in women and men after TAVI, post-procedural LV mass regression may be related to the sex differences in mortality.
Chronic left ventricular (LV) pressure overload caused by aortic stenosis (AS) leads to a hypertrophic response from the myocardium. An accurate LV hypertrophy (LVH) assessment plays an important role in evaluating the prognosis of severe AS patients.1
Moreover, LVH, as determined by LV mass or the LV mass index (LVMI), is an independent predictor of adverse cardiovascular events in patients with AS.2
The magnitude of LV hypertrophic remodeling is affected not only by AS, but also by sex.3
However, there is a lack of data regarding the effects sex differences on LVMI in severe AS.
Editorial p 989
Relief of mechanical obstruction for severe AS by surgical aortic valve replacement (SAVR) leads to hemodynamic improvement and a substantial decrease in LV mass, corresponding to a decrease in cardiovascular risk.4–6
Regression of LV mass occurs early after SAVR and continues up to 10 years after surgery. LV responses according to sex after SAVR have been reported, with studies indicating that a lower magnitude of LV fibrosis may be responsible or that there was exaggerated LV remodeling after SAVR in women.7,8
Recently transcatheter aortic valve implantation (TAVI) has become the standard treatment for patients with AS at high surgical risk. Several observational studies have indicated improved survival in women undergoing TAVI than in men.9–12
However, given the high rate of procedural complications in women, the reasons for this finding are not fully understood.
Therefore, we hypothesized that differences in LVMI regression according to sex difference may affect clinical outcomes after TAVI. Previous studies in small populations showed that women had a rapid LVMI regression compared with men after TAVI.13,14
However, to date, there have been no studies about sex differences in LV mass regression after TAVI in a large population. Hence, sex-related differences in the release of pressure overload after TAVI and post-procedural LV responses remain unclear.
In this study, we sought to evaluate sex-related differences in clinical outcomes and changes in LVMI in patients after TAVI. In addition, we evaluated sex-related differences in clinical outcomes among patients with and without LVMI regression.
Methods
Study Population and Design
The Optimized CathEter vAlvular iNtervention (OCEAN)-TAVI Registry is an ongoing prospective multicenter registry that was initiated to observe and document the procedural results and post-procedural clinical outcomes of TAVI. The OCEAN-TAVI registry is independent of any industry influence.
Between October 2013 and May 2017, 2,588 patients at 13 Japanese institutions and Kishiwada Tokushukai Hospital were prospectively included in the OCEAN-TAVI Registry. Patients with severe AS underwent TAVI with an Edwards Sapien XTTM
and Sapien3TM
balloon-expandable prosthesis (Edwards Lifesciences, Irvine, CA, USA) or the Medtronic (Minneapolis, MN, USA) CoreValveTM
Revalving System and Evolut R self-expandable prosthesis. Patients for whom TAVI was deemed the best treatment option were selected based on clinical consensus by a multidisciplinary team consisting of cardiac surgeons, interventional cardiologists, anesthetists, and imaging specialists.
All patients provided written informed consent to take part in the study. This paper reports on experiments on human subjects and was performed in accordance with the Declaration of Helsinki. This trial is registered with the University Hospital Medical Information Network (UMIN; ID: UMIN000020423).
The TAVI procedure was performed using conventional techniques via the transfemoral, transiliac, transapical, trans-subclavian, or transaortic approaches depending on the experience at each participating center. Prosthesis size was determined based on preprocedural echocardiography and multidetector computed tomography (MDCT) findings. The implanted valves included the 20-, 23-, 26, and 29-mm SAPIEN XT and SAPIEN3 devices (Edwards Lifesciences) and the 23-, 26- and 29-mm CoreValve and Evolut R devices (Medtronic).
Echocardiographic Assessment
All subjects underwent standard 2-dimensional B-mode and Doppler transthoracic echocardiography. All measurements were performed in accordance with the recommendations of the American Society of Echocardiography.15,16
Echocardiographic parameters included LV internal diastolic dimension (LVDd), interventricular septal wall thickness (IVS), posterior wall thickness (PWT), ejection fraction (EF), aortic valve area (AVA), peak velocity of transaortic valve flow, and stroke volume. LV mass (g) was calculated using the following formula recommended by the American Society of Echocardiography:15,16
LV mass = 0.8 × (1.04 × [LVDd + IVS + PWT]3 − LVDd3) + 0.6
LVMI was calculated for each patient as follows:
LVMI = LV mass / BSA
where BSA is body surface area (m2). LVH was defined as LVMI >95 g/m2
in women and >115 g/m2
in men.15,16
Relative wall thickness (RWT) was calculated using the following formula:
RWT = (2 × PWT) / LV end-diastolic diameter
RWT was used to categorize LVH patterns as normal (RWT <0.42 and LVMI <95 g/m2
for women or <115 g/m2
for men), concentric hypertrophy (RWT >0.42 and LVMI >95 g/m2
for women or >115 g/m2
for men), eccentric hypertrophy (RWT <0.42 and LVMI >95 g/m2
for women or >115 g/m2
for men), or concentric remodeling (RWT >0.42 and LVMI <95 g/m2
for women or <115 g/m2
for men). Based on the protocol, echocardiographic examinations were performed before TAVI, after TAVI (within 7 days), and then again 1 and 2 years after TAVI.
Follow-up and Endpoints
Study follow-up was completed via outpatient visits or telephone interviews at 30 days, 1 year, and then yearly after the procedure. The primary endpoints of this study were all-cause mortality and cardiovascular mortality at last follow-up. The secondary endpoint was regression of LVMI at the 1-year follow-up. Procedural outcomes were compared between women and men according to the Valve Academic Research Consortium-2 criteria.17
Prosthesis-patient mismatch (PPM) was assessed using the indexed effective orifice area of the prosthetic valve at post-procedural echocardiography, and was defined as an effective orifice area <0.85 cm2/m2.
Statistical Analysis
Quantitative variables are expressed as the mean±SD or median and interquartile range (IQR), as appropriate. Quantitative variables were compared using an unpaired Student’s t-test or the Wilcoxon rank-sum test. Qualitative variables were compared using the Chi-squared test or Fisher’s exact test. The exact Wilcoxon’s test was used for pairwise comparisons. Absolute and percentage changes in LVMI were calculated using paired data at baseline and 1 year, and were compared between women and men. The cumulative probability of all-cause mortality and cardiovascular mortality during follow-up were estimated using the Kaplan-Meier method. Cox proportional hazard regression analysis was used to assess the predictors of all-cause mortality. The variables were included in the multivariate model only if the variable was significant (P<0.05) in the univariate Cox model. The final selection of independent predictors was performed using a backward-stepping algorithm (criterion for retention, P<0.1). Statistical significance was defined as 2-tailed P<0.05. Data were analyzed using SPSS version 26.0 (IBM Corp., Chicago, IL, USA).
Results
Sex Differences in Baseline Characteristics
Between October 2013 and May 2017, 2,588 patients underwent TAVI at 14 institutions in Japan. The mean patient age was 84.4±5.2 years, and the mean Society of Thoracic Surgeons (STS) score was 8.2±6.9%. Of the 2,588 patients, 1,793 were women (69.3%) and 795 were men (30.7%). The baseline patient characteristics of the women and men are summarized in
Table 1. Women were significantly older and had smaller body size, whereas men had frequent comorbidities, such as diabetes, peripheral artery disease, previous coronary artery bypass surgery, and chronic obstructive pulmonary disease. The transfemoral approach was more commonly used in women than in men (85.1% vs. 80.6%, respectively; P=0.006). Echocardiography indicated a smaller AVA, higher peak velocities, and higher pressure gradients in women than in men. Although LV mass was higher in men, the mean LVMI (LV mass/BSA) was not significantly different between women and men (130.0±37.2 vs. 131.0±35.0 g/m2, respectively; P=0.509). The ratio of LVH at baseline was significantly higher in women than in men (84.4% vs. 64.4%, respectively; P<0.001).
Table 1.
Baseline Characteristics
| |
Overall
(n=2,588) |
Men
(n=795) |
Women
(n=1,793) |
P value |
| Baseline clinical characteristics |
| Age (years) |
84.4±5.2 |
83.6±5.5 |
84.7±5.0 |
<0.001 |
| Height (cm) |
150.0±9.1 |
159.6±6.6 |
145.8±6.5 |
<0.001 |
| Body weight (kg) |
50.1±10.3 |
57.8±9.7 |
46.8±8.6 |
<0.001 |
| Body mass index (kg/m2) |
22.2±3.6 |
22.7±3.3 |
22.0±3.7 |
<0.001 |
| BSA (m2) |
1.43±0.17 |
1.59±0.14 |
1.36±0.13 |
<0.001 |
| NYHA Class III or IV |
1,321 (51.0) |
427 (45.3) |
953 (53.2) |
0.001 |
| Peripheral artery disease |
377 (14.6) |
143 (18.0) |
234 (13.1) |
0.001 |
| Smoking |
524 (20.2) |
385 (48.4) |
139 (7.8) |
<0.001 |
| Previous stroke |
301 (11.6) |
119 (15.0) |
182 (10.2) |
0.001 |
| Previous coronary artery bypass surgery |
169 (6.5) |
81 (10.2) |
88 (4.9) |
0.001 |
| Previous pacemaker implantation |
166 (6.4) |
55 (6.9) |
111 (6.2) |
0.487 |
| Atrial fibrillation |
549 (21.2) |
186 (23.4) |
363 (20.2) |
0.076 |
| Diabetes |
555 (21.4) |
221 (27.8) |
334 (18.6) |
<0.001 |
| Hypertension |
1,990 (76.9) |
623 (78.4) |
1,367 (76.2) |
0.245 |
| Dyslipidemia |
1,114 (43.0) |
341 (42.9) |
773 (43.1) |
0.931 |
| COPD |
385 (14.9) |
193 (24.3) |
192 (10.7) |
<0.001 |
| CKDA |
1,552 (60.0) |
457 (57.5) |
1,095 (61.1) |
0.090 |
| EuroScore II (%) |
5.5±6.5 |
5.5±7.3 |
5.5±6.1 |
0.891 |
| STS score (%) |
8.2±6.9 |
8.5±8.7 |
8.1±5.9 |
0.226 |
| Valve type |
|
|
|
0.222 |
| SAPIEN-XT |
1,399 (54.1) |
422 (53.1) |
977 (54.5) |
|
| SAPIEN3 |
846 (32.7) |
278 (35.0) |
568 (31.7) |
|
| CoreValve |
195 (7.5) |
50 (6.3) |
145 (8.1) |
|
| Evolut R |
148 (5.7) |
45 (5.7) |
103 (5.7) |
|
| Approach route |
|
|
|
0.006 |
| Transfemoral |
2,167 (83.7) |
641 (80.6) |
1,526 (85.1) |
|
| Non-transfemoral |
421 (16.3) |
154 (19.4) |
267 (14.9) |
|
| Echocardiography |
| LV mass (g) |
186.1±55.8 |
207.9±57.3 |
176.4±52.3 |
<0.001 |
| LVMI (g/m2) |
130.3±36.6 |
131.0±35.0 |
130.0±37.2 |
0.509 |
| LVH |
2,025 (78.2) |
512 (64.4) |
1,513 (84.4) |
<0.001 |
| RWT |
0.52±0.12 |
0.49±0.11 |
0.53±0.12 |
<0.001 |
| LVEF (%) |
59.2±12.7 |
57.1±13.4 |
60.2±12.2 |
<0.001 |
| Aortic valve area (cm2) |
0.63±0.17 |
0.69±0.17 |
0.60±0.16 |
<0.001 |
| Indexed aortic valve area (cm2/m2) |
0.44±0.12 |
0.44±0.11 |
0.45±0.12 |
<0.001 |
| Peak velocity (m/s) |
4.57±0.78 |
4.44±0.73 |
4.63±0.80 |
<0.001 |
| Mean gradient (mmHg) |
50.6±18.2 |
47.4±16.4 |
52.0±18.8 |
<0.001 |
| Peak gradient (mmHg) |
86.0±29.4 |
81.0±26.5 |
88.2±30.4 |
<0.001 |
| LVDd (mm) |
44.2±6.4 |
47.2±6.5 |
42.9±5.9 |
<0.001 |
| LVDs (mm) |
29.3±7.3 |
32.2±8.1 |
28.1±6.5 |
<0.001 |
| IVS (mm) |
11.8±2.0 |
11.9±1.9 |
11.7±2.0 |
0.084 |
| PWd (mm) |
11.3±1.8 |
11.4±1.8 |
11.3±1.8 |
0.06 |
| LV remodeling pattern |
|
|
|
<0.001 |
| Normal pattern (%) |
4.5 |
8.7 |
2.6 |
|
| Eccentric hypertrophy (%) |
13.1 |
16.1 |
11.7 |
|
| Concentric remodeling (%) |
17.3 |
26.9 |
13 |
|
| Concentric hypertrophy (%) |
65.2 |
48.3 |
72.7 |
|
Unless indicated otherwise, data are given as the mean±SD or n (%). ACKD was defined as an eGFR <60 mL/min/1.73 m2. BSA, body surface area; CKD, chronic kidney disease; COPD, chronic obstructive pulmonary disease; eGFR, estimated glomerular filtration rate; IVS, interventricular septal thickness; LV, left venticular; LVDd, LV diastolic diameter; LVDs, LV systolic diameter; LVEF, LV ejection fraction; LVH, LV hypertrophy; LVMI, LV mass index; NYHA, New York Heart Association; PWd, posterior wall thickness; RWT, relative wall thickness; STS, Society of Thoracic Surgeons.
The in-hospital clinical outcomes are summarized in
Table 2. The 30-day all-cause mortality was 1.8% in the overall cohort, and was similar in women and men (1.7% vs. 2.0%, respectively; P=0.548). Women had a significantly higher incidence of major and minor bleeding than men (13.1% vs. 6.0% [P<0.001] and 11.3% vs. 2.9% [P<0.001], respectively). The incidence of stroke and new pacemaker implantation did not differ between women and men. In all, 290 patients with PPM were identified: 207 were women and 83 were men, with no significant difference in the rate of PPM between the sexes (P=0.457).
Table 2.
Short-Term Clinical Outcomes
| |
Overall
(n=2,588) |
Men
(n=795) |
Women
(n=1,793) |
P value |
| 30-day all-cause mortality |
46 (1.8) |
16 (2.0) |
30 (1.7) |
0.548 |
| Myocardial infarction |
19 (0.7) |
8 (1.0) |
11 (0.6) |
0.319 |
| Disabling stroke |
40 (1.5) |
13 (1.6) |
27 (1.5) |
0.863 |
| Transit ischemic attack |
5 (0.2) |
1 (0.1) |
4 (0.2) |
1 |
| Major vascular complication |
113 (4.4) |
31 (3.9) |
82 (4.6) |
0.467 |
| Minor vascular complication |
122 (4.7) |
46 (5.8) |
76 (4.2) |
0.088 |
| Life-threatening bleeding |
129 (5.0) |
30 (3.8) |
99 (5.5) |
0.063 |
| Major bleeding |
282 (10.9) |
48 (6.0) |
234 (13.1) |
<0.001 |
| Minor bleeding |
226 (8.7) |
23 (2.9) |
203 (11.3) |
<0.001 |
| New pacemaker implantation |
211 (8.2) |
56 (7.0) |
155 (8.6) |
0.186 |
| Prosthesis-patient mismatch |
290 (11.5) |
83 (10.7) |
207 (11.8) |
0.457 |
Unless indicated otherwise, data are presented as n (%).
All-cause mortality at 1 year was 9.3% in women and 13.2% in men (P=0.002). Furthermore, cardiovascular mortality at 1 year was significantly lower in women than in men (3.6% vs. 6.3%, respectively; P=0.002). Time-to-event curves for long-term follow-up are shown in
Figure 1. The median follow-up duration was 659 days (IQR 381–859 days). Kaplan-Meier survival curve analysis indicated a significant survival advantage for women compared with men (log-rank, P<0.001;
Figure 1A). Furthermore, the cardiovascular mortality was significantly lower in women during the observation period (log-rank, P<0.001;
Figure 1B).

Multivariate analysis indicated that female sex was a negative independent predictor for cumulative long-term mortality (hazard ratio [HR] 0.615; 95% confidence interval [CI] 0.512–0.738; P<0.001). The other independent predictors of all-cause mortality were baseline New York Heart Association Class III or IV (HR 1.513; 95% CI 1.254–1.825; P<0.001), chronic kidney disease (HR 1.312; 95% CI 1.087–1.582; P=0.005), high STS score (HR 1.027; 95% CI 1.020–1.035; P<0.001), and alternative access approach (HR 1.343; 95% CI 1.075–1.678; P=0.009;
Table 3).
Table 3.
Predictors of All-Cause Mortality
| |
Univariable analysis |
Multivariable analysis |
| HR |
95% CI |
P value |
HR |
95% CI |
P value |
| Age (per 1-year increase) |
1.015 |
0.998–1.033 |
0.086 |
|
|
|
| Female sex |
0.605 |
0.505–0.725 |
<0.001 |
0.615 |
0.512–0.738 |
<0.001 |
| BSA (per 0.1-m2 increase) |
0.878 |
0.520–1.481 |
0.625 |
|
|
|
| NYHA Class III or IV |
1.702 |
1.419–2.040 |
<0.001 |
1.513 |
1.254–1.825 |
<0.001 |
| Diabetes |
1.192 |
0.972–1.463 |
0.092 |
|
|
|
| Hypertension |
0.948 |
0.770–1.165 |
0.61 |
|
|
|
| CKD (eGFR <60 mL/min/1.73 m2) |
1.400 |
1.163–1.685 |
<0.001 |
1.312 |
1.087–1.582 |
0.005 |
| COPD |
1.411 |
1.131–1.761 |
0.002 |
|
|
|
| Previous CABG |
1.367 |
1.000–1.870 |
0.05 |
|
|
|
| Peripheral artery disease |
1.796 |
1.466–2.217 |
<0.001 |
1.243 |
0.982–1.573 |
0.07 |
| Previous stroke |
1.265 |
0.976–1.640 |
0.076 |
|
|
|
| STS mortality score (per 1% increase) |
1.037 |
1.030–1.044 |
<0.001 |
1.027 |
1.020–1.035 |
<0.001 |
| LVEF (per 1% increase) |
0.993 |
0.986–1.000 |
0.052 |
|
|
|
| Alternative access (not transfemoral) |
1.479 |
1.198–1.827 |
<0.001 |
1.343 |
1.075–1.678 |
0.009 |
| Valve type (new vs. old device) |
0.965 |
0.778–1.197 |
0.745 |
|
|
|
| LVMI (per 1-g/m2 increase) |
0.999 |
0.997–1.002 |
0.615 |
|
|
|
CABG, coronary artery bypass grafting; CI, confidence interval; HR, hazard ratio. Other abbreviations as in Table 1.
Table 4
presents sequential changes in the echocardiographic parameters after TAVI. At baseline, mean LVMI was 131.0±35.0 and 130.0±37.2 g/m2
in men and women, respectively. At the 1-year follow-up, mean LVMI in men and women was 114.2±31.3 and 110.6±31.1 g/m2, respectively. LVMI at 1 year was significantly lower in women than in men (P=0.026). The absolute LVMI decreased from before the procedure to 1 year after TAVI in both women and men (−17.5±34.4 vs. −16.8±29.5 g/m2, respectively; P=0.685). There was no significant difference in the percentage change in LVMI between the sexes (−10.3±22.1% vs. −11.0±24.0 % in women and men, respectively; P=0.513;
Table 4; Figure 2A). The percentage of LVH decreased significantly from before the procedure to 1 year in both women (from 84.4% to 67.9%, respectively) and men (from 64.4% to 42.0%, respectively;
Figure 2B). RWT before the procedure and at 1 year was significantly higher in women (0.53±0.12 and 0.50±0.10, respectively) than in men (0.49±0.11 and 0.48±0.10, respectively; P<0.001 for both).
Table 4.
Echocardiographic Data
| |
Males |
Females |
P value (males vs. females) |
Baseline
(n=795) |
After TAVI
(n=773) |
1 year
(n=543) |
2 year
(n=281) |
Baseline
(n=1,793) |
After TAVI
(n=1,760) |
1 year
(n=1,265) |
2 year
(n=739) |
Baseline |
After TAVI |
1 year |
2 year |
| LV mass (g) |
207.9±57.3 |
202.9±55.1 |
182.3±51.0 |
181.5±51.2 |
176.4±52.3 |
170.7±48.2 |
150.7±43.9 |
148.7±43.7 |
<0.001 |
<0.001 |
<0.001 |
<0.001 |
| LVMI (g/m2) |
131.0±35.0 |
127.6±33.0 |
114.2±31.3 |
113.2±30.2 |
130.0±37.2 |
125.8±34.4 |
110.6±31.1 |
108.8±30.5 |
0.509 |
0.218 |
0.026 |
0.042 |
| Change in LVMI |
| Absolute (g/m2) |
– |
−0.9±17.8 |
−16.8±29.5 |
−16.0±27.3 |
– |
−1.3±19.3 |
−17.5±34.4 |
−19.5±35.7 |
– |
0.659 |
0.666 |
0.094 |
| Percentage |
– |
−1.0±19.6 |
−11.0±24.0 |
−11.5±25.2 |
– |
−1.2±18.4 |
−10.3±22.1 |
−11.3±21.8 |
– |
0.788 |
0.513 |
0.861 |
| LVH |
512 (64.4) |
483 (62.6) |
227 (42.0) |
127 (45.2) |
1,513 (84.4) |
1,446 (82.1) |
855 (67.9) |
489 (66.2) |
<0.001 |
<0.001 |
<0.001 |
<0.001 |
| RWT |
0.49±0.11 |
0.49±0.10 |
0.48±0.10 |
0.46±0.09 |
0.53±0.12 |
0.53±0.12 |
0.50±0.10 |
0.49±0.10 |
<0.001 |
<0.001 |
<0.001 |
<0.001 |
| LVEF (%) |
57.1±13.4 |
61.2±13.2 |
62.9±11.2 |
62.1±10.7 |
60.2±12.2 |
64.2±11.1 |
66.1±9.7 |
66.6±8.9 |
<0.001 |
<0.001 |
<0.001 |
<0.001 |
| Aortic valve area (cm2) |
0.69±0.17 |
1.90±0.50 |
1.86±0.46 |
1.79±0.44 |
0.60±0.16 |
1.58±0.38 |
1.53±0.39 |
1.55±0.39 |
<0.001 |
<0.001 |
<0.001 |
<0.001 |
| Indexed aortic valve area (cm2/m2) |
0.44±0.11 |
1.20±0.39 |
1.17±0.28 |
1.11±0.29 |
0.45±0.12 |
1.17±0.29 |
1.11±0.29 |
1.12±0.28 |
<0.001 |
<0.001 |
0.001 |
0.977 |
| Peak velocity (m/s) |
4.44±0.73 |
2.15±0.42 |
2.17±0.40 |
2.15±0.41 |
4.63±0.80 |
2.28±0.46 |
2.32±0.50 |
2.28±0.49 |
<0.001 |
<0.001 |
<0.001 |
<0.001 |
| Mean gradient (mmHg) |
47.4±16.4 |
9.7±3.9 |
9.8±4.0 |
9.7±4.0 |
52.0±18.8 |
11.3±4.8 |
11.6±5.4 |
11.2±5.7 |
<0.001 |
<0.001 |
<0.001 |
<0.001 |
| Peak gradient (mmHg) |
81.0±26.5 |
19.1±7.3 |
19.4±7.3 |
19.2±7.5 |
88.2±30.4 |
21.6±8.6 |
22.6±10.1 |
21.8±10.2 |
<0.001 |
<0.001 |
<0.001 |
<0.001 |
| LVDd (mm) |
47.2±6.5 |
47.1±6.0 |
45.7±5.7 |
46.1±5.8 |
42.9±5.9 |
42.7±5.5 |
41.8±5.3 |
41.9±5.3 |
<0.001 |
<0.001 |
<0.001 |
<0.001 |
| LVDs (mm) |
32.2±8.1 |
31.4±7.4 |
29.8±6.3 |
30.6±6.3 |
28.1±6.5 |
27.5±5.7 |
26.4±5.0 |
26.4±5.0 |
<0.001 |
<0.001 |
<0.001 |
<0.001 |
| IVS (mm) |
11.9±1.9 |
11.7±1.9 |
11.3±1.7 |
11.1±1.8 |
11.7±2.0 |
11.5±1.9 |
10.9±1.9 |
10.7±1.7 |
0.084 |
0.029 |
<0.001 |
0.001 |
| PWd (mm) |
11.4±1.8 |
11.2±1.8 |
10.7±1.7 |
10.5±1.7 |
11.3±1.8 |
11.1±1.8 |
10.3±1.6 |
10.2±1.6 |
0.06 |
0.049 |
<0.001 |
0.001 |
Unless indicated otherwise, data are presented as the mean±SD or n (%). TAVI, transcatheter aortic valve implantation. Other abbreviations as in Table 1.

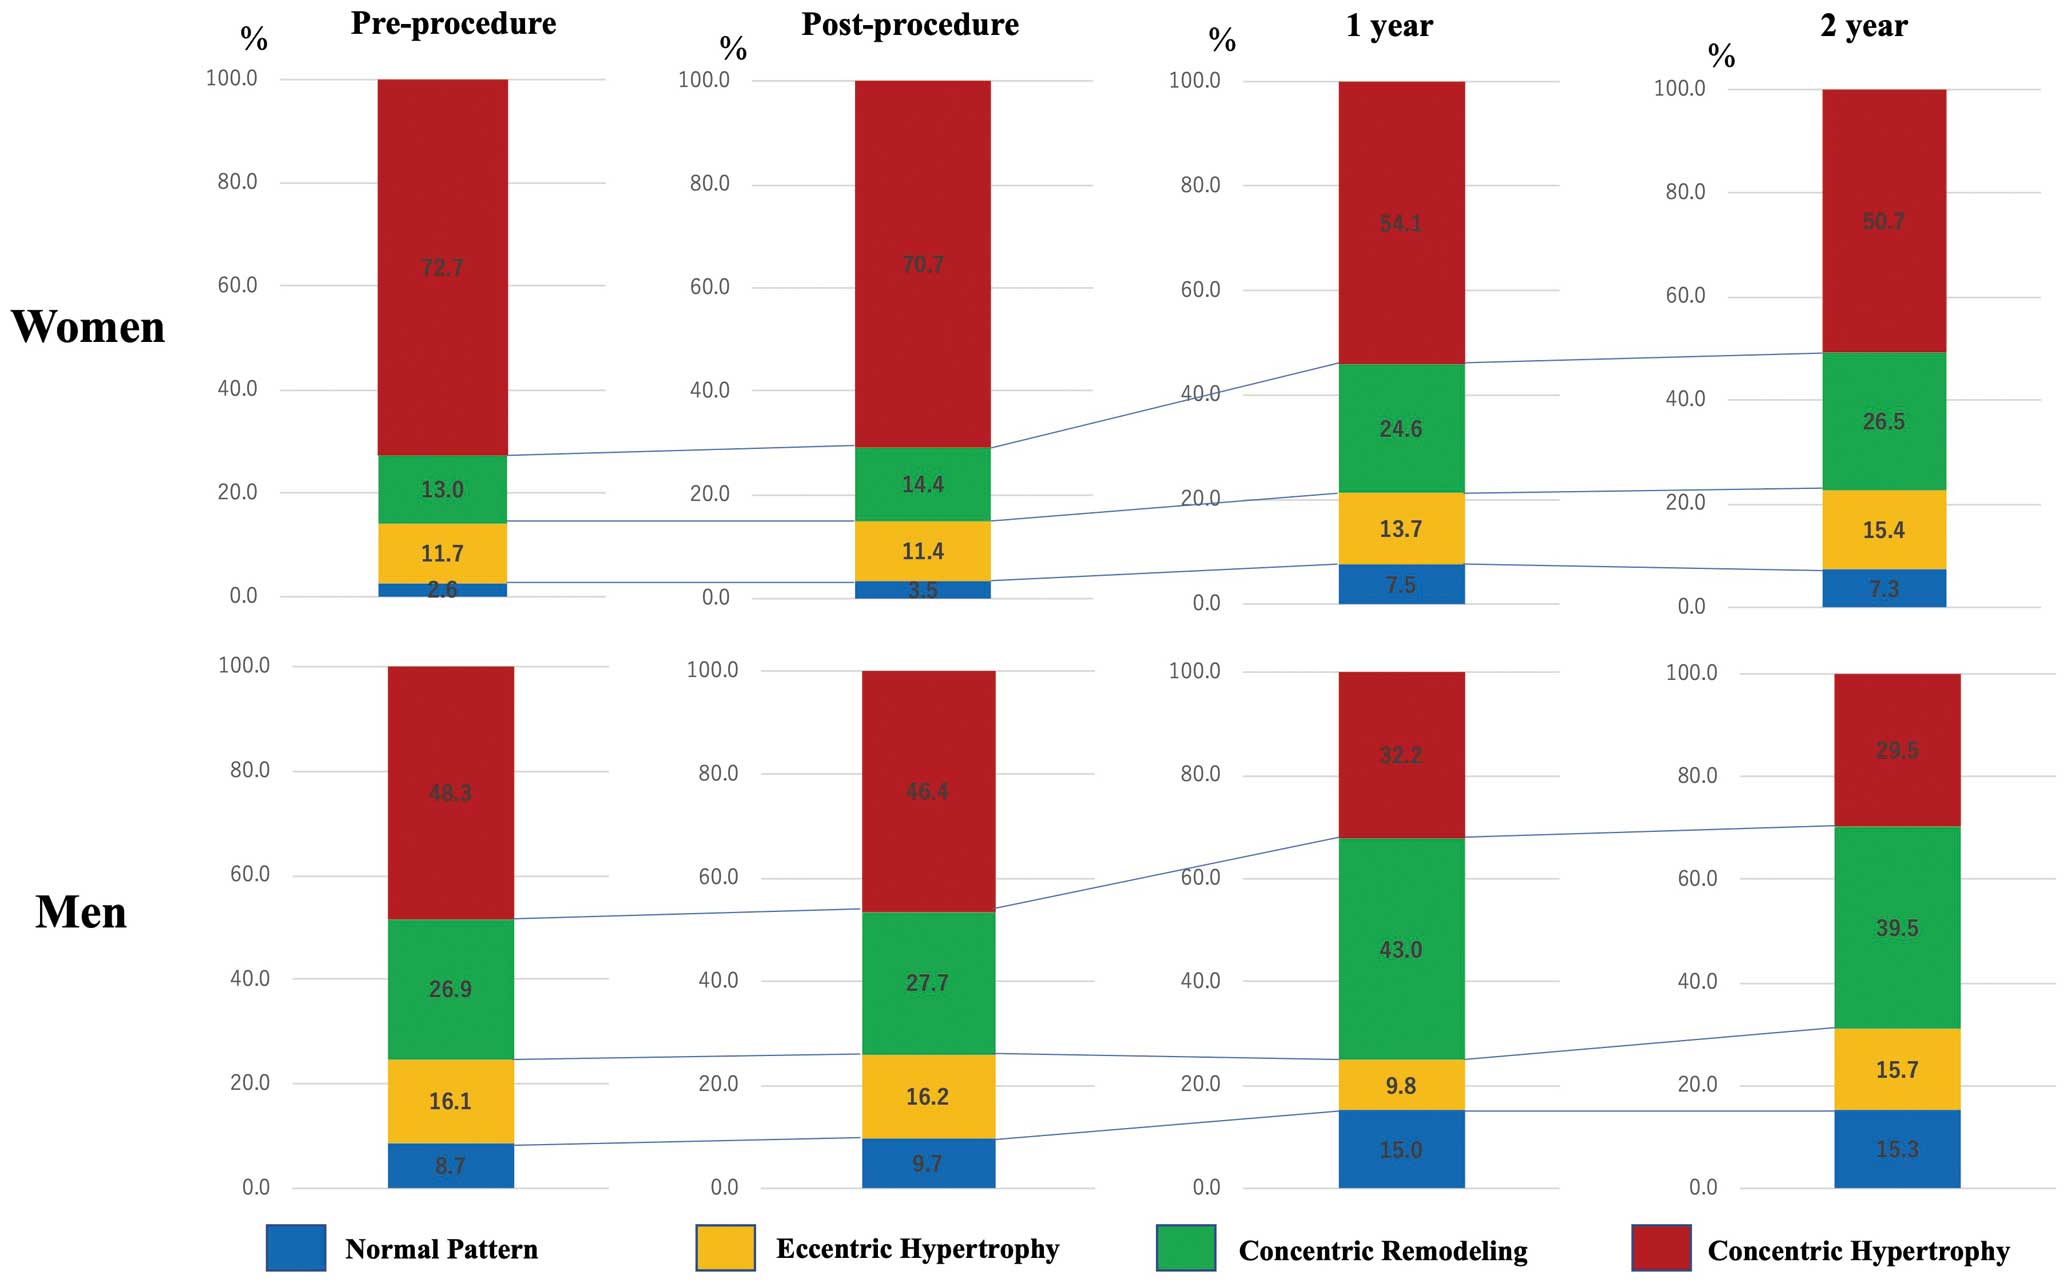
Figure 3
shows changes in the LV remodeling pattern in women and men. Women had a higher proportion of the concentric hypertrophy pattern than men before the procedure (72.7% vs. 48.3%, respectively; P<0.001). At the 1-year follow-up, the proportion of the concentric hypertrophy pattern had decreased and the proportion of concentric remodeling had increased in both sexes. The changes in remodeling patterns were similar in women and men.
In the present study, there were 155 patients (6.0%) with low-flow, low-gradient (LFLG) AS. LFLG AS was more frequent among men (n=73 patients; 9.2%) than among women (n=82 patients; 4.6%; P<0.001). Patients with LFLG AS had a significantly higher LV mass and LVMI than patients with high-pressure gradient AS on preprocedural echocardiography. In patients with LFLG AS, preprocedural LVMI was 146.4±40.4 g/m2
in men and 140.9±33.2 g/m2
in women (P=0.361). LVMI at 1 year was 126.9±36.7 g/m2
in men and 122.9±35.4 g/m2
in women (P=0.611). There was no significant difference between men and women in the change in LVMI from before to 1 year after TAVI.
Subgroup Analysis: Mortality After 1 Year According to Sex and LVMI Regression at 1 Year
At 1 year after TAVI, 76% of men (404/534 patients) and 72% of women (906/1,255 patients) were able to obtain LVMI regression. Patients were subsequently divided into 4 groups according to sex and the presence or absence of LVMI regression at 1-year: Group 1, men with no LVMI regression; Group 2, men with LVMI regression; Group 3, women with no LVMI regression; and Group 4, women with LVMI regression. Kaplan-Meier survival curve analysis indicated a significant survival advantage after 1 year for women with LVMI regression (Supplementary Figure 1). Among patients with LVMI regression, women had a significant survival advantage compared with men (log-rank, P<0.001). Conversely, among patients with no LVMI regression, all-cause mortality was not significant different between men and women (log-rank, P=0.569). Similarly, among patients with LVMI regression, cardiac death was significantly lower in women than men (log-rank, P=0.039;
Supplementary Figure 2), but there was no significant difference in cardiac death between men and women without LVMI regression (log-rank, P=0.270). Women with LVMI regression had better survival than those without LVMI regression (log-rank, P=0.020). In men, LVMI regression at 1-year had no effect on long-term mortality (log-rank, P=0.823).
Discussion
The main findings of this study are that: (1) long-term mortality was significantly lower in women than men among patients with severe AS undergoing TAVI, despite higher bleeding complication rates during the procedure in women; (2) LVMI regression after TAVI was similar between women and men; and (3) women had a survival advantage compared with men among patients with LVMI regression at 1 year, but there was no significant different between the sexes among patients with no LVMI regression.
Sex-Related Differences in Mortality After TAVI
To the best of our knowledge, the present study is the first in a Japanese population showing that women have lower mortality rates after long-term follow-up despite higher bleeding complications rates during the TAVI procedure. The favorable long-term clinical outcomes after TAVI in women are consistent with the results of previous studies.9,11,18
Increased rates of major and minor bleeding among women who underwent TAVI have been reported previously.10,19,20
According to the baseline characteristics in this study, the proportion of women was significantly higher (69.3%) and body size according to BSA was smaller compared with previously published articles.18,21
Although these baseline characteristics were different compared with those of Western populations, sex-specific differences in clinical outcomes were similar in our study. In accordance with a previous report, women had a higher risk of major bleeding.22
This study showed that high bleeding events in women were in-line with previous evidences, but vascular complications were not different. Major or minor bleeding may be related not only to vascular complications for valve access site with a large-bore arteriotomy, but also to non-access site issues or venous access sites, which has not been examined separately. The possible reasons for the high bleeding rate in women may be their smaller body size, lower body mass index, and frailty. The antiplatelet medications used in this study were similar between men and women.
Reports regarding sex-related differences in cardiovascular death after TAVI appear to be conflicting. A previous study indicated better survival in women,23
whereas other studies have indicated no differences between men and women after short- and mid-term follow-up.24,25
The lower incidence of cardiovascular death among women may be related to the low proportion of patients with cardiovascular disease risk at baseline, as shown in this study. According to the latest World Health Organization data, Japanese people, particularly women, have had the world’s longest average life expectancy since 1985. In 2010, the life expectancy of Japanese women aged 65 years was 24.3 years, which was the highest in the world.26
In the general Japanese population, average survival is longer for women than men (86.99 vs. 80.75 years, based on the Japanese Nation Statistics, https://www.mhlw.go.jp/toukei/saikin/hw/life/22th/dl/22th_11.pdf). Our finding of a better survival rate after TAVI among women than men may have been affected by the longer life expectancy of Japanese women in general. Therefore, we should consider sex-related differences in outcomes after TAVI when TAVI is performed in individual patients. In particular, in the case of very old patients, such as those aged >90 years, sex differences should be taken into account when considering the prognosis after TAVI. The results of this study provide important data regarding indications of TAVI for consideration during heart team conferences.
LV Remodeling After TAVI
LVH occurs in patients with chronic LV pressure overload due to severe AS. Wall stress is reduced as a compensatory response, thus maintaining the systolic function of the heart. Reverse remodeling has been shown to be essential for improving symptoms and prognosis following SAVR.27
LVH regression after SAVR over months to years has been documented in several studies,4,5
and some other studies have shown that significant LV mass regression occurs at an even earlier stage.28–30
Lindman et al showed that >50% of LVMI regression over 1 year occurred within 30 days in patients treated with TAVI.13
TAVI can improve pressure overload, similar to SAVR, leading to regression of LV mass.
We found a significant regression in LVMI between the time prior to and 1 year after TAVI. These findings are consistent with those of previous small studies on TAVI.31,32
The pattern of hypertrophy in women with severe AS was characterized by a small ventricular chamber with increased wall thickness.32
The calculation for LV mass incorporates cavity dimensions, which are higher in men. The effects of hormones, such as estrogen before and after menopause, may lead to differential hypertrophy patterns in women compared with men.33
Previous studies indicated that women exhibited a more exaggerated LV remodeling response in moderate-to-severe AS than did men.8
Moreover, women exhibited adaptive regression of LVH with less fibrosis after SAVR compared with men.7,34
A post hoc analysis that compared the findings after SAVR and TAVI indicated that female sex was a predictor of better absolute change in LVEF.35
The proportion of concentric hypertrophy in our study population was very high. In particular, the proportion of concentric hypertrophy was significantly higher in women than men before the procedure. These findings indicate that the echocardiographic characteristics of most Japanese women with severe AS are a normal LV chamber size with severely increased LV wall thickness.
Sex-Related Differences in Outcomes Between Patients With and Without LVMI Regression
In the present study, >70% of patients were able to obtain LVMI regression at 1 year, as demonstrated by echocardiography. Among patients with LVMI regression at 1 year, there were no significant differences between women and men. The development of LVMI may be somewhat adaptive in most patients with severe AS and allows myocardial compensation in progressive LV hemodynamic loading.36
In patients with high LVMI, TAVI could facilitate reverse remodeling and a reduction in LVMI at follow-up. Furthermore, greater LVMI regression at 1 year was independently associated with lower adjusted risks of clinical events, including all-cause death and rehospitalization between 1 and 5 years, in previous study.37
In the present study, among patients with LVMI regression at 1 year, women had a survival advantage compared with men, but there was no significant difference in survival between men and women among patients without LVMI regression. Women with LVMI regression had a better prognosis over the long-term follow-up. Hence, postprocedural LV mass regression may be related to the sex differences in mortality.
However, LVMI regression after TAVI was similar between women and men. These findings could indicate that the long-term survival benefit in women was not only related to regression of LVMI. The survival advantage in women may be associated with other factors.
Study Limitations
This study has some limitations. First, the analysis was retrospective in nature and the study was not a randomized trial. The differences in baseline characteristics may have affected the present results.
Second, balloon expandable valves (Edwards Sapien XT and Sapien 3) were used in most patients (87%) in this study because self-expandable valves only became commercially available in Japan in January 2016. In addition, new-generation devices were used by a few patients. Further assessments on the new-generation valves are needed.
Third, echocardiographic data were not analyzed by an independent core laboratory. Nevertheless, a small number of experienced echocardiographic physicians performed these procedures in all patients.
Fourth, LV mass was determined only by echocardiography and was not examined using magnetic resonance imaging or computed tomography. There are 3 echocardiographic methods: the 2D linear method, the area–length method, and the 3D method for measuring LV mass. The 2D linear method was used in this study because most previous echocardiographic studies of LV mass used the 2D linear method and there is a lot of published evidence. The present study was a large multicenter registry, and the M-mode method has the advantages of being simple, quick, and subject to less measurement variability. However, the 2D linear method has several limitations. Because linear measurements are cubed, even small measurement errors in dimensions or thickness have an effect on accuracy. The formula includes a correction for the 20% overestimation that was found during the original validation studies of the M-mode technique. Because direct 2D measures of wall thickness may yield smaller values than the M-mode technique, LV mass calculated using this formula may not be directly interchangeable. In addition, LV mass would be associated with many factors, including blood pressure, pacemaker implantation, left bundle branch block, paravalvular leak, and medications, before and after TAVI. This means the regression of LV mass may not be explained only by the TAVI procedure.
Fifth, although it is well known that myocardial infarction affects postoperative LV remodeling, we do not know the exact number of patients with a history of myocardial infarction in our database. Sixth, all patients who had baseline echocardiographic data were included in this study. This study had no exclusion criteria, such as uncontrolled hypertension or thyroid disease. Moreover, patients with other heart valvular disease, including severe mitral regurgitation or mitral stenosis, were not excluded. Therefore, we have the possible problem that LVMI may have been influenced by other factors.
Conclusions
Our analysis of sex differences using OCEAN-TAVI Registry data showed that female sex is associated with better survival outcomes over a long-term follow-up. LV remodeling with regression of LVMI was observed in both women and men after TAVI. Further studies are needed to identify factors associated with the survival advantage in women after TAVI.
Acknowledgments
The authors thank the all OCEAN-TAVI investigators.
Sources of Funding
The OCEAN-TAVI Registry is supported by Edwards Lifesciences, Medtronic, Boston Scientific, Abbott Medical, and Daiichi-Sankyo.
Disclosures
M.Y., N.T., T.N., S. Shirai, K.M., H.U., M.T., Y.W., and S. Saito are clinical proctors for Edwards Lifesciences and Medtronic. M.A., K.T., and K.H. are clinical proctors for Edwards Lifesciences. K.H. has received remuneration (lecture fees, etc.) from Edwards Lifesciences and Daiichi-Sankyo. F. Yashima received remuneration (lecture fees, etc.) from Daiichi-Sankyo. N.T., T.N., S. Shirai, and Y.W. have received remuneration (lecture fees, etc.) from Edwards Lifesciences and Medtronic. H.U. has received remuneration (lecture fees, etc.) from Medtronic. K.M. has received remuneration (lecture fees, etc.) from Edwards Lifesciences, Abbott Medical, Boston Scientific, and Asteras Amgen. M.T. has received remuneration (lecture fees, etc.) from Edwards Lifesciences, Medtronic, Abbott Medical, Terumo, Livanova, and Century Medical. K.T. has received remuneration (lecture fees, etc.) from Daiichi-Sankyo, Edwards Lifesciences, and Abbott Medical. M.Y. has received remuneration (lecture fees, etc.) from Daiichi-Sankyo, Edwards Lifesciences, and Medtronic.
K.H. is a member of
Circulation Journal’s Editorial Team. The remaining authors have nothing to disclose.
IRB Information
This study was approved by Keio University Ethics Committee (Reference no. 20130270).
Data Availability
The deidentified participant data will not be shared.
Supplementary Files
Please find supplementary file(s);
http://dx.doi.org/10.1253/circj.CJ-20-1095
References
- 1.
Kadem L, Dumesnil JG, Rieu R, Durand LG, Garcia D, Pibarot P. Impact of systemic hypertension on the assessment of aortic stenosis. Heart 2005; 91: 354–361.
- 2.
Dweck MR, Joshi S, Murigu T, Alpendurada F, Jabbour A, Melina G, et al. Midwall fibrosis is an independentpredictor of mortality in patients with aortic stenosis. J Am Coll Cardiol 2011; 58: 1271–1279.
- 3.
Carroll JD, Carroll EP, Feldman T, Ward DM, Lang RM, McGaughet D, et al. Sex-associated differences in left ventricular function in aortic stenosis of the elderly. Circulation 1992; 86: 1099–1107.
- 4.
Monrad ES, Hess OM, Murakami T, Nonogi H, Corin WJ, Krayenbuehl HP. Time course of regression of left ventricular hypertrophy after aortic valve replacement. Circulation 1988; 77: 1345–1355.
- 5.
Lund O, Emmertsen K, Dorup I, Jensen FT, Flo C. Regression of left ventricular hypertrophy during 10 years after valve replacement for aortic stenosis is related to the preoperative risk profile. Eur Heart J 2003; 24: 1437–1446.
- 6.
Une D, Mesana L, Chan V, Maklin M, Chan R, Masters RG, et al. Clinical impact of change in left ventricular function after aortic valve replacement. Circulation 2015; 132: 741–747.
- 7.
Petrov G, Regitz-Zagrosek V, Lehmkuhl E, Krabatsch T, Dunkel A, Dandel M, et al. Regression of myocardial hypertrophy after aortic valve replacement: Faster in women? Circulation 2010; 122(Suppl): S23–S28.
- 8.
Lee JM, Park SJ, Lee SP, Park E, Chang SA, Kim HK, et al. Gender difference in ventricular response to aortic stenosis: Insight from cardiovascular magnetic resonance. PLoS One 2015; 10: e0121684.
- 9.
Hayashida K, Morice MC, Chevalier B, Hovasse T, Romano M, Garot P, et al. Sex-related differences in clinical presentation and outcome of transcatheter aortic valve implantation for severe aortic stenosis. J Am Coll Cardiol 2012; 59: 566–571.
- 10.
Humphries KH, Toggweiler S, Rodes-Cabau J, Nombela-Franco L, Dumont E, Wood DA, et al. Sex differences in mortality after transcatheter aortic valve replacement for severe aortic stenosis. J Am Coll Cardiol 2012; 60: 882–886.
- 11.
Williams M, Kodali SK, Hahn RT, Humphries KH, Nkomo VT, Cohen DJ, et al. Sex-related differences in outcomes after transcatheter or surgical aortic valve replacement in patients with severe aortic stenosis: Insights from the PARTNER trial (Placement of Aortic Transcatheter Valve). J Am Coll Cardiol 2014; 63: 1522–1528.
- 12.
Chandrasekhar J, Dangas G, Yu J, Vemulapalli S, Suchindran S, Vora AN, et al. Sex-based differences in outcomes with transcatheter aortic valve therapy: TVT Registry from 2011 to 2014. J Am Coll Cardiol 2016; 68: 2733–2744.
- 13.
Lindman BR, Stewart WJ, Pibarot P, Hahn RT, Otto CM, Xu K, et al. Early regression of severe left ventricular hypertrophy after transcatheter aortic valve replacement is associated with decreased hospitalizations. JACC Cardiovasc Interv 2014; 7: 662–673.
- 14.
Chen SC, Leu HB, Chang HH, Chen IM, Chen PL, Lin SM, et al. Women had favourable reverse left ventricle remodeling after TAVR. Eur J Clin Invest 2020; 50: e13183.
- 15.
Lang RM, Bierig M, Devereux RB, Flachskampf FA, Foster E, Pellikka PA, et al. Recommendations for chamber quantification: A report from the American Society of Echocardiography’s Guidelines and Standards Committee and the Chamber Quantification Writing Group, developed in conjunction with the European Association of Echocardiography, a branch of the European Society of Cardiology. J Am Soc Echocardiogr 2005; 18: 1440–1463.
- 16.
Lang RM, Badano LP, Mor-Avi V, Afilalo J, Armstrong A, Ernande L, et al. Recommendations for cardiac chamber quantification by echocardiography in adults: An update from the American Society of Echocardiography and the European Association of Cardiovascular Imaging. J Am Soc Echocardiogr 2015; 28: 1–39.e14.
- 17.
Kappetein AP, Head SJ, Genereux P, Piazza N, van Mieghem NM, Blackstone EH, et al. Updated standardized endpoint definitions for transcatheter aortic valve implantation: The valve academic research consortium-2 consensus document. J Am Coll Cardiol 2012; 60: 1438–1454.
- 18.
O’Connor SA, Morice MC, Gilard M, Leon MB, Webb JG, Dvir D, et al. Revisiting sex equality with transcatheter aortic valve replacement outcomes: A collaborative, patient-level meta-analysis of 11,310 patients. J Am Coll Cardiol 2015; 66: 221–228.
- 19.
Van Mieghem NM, Tchetche D, Chieffo A, Dumonteil N, Messika-Zeitoun D, van der Boon RM, et al. Incidence, predictors, and implications of access site complications with transfemoral transcatheter aortic valve implantation. Am J Cardiol 2012; 110: 1361–1367.
- 20.
Genereux P, Webb JG, Svensson LG, Kodali SK, Satler LF, Fearon WF, et al. Vascular complications after transcatheter aortic valve replacement: Insights from the PARTNER (Placement of AoRTic TraNscathetER Valve) trial. J Am Coll Cardiol 2012; 60: 1043–1052.
- 21.
Kodali S, Williams MR, Doshi D, Hahn RT, Humphries KH, Nkomo VT, et al. Sex-specific differences at presentation and outcomes among patients undergoing transcatheter aortic valve replacement: A cohort study. Ann Intern Med 2016; 164: 377–384.
- 22.
Itzhaki Ben Zadok O, Kornowski R, Finkelstein A, Barbash I, Danenberg H, Segev A, et al. Temporal trends in genderrelated differences and outcomes in patients who underwent transcatheter aortic valve implantation (from the Israeli Transcatheter Aortic Valve Implantation Multicenter Registry). Am J Cardiol 2019; 123: 108–115.
- 23.
Buja P, Napodano M, Tamburino C, Petronio AS, Ettori F, Santoro G, et al. Comparison of variables in men versus women undergoing transcatheter aortic valve implantation for severe aortic stenosis (from Italian Multicenter CoreValve Registry). Am J Cardiol 2013; 111: 88–93.
- 24.
Forrest JK, Adams DH, Popma JJ, Reardon MJ, Deeb GM, Yakubov SJ, et al. Transcatheter aortic valve replacement in women versus men (from the US CoreValve Trials). Am J Cardiol 2016; 118: 396–402.
- 25.
Szerlip M, Gualano S, Holper E, Squiers JJ, White JM, Doshi D, et al. Sex-specific outcomes of transcatheter aortic valve replacement with th SAPIEN3 valve: Insights from the PARTNER II S3 high-risk and intermediate risk cohort. JACC Cardiovasc Interv 2018; 11: 13–20.
- 26.
Kontis V, Bennett JE, Mathers CD, Li G, Foreman K, Ezzati M. Future life expectancy in 35 industrialised countries: Projections with a Bayesian model ensemble. Lancet 2017; 389: 1323–1335.
- 27.
Gaudino M, Alessandrini F, Glieca F, Luciani N, Cellini C, Pragliola C, et al. Survival after aortic valve replacement for aortic stenosis: Does left ventricular mass regression have a clinical correlate? Eur Heart J 2005; 26: 51–57.
- 28.
Beach JM, Mihaljevic T, Rajeswaran J, Marwick T, Edwards ST, Nowicki ER, et al. Ventricular hypertrophy and left atrial dilatation persist and are associated with reduced survival after valve replacement for aortic stenosis. J Thorac Cardiovasc Surg 2014; 147: 362–369.e368.
- 29.
Christakis GT, Joyner CD, Morgan CD, Fremes SE, Buth KJ, Sever JY, et al. Left ventricular mass regression early after aortic valve replacement. Ann Thorac Surg 1996; 62: 1084–1089.
- 30.
Repossini A, Rambaldini M, Lucchetti V, Da Col U, Cesari F, Mignosa C, et al. Early clinical and haemodynamic results after aortic valve replacement with the Freedom SOLO bioprosthesis (experience of Italian multicenter study). Eur J Cardiothorac Surg 2012; 41: 1104–1110.
- 31.
Sato K, Kumar A, Jones BM, Mick SL, Krishnaswamy A, Grimm RA, et al. Reversibility of cardiac function predicts outcome after transcatheter aortic valve replacement in patients with severe aortic stenosis. J Am Heart Assoc 2017; 6: e005798.
- 32.
Fairbairn TA, Steadman CD, Mather AN, Motwani M, Blackman DJ, Plein S, et al. Assessment of valve haemodynamics, reverse ventricular remodelling and myocardial fibrosis following transcatheter aortic valve implantation compared to surgical aortic valve replacement: A cardiovascular magnetic resonance study. Heart 2013; 99: 1185–1191.
- 33.
Schillaci G, Verdecchia P, Borgioni C, Ciucci A, Porcellati C. Early cardiac changes after menopause. Hypertension 1998; 32: 764–769.
- 34.
Petrov G, Dworatzek E, Schulze TM, Dandel M, Kararigas G, Mahmoodzadeh S, et al. Maladaptive remodeling is associated with impaired survival in women but not in men after aortic valve replacement. JACC Cardiovasc Imaging 2014; 7: 1073–1080.
- 35.
Clavel MA, Webb JG, Rodés-Cabau J, Masson JB, Dumont E, De Larochellière R, et al. Comparison between transcatheter and surgical prosthetic valve implantation in patients with severe aortic stenosis and reduced left ventricular ejection fraction. Circulation 2010; 122: 1928–1936.
- 36.
Rosenbaum Z, Finkelstein A, Zhitomilsky S, Topilsky Y, Halkin A, Banai S, et al. Impact of preprocedural left ventricule hypertrophy and geometrical patterns on mortality following TAVR. Am Heart J 2020; 220: 184–191.
- 37.
Chau KH, Douglas PS, Pibarot P, Hahn RT, Khalique OK, Jaber WA, et al. Regression of left ventricular mass after transcatheter aortic valve replacement. J Am Coll Cardiol 2020; 75: 2446–2458.

