Abstract
Background: Although B-type natriuretic peptide (BNP) and N-terminal (NT)-proBNP are commonly used markers of heart failure, a simple conversion formula between these peptides has not yet been developed for clinical use.
Methods and Results: A total of 9,394 samples were obtained from Nara Medical University, Jichi Medical University, and Osaka University. We randomly selected 70% for a derivation set to investigate a conversion formula from BNP to NT-proBNP using estimated glomerular filtration rate (eGFR) and body mass index (BMI); the remaining 30% was used as the internal validation set and we used a cohort study from Nara Medical University as an external validation set. Multivariate linear regression analysis revealed a new conversion formula: log NT-proBNP = 1.21 + 1.03 × log BNP − 0.009 × BMI − 0.007 × eGFR (r2=0.900, P<0.0001). The correlation coefficients between the actual and converted values of log NT-proBNP in the internal and external validation sets were 0.942 (P<0.0001) and 0.891 (P<0.0001), respectively. We applied this formula to samples obtained from patients administered with sacubitril/valsartan. After treatment initiation, NT-proBNP levels decreased and actual BNP levels increased. However, the calculated BNP levels decreased roughly parallel to the NT-proBNP levels.
Conclusions: This new and simple conversion formula of BNP and NT-proBNP with eGFR and BMI is potentially useful in clinical practice.
B-type natriuretic peptide (BNP) and N-terminal (NT)-proBNP are the products of the same gene (BNP) that encodes proBNP, a 108-amino acid peptide mainly expressed in the ventricles. Prior to secretion, this prohormone is processed into the biologically active BNP and biologically inactive NT peptides.1,2 Because heart failure (HF) severity augments BNP expression, BNP and NT-proBNP are commonly used for diagnosing HF, predicting outcomes in clinical settings,3–8 and for assessing the effects of therapeutic interventions in patients with HF.9,10 These 2 peptides are the most clinically useful biomarkers of HF and generally correlate with each other, but differences are observed in regard to changes in their plasma levels.
Editorial p 2019
Plasma levels of circulating peptides are regulated by their production and clearance. The production of BNP and NT-proBNP is regulated in the same manner, but their mechanisms for clearance are different. In particular, NT-proBNP is unable to bind to the biologically active and clearance receptors of BNP; furthermore, NT-proBNP is not a substrate of neprilysin, which is an enzyme that degrades BNP. Therefore, NT-proBNP is assumed to be more affected by non-receptor-mediated clearance through the kidney and non-neprilysin-mediated degradation compared with BNP. Furthermore, the clearance receptor and neprilysin are abundantly expressed in adipose tissues.11,12 Considering these factors, renal function and body mass index (BMI) would affect the correlation between BNP and NT-proBNP levels.
In clinics, physicians measure either the plasma BNP or NT-proBNP levels depending on several indications. However, physicians who often use BNP may experience difficulty in interpreting NT-proBNP data, and vice versa. Therefore, there is a need to create a formula for conversion between BNP and NT-proBNP. Moreover, cardiologists have recently been using sacubitril/valsartan to treat patients with HF; both of these medications inhibit neprilysin activity, which causes increased plasma BNP levels. Considering this, assessing the effect of sacubitril/valsartan by measuring plasma BNP levels may be difficult, but would not be encountered when measuring plasma NT-proBNP levels. A formula that converts NT-proBNP to BNP potentially predicts the plasma BNP levels unaffected by sacubitril/valsartan.
Here, we present the development of a new conversion formula, considering both renal function and BMI, using simultaneous measurements of both peptides from almost 10,000 samples obtained in the absence of sacubitril/valsartan.
Methods
Study Samples
A total of 9,394 samples were analyzed to determine a new conversion formula from BNP to NT-proBNP (4,224 samples from Nara Medical University, 3,637 from Jichi Medical University, 1,533 from Osaka University). All blood samples were collected on the same day in these 3 institutions and measurements were performed immediately.
Samples from Nara Medical University were collected between November 2018 and February 2019. Patients with HF, coronary artery disease, hypertension, dyslipidemia, or diabetes mellitus in whom plasma BNP and serum creatinine levels were measured simultaneously were included. NT-proBNP levels were measured in the same samples. Oral informed consent was given by all participating patients.
Data from Jichi Medical University were originally collected for the Japan Morning Surge-Home Blood Pressure (J-HOP) study, which was a prospective observational study (University Hospital Medical Information Network Clinical Trials Registry, UMIN000000894) conducted between January 2005 and May 2012 to evaluate the use of home blood pressure measurements to predict cardiovascular events in Japanese ambulatory patients with a history of and/or risk factors for coronary vascular disease.13 BNP and NT-proBNP were simultaneously measured in each sample. All participants provided written informed consent for the use of data in the J-HOP study on an opt-out basis.
All samples from Osaka University were collected during medical treatment of patients who were admitted to Osaka University Hospital for HF between 2008 and 2015. Patients whose BNP and NT-proBNP levels were measured simultaneously were included. Because all the data were collected for medical treatment, information on conducting the research, including the purpose of the research, was released on an opt-out basis.
Additionally, 26 samples from outpatients of the Hiramitsu Heart Clinic were collected at baseline and then at 2, 6, 10, 14, 18, and 24 weeks of medical treatment with sacubitril/valsart. Patients received a dose of 50 mg sacubitril/valsartan twice daily at 2 weeks, 100 mg twice daily at 6 weeks, and 200 mg twice daily at 10 weeks if there was tolerability to up-titration. The patients were followed up after internal stabilization at 18 and 24 weeks. The samples were collected after September 2020, when the drugs became commercially available in Japan. The data were used to evaluate the actual values of BNP and NT-proBNP and the calculated values of BNP pre- and post-administration of sacubitril/valsartan. Because the data from the Hiramitsu Heart Clinic were also collected for medical treatment, oral informed consent was obtained to use the data in this study.
Data collected included age, sex, BMI, BNP, NT-proBNP, hemoglobin, estimated glomerular filtration rate (eGFR), and C-reactive protein level. eGFR was calculated according to the previously published equation for Japanese individuals: 194 × serum creatinine − 1.094 × age − 0.287 × (0.739 for women).14
This study was approved by the Ethics Committee of Nara Medical University (approval no. 1,800) and was conducted in accordance with the Declaration of Helsinki.
Natriuretic Peptide Measurements
In Nara Medical University and Jichi Medical University, plasma BNP levels were measured using a chemiluminescent enzyme technique (Atellica IM B-Type Natriuretic Peptide; Siemens Healthcare Diagnostics KK, Japan, MI02 Shionogi BNP; Shionogi, Japan). In Osaka University, the plasma BNP levels were measured using the E-test TOSOH II (BNP) assay (TOSOH Corp., Japan). In the Hiramitsu Heart Clinic, BNP levels in whole blood samples were measured using a fluorescent immunochromatographic assay (SHIONOSPOT® BNP; Shionogi). All BNP assay kits used the same 2 antibodies against different portions of mature BNP.15
At the three universities, NT-proBNP and BNP levels were measured on the same day. The measurement of NT-proBNP in the samples from Hiramitsu Heart Clinic was contracted to FALCO Biosystems Ltd. (Kyoto, Japan), where the blood samples were centrifuged and serum refrigerated or cryopreserved before measurements. Even though the sites of the measurements were different, the levels of NT-proBNP were all measured using the Elecsys pro-BNP electrochemiluminescent immunoassay (Roche Diagnostics, Japan).
Statistical Analysis
Normally and non-normally distributed data are expressed as mean±standard deviation (SD) and median with interquartile range (IQR), respectively. Categorical variables are summarized as percentages. To normalize the distribution, BNP and NT-proBNP levels were log-transformed before statistical analysis. Univariate linear regression analysis was performed to evaluate the relationship of BNP or NT-proBNP with each clinical parameter, BMI, and eGFR, which have been previously reported as involved in the metabolism of natriuretic peptides.11,16–18
First, 70% of the samples were randomly selected to create a derivation set. Multivariate linear regression analysis was used to explore the association between log BNP and log NT-proBNP using BMI and eGFR values. The bootstrap method was used to estimate the accuracy of the conversion formula. The remaining 30% of the samples were used as the internal validation set. For the external validation set, we used a retrospective cohort study that enrolled patients with cardiovascular disease who underwent elective cardiac catheterization for diagnosis or percutaneous coronary intervention at Nara Medical University Hospital between April 2004 and August 2008.19
JMP software for Windows version 14 (SAS Institute, Cary, NC, USA) and STATA version 17 (Stata Corp., College Station, TX, USA) were used for all statistical analyses, and a P value <0.05 was considered significant.
Results
Baseline Characteristics of the Study Patients
The baseline characteristics of the patients from whom blood samples were drawn are shown in the Table. The mean age and BMI were 67.3±13.4 (mean±SD) years and 23.4±4.2 kg/m2, respectively, and males accounted for 58.1% of all samples. The median [25–75th IQR] values of BNP and NT-proBNP were 55.5 [18.4–202.8] pg/mL and 198.6 [53.2–1,260.5] pg/mL, respectively. The mean levels of hemoglobin and eGFR were 13.1±2.0 g/dL and 60.9±23.1 mL/min/1.73 m2, respectively. The median C-reactive protein (CRP) level was 0.07 [0.03–0.23] mg/dL.
Table. Baseline Characteristics of the Study Samples
| |
All samples
(n=9,394) |
Derivation set
(n=6,575) |
Internal validation set
(n=2,819) |
External validation set
(n=1,171) |
| Demographic |
| Age (years) |
67.3±13.4 |
67.4±13.4 |
67.0±13.4 |
64.5±11.4 |
| Male (%) |
58.1 |
57.8 |
58.7 |
72.0 |
| BMI (kg/m2) |
23.4±4.2 |
23.4±4.2 |
23.4±4.2 |
24.2±3.4 |
| Laboratory data |
| BNP (pg/mL) |
55.5 [18.4–202.8] |
55.7 [18.7–203] |
55.6 [17.8–202.8] |
51.8 [19.6–148] |
| NT-pro BNP (pg/mL) |
198.6 [53.2–1,260.5] |
194.7 [53.5–1,246.5] |
207.9 [53.0–1,285] |
228.4 [69.2–848] |
| Hemoglobin (g/dL) |
13.1±2.0 |
13.1±2.0 |
13.1±2.0 |
|
| eGFR (mL/min/1.73 m2) |
60.9±23.1 |
60.8±23.2 |
61.2±23.0 |
65.9±24.2 |
| CRP (mg/dL) |
0.07 [0.03–0.23] |
0.08 [0.03–0.26] |
0.08 [0.03–0.25] |
|
The data are presented as the mean±SD for continuous normally distributed variables, median (25–75th interquartile range [IQR]) for continuous non-normally distributed variables, or n (%). BMI, body mass index; BNP, B-type natriuretic peptide; CRP, C-reactive protein; eGFR, estimated glomerular filtration rate; NT-pro BNP, N-terminal pro-B-type natriuretic peptide.
We included 6,575 and 2,819 samples in the derivation and internal validation sets, respectively. No significant difference between the two sets was observed for the clinical and biochemical parameters. The Table shows the characteristics of the external validation set, which included 1,171 samples. The mean age, BMI, and eGFR and the median values of BNP and NT-proBNP of the external validation set were similar to those of the other sets; however, the proportion of males was 72.0%, which was higher than in other sets.
Distribution of the Samples According to the Levels of BNP and NT-proBNP in All Samples
The distribution of all samples was evaluated according to the stratification of BNP and NT-proBNP levels. The classifications of BNP were <40 pg/mL and ≥40 pg/mL; <100 pg/mL and ≥100 pg/mL; and <200 pg/mL and ≥200 pg/mL. The classifications of NT-proBNP were <125 pg/mL and ≥125 pg/mL; <400 pg/mL and ≥400 pg/mL; and <900 pg/mL and ≥900 pg/mL. Based on these classifications, all samples were divided into 16 groups (Figure 1). Approximately 90% of samples with BNP <40 pg/mL were classified as the subgroup with NT-proBNP <125 pg/mL; additionally, approximately 90% of samples with NT-proBNP <125 pg/mL were classified as the subgroup with BNP value <40 pg/mL. In cases of high BNP and NT-proBNP values, >90% of samples with BNP ≥200 pg/mL showed NT-proBNP levels ≥900 pg/mL, while approximately 77% of samples with NT-proBNP ≥900 pg/mL showed BNP ≥200 pg/mL. However, samples with BNP levels between 40 and 200 pg/mL were distributed more variably compared with samples that showed BNP levels of <40 pg/mL or ≥200 pg/mL. Similarly, samples with NT-proBNP levels between 125 and 900 pg/mL were variably distributed.

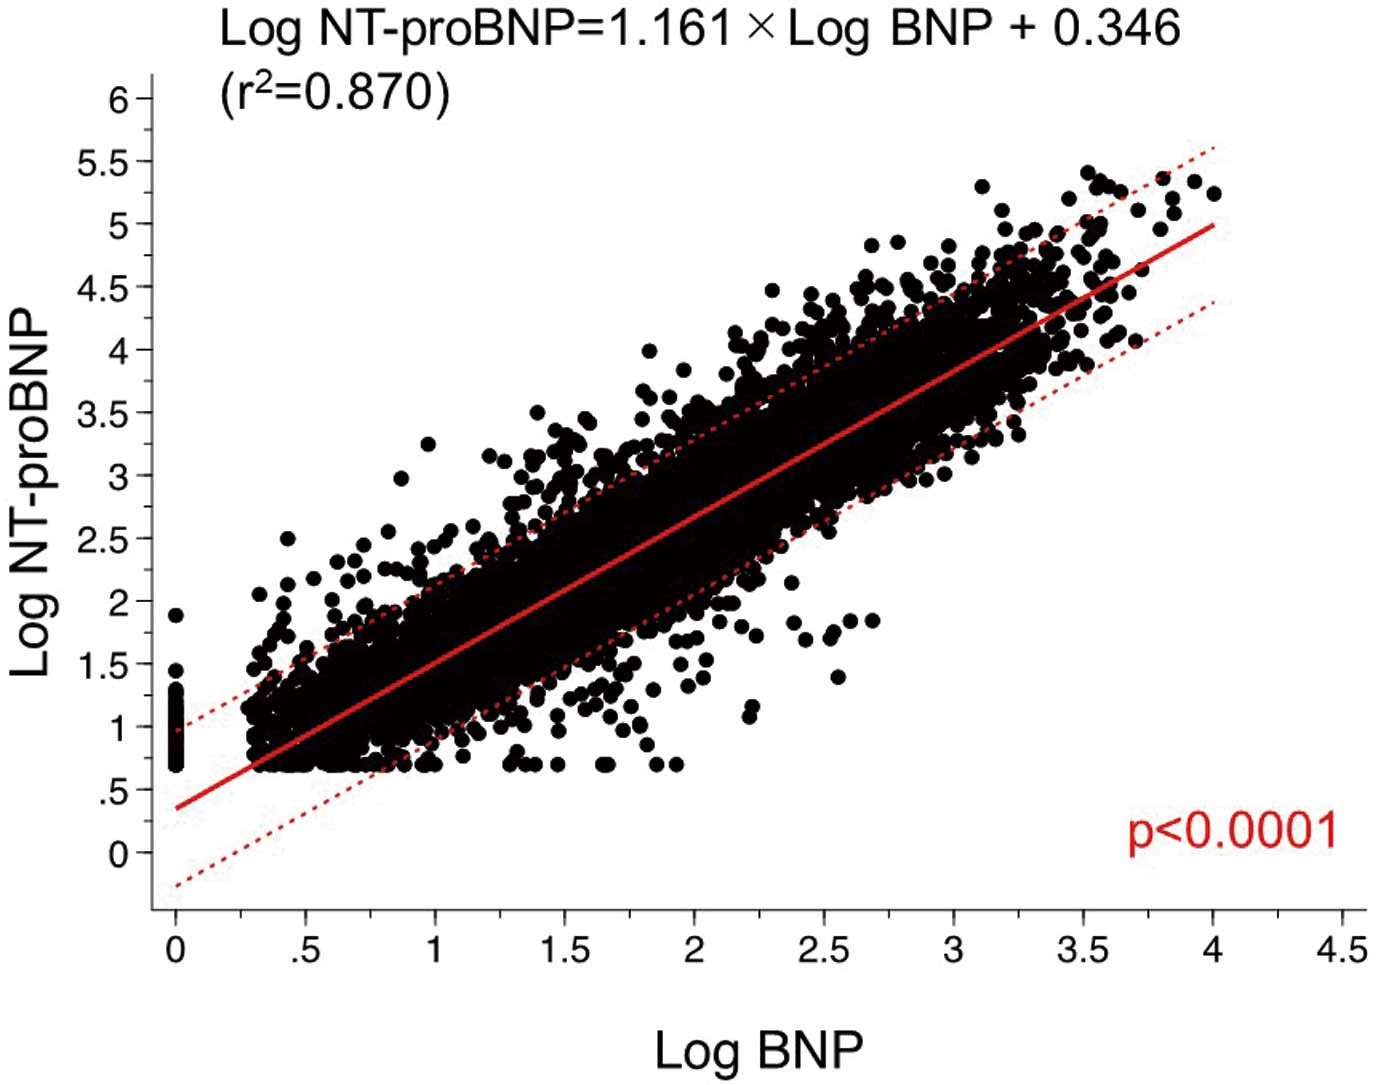
The relationship between log-transformed BNP (log BNP) and log-transformed NT-proBNP (log NT-proBNP) is shown in Figure 2. Univariate linear regression analysis showed a positive correlation between log NT-proBNP levels and log BNP levels (P<0.0001). Similarly, stratified analysis according to chronic kidney disease (CKD) stage showed a positive correlation between log NT-proBNP levels and log BNP levels in each group (Figure 3). As the CKD stage progressed, the linear regression line between log NT-proBNP and BNP showed an upward trend in an almost parallel manner.
Conversion Formula Between BNP and NT-proBNP
Using the derivation set, multivariate linear regression analysis was performed to investigate a regression formula to convert log BNP to log NT-proBNP using BMI and eGFR values. The obtained conversion formula was: log NT-proBNP = 1.21 + 1.03 × log BNP − 0.009 × BMI − 0.007 × eGFR (Figure 4). A significant correlation was observed between the actual and converted values of log NT-proBNP (r2=0.900, P<0.0001).

The internal validation set and converted values of log NT-proBNP from log BNP and of log BNP from log NT-proBNP were analyzed using this formula. Figure 5A,B shows the scatter plots illustrating the association between the converted and actual values of log NT-proBNP and log BNP, respectively, in the internal validation set. The correlation coefficients were 0.942 and 0.925, respectively. Additionally, the external validation set was analyzed, and the converted values of log NT-proBNP and log BNP were calculated. The scatter plots of the converted and actual values of log NT-proBNP and log BNP in the external validation set showed correlation coefficients of 0.891 and 0.863, respectively (Figure 5C,D).
Comparison of Calculated and Actual Values of NT-proBNP or BNP by Stratification of the BNP and NT-proBNP Levels in All Samples
The calculated values of NT-proBNP and BNP were obtained from the converted values of log NT-proBNP and log BNP. Figure 6A shows the IQR of the actual and calculated values of NT-proBNP according to the stratification of the actual BNP values. Additionally, the IQRs of the actual and calculated values of BNP according to the stratification of the actual values of NT-proBNP are shown in Figure 6B. An increase in BNP and NT-proBNP values was associated with an increased dissociation of the IQR of the actual and calculated values. However, the median values of the actual and calculated values of NT-proBNP and BNP were similar in each stratification.
Actual and Calculated Values of Plasma BNP Levels Before and After Taking Sacubitril/Valsartan
Sacubitril/valsartan treatment can inhibit neprilysin, a BNP-degrading enzyme, which results in elevated BNP levels. Therefore, we attempted to estimate the plasma levels of speculated endogenous BNP from those of NT-proBNP using our conversion formula. We measured BNP and NT-proBNP levels pre- and post-administration of sacubitril/valsartan and the calculated BNP values from NT-proBNP levels are plotted in Figure 7. After initiation of sacubitril/valsartan, NT-proBNP levels decreased to approximately half of the pretreatment values; however, the actual BNP levels increased. On the other hand, a decrease was observed in BNP levels approximately parallel to NT-proBNP levels. The actual BNP levels were approximately 2-fold higher than the calculated values after the treatment.
Discussion
In the present study we developed a new formula for converting BNP levels and NT-proBNP levels using eGFR and BMI. Our multivariate regression model demonstrated a significant correlation between the actual and converted values of log NT-proBNP.
This formula showed higher accuracy than previously reported formulas.19,20 Among them, a linear regression formula20 was created to convert log NT-proBNP to log BNP, which was simple but less accurate. To improve accuracy, it is necessary to consider more factors related to natriuretic peptide production and metabolism. Horii et al demonstrated a formula that converted log BNP to log NT-proBNP using eGFR, BMI, heart rate, left ventricular ejection fraction, and left ventricular end-diastolic pressure.19 Similarly, another study reported a formula converting log BNP to log NT-proBNP using log BNP, age, sex, BMI, creatinine clearance, hemoglobin, and atrial fibrillation.21 Despite the high accuracy of these 2 formulas, their clinical applicability was limited by their complexity. Because BNP and NT-proBNP are both regulated by BNP expression, our conversion formula focused mainly on factors that affected the metabolism of both peptides (i.e., eGFR and BMI), rather than their production.16,17,22
The clearance mechanisms of NT-proBNP and BNP are different; compared with BNP, NT-proBNP clearance is predominantly regulated by renal function. BNP is metabolized by receptor-mediated and degrading-enzyme-mediated mechanisms,23 whereas NT-proBNP does not bind to receptors and is not a substrate of the specific degrading enzyme, neprilysin. Therefore, plasma NT-proBNP levels are more easily elevated than BNP levels, which may have caused dissociation in some cases, where the calculated value was overestimated for BNP and underestimated for NT-proBNP in our external validation. As Horii et al demonstrated in their study, such patients had CKD stage 4 or 5.19 In such cases, some patients may have had much higher NT-proBNP levels than expected. Therefore, it should be noted that interpretation of the converted NT-proBNP or BNP levels can be over- or underestimated in cases of lower eGFR, even though the conversion formula was devised as a function of eGFR.
The other factor in our conversion formula was BMI. Previous studies have demonstrated an inverse relationship between BMI and natriuretic peptides,24–27 and have shown that adipocytes highly express natriuretic peptide clearance receptor-C.28,29 Other studies have reported that hyperinsulinemia and adiponectin attenuate natriuretic peptide production.30,31 Although the findings on the mechanisms of low BNP and NT-proBNP levels in obesity have been inconclusive, we observed a negative correlation between BMI and log BNP or log NT-proBNP, which is consistent with previous studies. Based on the present conversion formula, plasma NT-proBNP levels would decline more than BNP levels.
Other cofactors affect natriuretic peptide metabolism. Because Jensen et al reported that inflammation increases the NT-proBNP and the NT-proBNP/BNP ratio,32 we developed a conversion formula from BNP to NT-proBNP consisting of BMI, eGFR, and CRP: log NT-proBNP = 1.22 + 1.01 × log BNP − 0.009 × BMI − 0.007 × eGFR + 0.031 × CRP (r2=0.904, P<0.0001). The coefficient of determination was similar between the conversion formulas regardless of the presence of CRP. Besides CRP, hemoglobin is an important cofactor that affects natriuretic peptides.33 We developed a conversion formula from BNP to NT-proBNP consisting of BMI, eGFR, and hemoglobin: log NT-proBNP = 1.38 + 1.02 × log BNP − 0.008 × BMI − 0.006 × eGFR − 0.016 × hemoglobin (r2=0.901, P<0.0001). Again, the coefficient of determination was similar with or without hemoglobin; therefore, the conversion formula consisting of only BMI and eGFR is sufficient for clinical application.
The cutoff values of BNP and NT-proBNP for suspected HF were ≥40 pg/mL and ≥125 pg/mL, respectively. Patients may have a decreased likelihood of having HF when values are below these cutoff values. By contrast, when the BNP or NT-proBNP value is ≥200 pg/mL or ≥900 pg/mL, respectively, the likelihood of HF increases. From analysis of the distribution of BNP and NT-proBNP values, BNP values <40 pg/mL mostly corresponded to NT-proBNP values <125 pg/mL, and BNP values ≥200 pg/mL mostly corresponded to NT-proBNP values ≥900 pg/mL. Additionally, BNP values between 40 and 200 pg/mL were associated with wide variations in the corresponding NT-proBNP values. Based on these findings, our conversion formula seems to be particularly useful for speculating the corresponding value of NT-proBNP when the BNP value is between 40 and 200 pg/mL.
Sacubitril/valsartan is being widely used in the treatment of HF, which has led to increased use of NT-proBNP values because they are not affected by these medications. The BNP value calculated from the actual NT-proBNP value using our conversion formula is considered to be the endogenous BNP value generated in the same manner as NT-proBNP. The difference between the actual and calculated BNP values shown in Figure 7 represents an increase in BNP through inhibition of its degradation. It is difficult to evaluate the course of HF using BNP values because they are modified by sacubitril/valsartan. However, it is possible to speculate the BNP values unaffected by sacubitril/valsartan using this conversion formula.
Study Limitations
First, the conversion formula is not applicable when BNP values are measured using assay kits other than those used in this study. The differences in antibodies or standards that might affect the BNP level measurement were not taken into consideration. Second, this conversion formula was created using log-transformed values of BNP and NT-proBNP. It is impossible to calculate non-log values using mental calculations, so we developed an easy-to-use application for this conversion formula, which is free to download from the Supplementary Figures 1,2. Finally, in patients receiving sacubitril/valsartan, this conversion formula can be used to convert from NT-proBNP to BNP, but not from BNP to NT-proBNP because BNP is affected by neprilysin inhibitors.
Conclusions
We established a new, simple, and useful formula that converts BNP values to NT-pro BNP values using eGFR and BMI values. This formula will assist clinicians in the new era of HF treatment.
Sources of Funding
This work was supported by Roche Diagnostics.
Disclosures
Y. Saito has received consultancy annual income from a single company or organization which exceeds an annual total of 1,000,000 yen from Novartis Pharma K.K. Y. Saito has received remuneration which exceeds an annual total of 500,000 yen per company or organization from Novartis Pharma K.K., and Otsuka Pharmaceutical Co., Ltd. Y. Saito has received research funds provided by a single company or organization which exceeds an annual total of 1,000,000 yen from Roche Diagnostics K.K., Daiichi Sankyo Co., Ltd., Amgen K.K., and Kowa Pharmaceutical Co., Ltd. Y. Saito has received scholarship funds granted by a single company or organization which exceeds an annual amount of 1,000,000 yen from Medtronic, Inc., Otsuka Pharmaceutical Co., Ltd., Bayer Holding Ltd, Daiichi Sankyo Co., Ltd., Mitsubishi Tanabe Pharma Corporation, Takeda Pharmaceutical Co., Ltd., and LSI Medience Corporation.
Y. Sakata, K. Kario, Y. Saito are members of Circulation Journal’s Editorial Team. The remaining authors have no conflicts of interest to declare.
Ethics Approval
This study was approved by the Ethics Committee of Nara Medical University (approval no. 1,800) and was conducted in accordance with the Declaration of Helsinki. Oral informed consent was given by all the study patients at Nara Medical University. All participants provided written informed consent for the J-HOP study, and the use of data in this study was presented on an opt-out basis (Jichi Medical University approval no. 20-051). Because all data at Osaka University Graduate School of Medicine were collected for medical treatment, information on conducting research, including the purpose of the research, was released on an opt-out basis (Osaka University approval no. 20231-2). The data from the Hiramitsu Heart Clinic were also collected for medical treatment, and oral informed consent was obtained for the use of the data in this study (Ethics Committee of Nara Medical University, approval no. 1,800).
Data Availability
The deidentified participant data will not be shared.
Supplementary Files
Please find supplementary file(s);
https://doi.org/10.1253/circj.CJ-22-0032
References
- 1.
Hall C. NT-ProBNP: The mechanism behind the marker. J Card Fail 2005; 11(Suppl): S81–S83.
- 2.
Hall C. Essential biochemistry and physiology of (NT-pro) BNP. Eur J Heart Fail 2004; 6: 257–260.
- 3.
Lainchbury JG, Campbell E, Frampton CM, Yandle TG, Nicholls MG, Richards AM. Brain natriuretic peptide in the diagnosis of heart failure in patients with acute shortness of breath. J Am Coll Cardiol 2003; 42: 728–735.
- 4.
Nielson LS, Svanegaard J, Klitgaard NA, Egeblad H. N-terminal pro-brain natriuretic peptide for discriminating between cardiac and non-cardiac dyspnoea. Eur J Heart Fail 2004; 6: 63–70.
- 5.
Kagiyama N, Kitai T, Hayashida A, Yamaguchi T, Okumura T, Kida K, et al. Prognostic value of BNP reduction during hospitalization in patients with acute heart failure. J Card Fail 2019; 25: 712–721.
- 6.
Sugiura T, Takase H, Toriyama T, Goto T, Ueda R, Dohi Y. Circulating levels of myocardial proteins predict future deterioration of congestive heart failure. J Card Fail 2005; 11: 504–509.
- 7.
Hoshide S, Kanegae H, Kario K. Nighttime home blood pressure as a mediator of N-terminal pro-brain natriuretic peptide in cardiovascular events. Hypertens Res 2021; 44: 1138–1146.
- 8.
Taki M, Ishiyama Y, Mizuno H, Komori T, Kono K, Hoshide S, et al. Sex differences in the prognostic power of brain natriuretic peptide and N-terminal pro-brain natriuretic peptide for cardiovascular events: The Japan Morning Surge-Home Blood Pressure Study. Circ J 2018; 82: 2096–2102.
- 9.
Troughton RW, Frampton CM, Yandle TG, Espiner EA, Nicholls MG, Richards AM. Treatment of heart failure guided by plasma aminoterminal brain natriuretic peptide (N-BNP) concentrations. Lancet 2000; 355: 1126–1130.
- 10.
Jourdain P, Jondeau G, Funck F, Gueffet P, Le Helloco A, Donal E, et al. Plasma brain natriuretic peptide-guided therapy to improve outcome in heart failure: The STARS-BNP multicenter study. J Am Coll Cardiol 2007; 49: 1733–1739.
- 11.
Madamanchi C, Alhosaini H, Sumida A, Runge MS. Obesity and natriuretic peptides, BNP and NT-proBNP: Mechanisms and diagnostic implications for heart failure. Int J Cardiol 2014; 176: 611–617.
- 12.
Standeven KF, Hess K, Carter AM, Rice GI, Cordell PA, Balmforth AJ, et al. Neprilysin, obesity and the metabolic syndrome. Int J Obes (Lond) 2011; 35: 1031–1040.
- 13.
Hoshide S, Yano Y, Haimoto H, Yamagiwa K, Uchiba K, Nagasaka S, et al. Morning and evening home blood pressure and risks of incident stroke and coronary artery disease in the Japanese general practice population: The Japan Morning Surge-Home Blood Pressure study. Hypertension 2016; 68: 54–61.
- 14.
Matsuo S, Imai E, Horio M, Yasuda Y, Tomita K, Nitta K, et al. Collaborators developing the Japanese equation for estimated GFR: Revised equations for estimated GFR from serum creatinine in Japan. Am J Kidney Dis 2009; 53: 982–992.
- 15.
Fu S, Ping P, Zhu Q, Ye P, Luo L. Brain natriuretic peptide and its biochemical, analytical, and clinical issues in heart failure: A narrative review. Front Physiol 2018; 9: 692.
- 16.
Srisawasdi P, Vanavanan S, Charoenpanichkit C, Kroll MH. The effect of renal dysfunction on BNP, NT-proBNP, and their ratio. Am J Clin Pathol 2010; 133: 14–23.
- 17.
McCullough PA, Duc P, OmLand T, McCord J, Nowak RM, Hollander JE, et al. B-type natriuretic peptide and renal function in the diagnosis of heart failure: An analysis from the Breathing Not Properly Multinational Study. Am J Kidney Dis 2003; 41: 571–579.
- 18.
Horwich TB, Hamilton MA, Fonarow GC. B-type natriuretic peptide levels in obese patients with advanced heart failure. J Am Coll Cardiol 2006; 47: 85–90.
- 19.
Horii M, Matsumoto T, Uemura S, Sugawara Y, Takitsume A, Ueda T, et al. Prognostic value of B-type natriuretic peptide and its amino-terminal proBNP fragment for cardiovascular events with stratification by renal function. J Cardiol 2013; 61: 410–416.
- 20.
Mizuri T, Satoshi H, Ken K, Kazuomi K. Correlation between B-Type natriuretic peptide and N-terminal pro-B-type natriuretic peptide in a large Japanese population at risk of stage A heart failure. Pulse 2018; 6: 1–8.
- 21.
Kasahara S, Sakata Y, Nochioka K, Miura M, Abe R, Sato M, et al. Conversion formula from B-type natriuretic peptide to N-terminal proBNP values in patients with cardiovascular diseases. Int J Cardiol 2019; 280: 184–189.
- 22.
Susan V, Price CP, John RI, Abbas NA, Webb MC, Kempson ME, et al. B-type natriuretic peptide (BNP) and amino-terminal proBNP in patients with CKD: Relationship to renal function and left ventricular hypertrophy. Am J Kidney Dis 2005; 46: 610–620.
- 23.
Almirez R, Protter AA. Clearance of human brain natriuretic peptide in rabbits; Effect of the kidney, the natriuretic peptide clearance receptor, and peptidase activity. J Pharmacol Exp Ther 1999; 289: 976–980.
- 24.
Wang T, Larson M, Levy D, Benjamin EJ, Leip EP, Wilson PWF, et al. Impact of obesity on plasma natriuretic peptide levels. Circulation 2004; 109: 594–600.
- 25.
Das SR, Drazner MH, Dries DL, Vega GL, Stanek HG, Abdullah SM, et al. Impact of body mass and body composition on circulating levels of natriuretic peptides: Results from the Dallas Heart Study. Circulation 2005; 112: 2163–2168.
- 26.
Frankenstein L, Remppis A, Nelles M, Schaelling B, Schellberg D, Katus H, et al. Relation of N-terminal pro-brain natriuretic peptide levels and their prognostic power in chronic stable heart failure to obesity status. Eur Heart J 2008; 29: 2634–2640.
- 27.
Krauser D, Lloyd-Jones DM, Chae C, Cameron R, Anwaruddin S, Baggish AL, et al. Effect of body mass index on natriuretic peptide levels in patients with acute congestive heart failure: A ProBNP Investigation of Dyspnea in the Emergency Department (PRIDE) substudy. Am Heart J 2005; 149: 744–750.
- 28.
Sengenes C, Berlan M, De Glisezinski I, Lafontan M, Galitzky J. Natriuretic peptides: A new lipolytic pathway in human adipocytes. FASEB J 2000; 14: 1345–1351.
- 29.
Sarzani R, Dessi-Fulgheri P, Paci VM, Espinosa E, Rappelli A. Expression of natriuretic peptide receptors in human adipose and other tissues. J Endocrinol Invest 1996; 19: 581–585.
- 30.
Trevisan R, Fioretto P, Semplicini A, Opocher G, Mantero F, Rocco S, et al. Role of insulin and atrial natriuretic peptide in sodium retention in insulin-treated IDDM patients during isotonic volume expansion. Diabetes 1990; 39: 289–298.
- 31.
Abouchacra S, Baines AD, Zinman B, Skorecki KL, Logan AG. Insulin blunts the natriuretic action of atrial natriuretic peptide in hypertension. Hypertension 1994; 23: 1054–1058.
- 32.
Jensen J, Ma LP, Fu MLX, Svaninger D, Lundberg PA, Hammarsten O. Inflammation increases NT-proBNP and the NT-proBNP/BNP ratio. Clin Res Cardiol 2010; 99: 445–452.
- 33.
Hogenhuis J, Voors AA, Jaarsma T, Hoes AW, Hillege HL, Kragten JA, et al. Anaemia and renal dysfunction are independently associated with BNP and NT-proBNP levels in patients with heart failure. Eur J Heart Fail 2007; 9: 787–794.