Abstract
Two new lignans (7S,7′R,8S,8′R)-3,3′-dimethoxy-7,7′-epoxylignan-4,4′,9-triol 4-O-β-D-glucopyranoside (1) and 9-O-formylaviculin (2) together with other thirteen known secondary metabolites were isolated from the leaves of Antidesma hainanensis. Their chemical structures were determined using NMR, electrospray ionization (ESI)-MS, circular dichroism (CD) spectroscopic methods, and as well as by comparison with those reported in the literature. Neuro-inflammatory activity of isolated compounds was evaluated by their inhibition on nitric oxide (NO) production in activated BV2 microglial cells. At concentration of 40 µM, compounds 1–3, 5, 7, 8, 9, 14, and 15 exhibited inhibitory effects over 50%, suggesting that they could be potential candidate drugs for the cure of neuro-inflammation. In addition, compounds 1, 8, 14, and 15 significantly inhibited 16.23, 27.76, 21.23, and 29.44% NO production at diluted concentration as low as 2.5 µM.
Microglia are a type of primary immune cells in the central nervous system (CNS). These cells have been regarded to play important roles in neuro-inflammation process and lead to variety of neurodegenerative disorders such as multiple sclerosis, Alzheimer’s disease, and Parkinson’s disease.1,2) Microglial cells are stimulated by various stimuli to release bioactive molecules including nitric oxide (NO), prostaglandin E2, tumor necrosis factor-α, interleukin (IL)-1β, and IL-6.3) The over production of these cytokines and pro-inflammatory mediators can cause cell death and CNS damage. Therefore, compounds inhibit the production of cytokines and pro-inflammatory mediators in activated microglial cells would be potential candidate drugs in the prevention/treatment of neuro-inflammation.
Antidesma is a genus of tropical plants belonging to Euphorbiaceae family, comprising more than 100 species. Some of them produce edible fruits and possess medicinal properties.4–6) The study of the chemical composition showed this genus contains alkaloids, megastigmanes, lignans, and polyphenols which caused anti-inflammatory, antifungal, cytotoxic, and antioxidant activities.7) In our research program on anti-inflammatory candidate drugs from Antidesma species, herein, we report the isolation and structure elucidation of two new lignans, NMR reassignment of β-D-glucopyranosyl phaseate, together with thirteen known secondary metabolites from the leaves of A. hainanensis. In addition, the neuro-inflammatory activity of isolated compounds was evaluated through inhibiting NO production in activated BV2 microglial cells. This is the first report on both chemical and biological studies of A. hainanensis up to date.
Results and Discussion
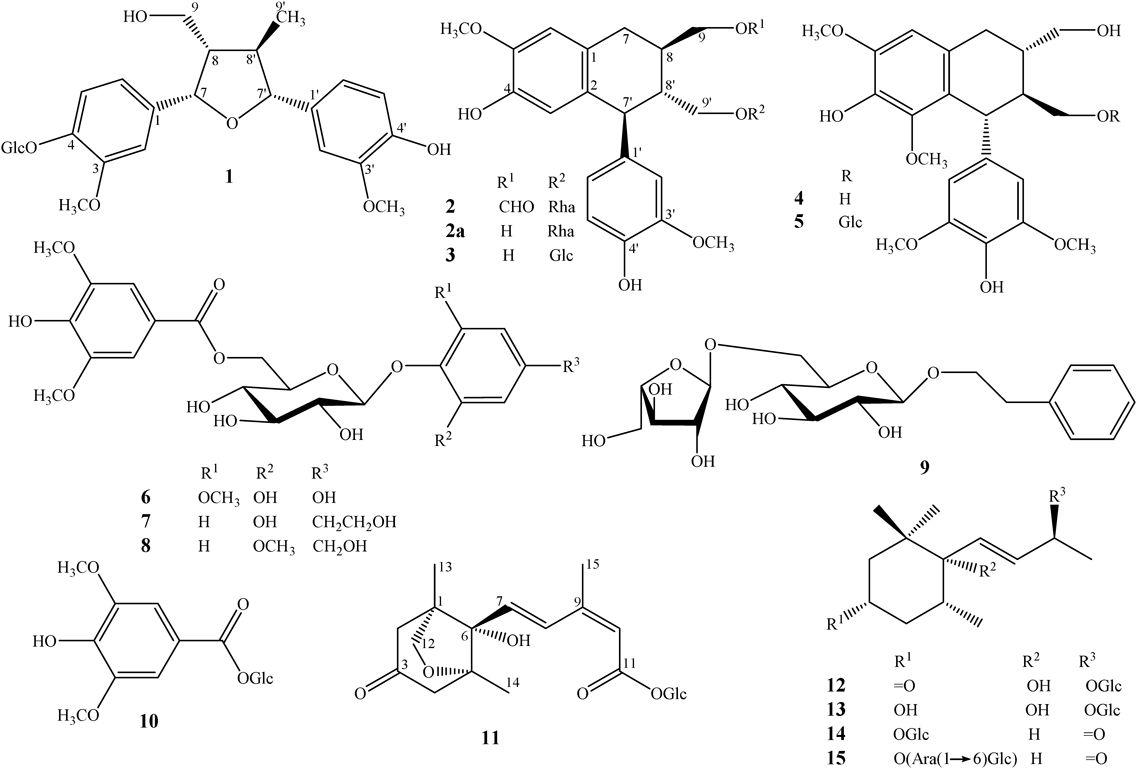
The leaves of A. hainanensis were macerated in methanol and resulted methanol extract was successively separated by n-hexane, dichloromethane, ethyl acetate to give four soluble fractions n-hexane (AH1), dichloromethane (AH2), ethyl acetate (AH3), and water layer (AH4). Based on TLC analysis, fractions AH1 and AH2 showed rich of chlorophyll, less polar compounds, and/or blurred TLC monitoring which were not further purified in this study. Fractions AH3 and AH4 were purified using various column chromatographies to give 15 secondary metabolites (1–15). Their chemical structures were identified as shown in the Fig. 1.
Compound 1 was obtained as a pale yellow amorphous powder. Its molecular formula was determined to be C26H34O11 by high resolution-electrospray ionization (HR-ESI)-MS (m/z 545.1995 [M+Na]+; Calcd for C26H34O11Na, 545.1999) and 13C-NMR analysis, indicating ten indices of hydrogen deficiency. The 1H-NMR spectra of 1 appeared resonant signals including six olefinic protons of two set of ABX spin-coupled systems at δH 7.18 (1H, d, J=8.5 Hz), 7.10 (1H, d, J=1.5 Hz), 7.08 (1H, d, J=1.5 Hz), 6.99 (1H, dd, J=1.5, 8.5 Hz), 6.97 (1H, dd, J=1.5, 8.5 Hz), and 6.84 (1H, d, J=8.5 Hz); two oxygenated methines at δH 5.20 (1H, d, J=8.5 Hz), 4.40 (1H, d, J=9.0 Hz); an anomeric proton at δH 4.92 (1H, d, J=7.5 Hz), two methoxy groups at δH 3.91 and 3.88 (each 3H, s); and a secondary methyl group at δH 1.14 (d, J=6.5 Hz). The 13C-NMR spectra of 1 revealed signals of 26 carbons which were divided into six non-protonated carbons, 15 methines, two methylenes, and three methyl carbons. Among them, an anomeric and five oxygenated aliphatic carbons (δC 102.8, 78.2, 77.8, 74.9, 71.4, 62.5) were assigned for a glucose unit. Carbon signals of two methoxy groups were observed at δC 56.7 and 56.5. Remaining 18 carbons belonged to aglycone moiety. Aforementioned data, the deshielded oxygenated methines C-7 (δC 82.6), C-7′ (δC 89.3) and ten indices of hydrogen deficiency of 1 suggested that 1 was a tetrahydrofuran lignan glycoside.8) The correlation spectroscopy (COSY) cross peaks observed, including H-7 (δH 5.20)/H-8 (δH 2.40)/H-8ʹ (δH 2.08)/H-7′ (δH 4.40), H-8/H2-9 (δH 3.29, 3.21), and H-8′/ H3-9′ (δH 1.14) which was supported for a tetrahydrofuran lignan skeleton. The chemical shift of C-9 (δC 63.6) and heteronuclear multiple bond connectivity (HMBC) correlations of H2-9 (δH 3.29, 3.21) and carbons C-7 (δC 82.6)/C-8 (δC 54.4)/C-8′ (δC 46.2) indicated for a free hydroxyl group at C-9. The HMBC correlations from both protons H-2 (δH 7.08) and H-6 (δH 6.99) to carbons C-4 (δC 147.2) and C-7 (δC 82.6), from anomeric proton H-1″ (δH 4.92) to C-4 were demonstrated for the location of an O-glycosidic linkage at C-4. Similarly, a free hydroxyl group at C-4′ was also confirmed by its carbon chemical shift (δC 147.6), and HMBC correlations of protons H-2′ (δH 7.10), H-6′ (δH 6.97) with C-4′ and C-7′ (δC 89.3). Two methoxy groups located at C-3 and C-3′ which were proved by strong HMBC correlations of H-5 (δH 7.18), 3-OCH3 (δH 3.88)/C-3 (δC 150.4); and H-5′ (δH 6.84), 3′-OCH3 (δH 3.91)/C-3′ (δC 149.1), respectively. Next, absolute configuration of 1 was established by nuclear Overhauser effect spectroscopy (NOESY) and circular dichroism (CD) spectrum. The NOESY correlations of H-7 (δH 5.20)/H-8 (δH 2.40)/H3-9′ (δH 1.14)/H-7′ (δH 4.40) suggested that they were in close proximity and assumed locating all β-orientations. Furthermore, the CD spectrum of 1 displayed close similarity Cotton effects [λmax (mdeg) 238 (+0.28) and 223 (−0.36)] with those of schisphenlignan G [λmax (Δε): 236 (+1.60) and 219 (−0.23)],9) indicating that 1 had the same 7S,7′R,8S,8′R-configurations. The 7S and 7′R configurations was further explained by a coupled CD curve possessing positive exciton chirality rule in the CD spectrum of 1.10) Finally, acid hydrolysis of 1 obtained D-glucose which was confirmed by TLC and GC analysis, indicating the presence of D-glucose in the structure of 1.11) Consequently, compound 1 was determined to be (7S,7′R,8S,8′R)-3,3′-dimethoxy-7,7′-epoxylignan-4,4′,9-triol 4-O-β-D-glucopyranoside.
Compound 2 had a molecular formula C27H34O11, as indicated by HR-ESI-MS (m/z 557.1991 [M+Na]+; Calcd for C27H34O11Na, 557.1999) and 13C-NMR data. The 1H- and 13C-NMR spectra of 2 included signals five olefinic protons belonging to an ABX [δH 6.79 (d, J=8.0 Hz), 6.67 (d, J=2.0 Hz), 6.62 (dd, J=2.0, 8.0 Hz)] and an AX [δH 6.68 (1H, s) and 6.20 (1H, s)] spin-coupled systems; carbon signals of two set of C-7–C-9, C-7′–C-9′ at δC 33.7 (CH2), 37.8 (CH), 67.3 (CH2); and 48.5 (CH), 45.8 (CH), 68.1 (CH2), respectively, indicating that 2 belonged to an aryltetralin lignan.12) Furthermore, the 13C-NMR data 2 was identical with those of aviculin (2a), except signals of C-8 (δC 37.8), C-9 (δC 67.3) and an additional carbon signals at δC 163.1 (CH) which were suggested compound 2 to be an aviculin derivative.13) A proton signals at δH 8.12 (1H, s) and its one bond heteronuclear single quantum coherence (HSQC) correlation with carbon at δC 163.1 were characterized for a formyl group.14) The HMBC correlations from formyl proton (δH 8.12) and H-7 (δH 2.88, 2.84) to carbon C-9 (δC 67.3) were confirmed formyl group at C-9. Location of sugar moiety at C-9′ was also indicated by a strong HMBC correlation between anomeric proton H-1″ (δH 4.54) and carbon C-9′ (δC 68.1). The presence of L-rhamnose moiety in 2 was reconfirmed by its 13C-NMR data (δC 102.2 73.8, 72.5, 72.3, 17.8), acid hydrolysis and GC analysis as described previously.11) Absolute configuration of 2 was determined to be 8R,7′S,8′R-configurations by same Cotton effects in CD spectrum of 2 [λmax (mdeg): 239 (+2.51), 276 (+3.00), 293 (−2.53) nm] compared with literature.15) Thus, compound 2 was determined as 9-O-formylaviculin.
Unlike compounds 1 and 2, the NMR data of 11 (Table 1) indicated that it was an isoprenoid glycoside, namely β-D-glucopyranosyl phaseate (compound 11). The compound 11 was first reported from tomato shoots (Lycopersicon esculentum).16) Its structure was previously established by GC analysis and NMR spectral characterization of its acetyl derivatives. However, NMR data of 11 has not been reported to date. Thus, we re-assigned 1H- and 13C-NMR data of this compound using two dimensional (2D)-NMR experiments as shown in the Table 1. Absolute configuration of 11 was confirmed to be 1R,5R,6S,7E,9Z-configurations by a minimum negative Cotton effect at wavelength 244 nm [CD (mdeg): −5.48] in its CD spectrum.17)
Table 1.
1H- and
13C-NMR Data for Compounds
1,
2, and
11| No. | 1 | 2 | No. | 11 |
|---|
| δCa,b) | δHa,c) (mult., J in Hz) | δCa,b) | δHa,c) (mult., J in Hz) | δCa,b) | δHa,c) (mult., J in Hz) |
|---|
| 1 | 135.8 | — | 128.1 | — | 1 | 49.3 | — |
| 2 | 112.7 | 7.08 (d, 1.5) | 133.7 | — | 2 | 53.2 | 2.73 (dd, 2.5, 18.0) |
| | | | | | | 2.41 (dd, 2.5, 18.0) |
| 3 | 150.4 | — | 117.2 | 6.20 (s) | 3 | 210.1 | — |
| 4 | 147.2 | — | 145.5 | — | 4 | 54.0 | 2.83 (br d, 18.0) |
| | | | | | | 2.49 (dd, 2.5, 18.0) |
| 5 | 117.4 | 7.18 (d, 8.5) | 147.4 | — | 5 | 87.8 | — |
| 6 | 120.7 | 6.99 (dd, 1.5, 8.5) | 112.4 | 6.68 (s) | 6 | 83.0 | — |
| 7 | 82.6 | 5.20 (d, 8.5) | 33.7 | 2.88 (dd, 5.5, 16.0) | 7 | 134.9 | 6.56 (d, 16.0) |
| | | | 2.84 (dd, 6.0, 16.0) | | | |
| 8 | 54.4 | 2.40 (m) | 37.8 | 2.26 (m) | 8 | 132.8 | 8.17 (d, 16.0) |
| 9 | 63.6 | 3.29 (dd, 7.5, 10.5) | 67.3 | 4.37 (dd, 3.5, 11.0) | 9 | 153.8 | — |
| | 3.21 (dd, 6.5, 10.5) | | 4.28 (dd, 7.0, 11.0) | | | |
| 3/5-OCH3 | 56.7 | 3.88 (s) | 56.4 | 3.83 (s) | 10 | 118.3 | 5.88 (br s) |
| 1′ | 133.0 | — | 137.8 | — | 11 | 166.0 | — |
| 2′ | 111.7 | 7.10 (d, 1.5) | 113.7 | 6.67 (d, 2.0) | 12 | 78.5 | 3.97 (dd, 2.5, 7.5) |
| | | | | | | 3.69* |
| 3′ | 149.1 | — | 149.2 | — | 13 | 17.4 | 1.04 (s) |
| 4′ | 147.6 | — | 146.3 | — | 14 | 19.4 | 1.24 (s) |
| 5′ | 116.2 | 6.84 (d, 8.5) | 116.2 | 6.79 (d, 8.0) | 15 | 21.3 | 2.13 (d, 1.5) |
| 6′ | 120.7 | 6.97 (dd, 1.5, 8.5) | 123.2 | 6.62 (dd, 2.0, 8.0) | Glc | | |
| 7′ | 89.3 | 4.40 (d, 9.0) | 48.5 | 3.85* | 1 | 95.5 | 5.55 (d, 8.5) |
| 8′ | 46.2 | 2.08 (m) | 45.8 | 1.94 (m) | 2 | 74.0 | 3.39 (m) |
| 9′ | 16.6 | 1.14 (d, 6.5) | 68.1 | 3.78 (dd, 2.0, 10.0) | 3 | 78.8 | 3.43 (m) |
| | | | 3.18 (dd, 4.0, 10.0) | | | |
| 3′-OCH3 | 56.5 | 3.91 (s) | 56.4 | 3.80 (s) | 4 | 71.1 | 3.38 (m) |
| CHO | | | 163.1 | 8.12 (s) | 5 | 78.0 | 3.41 (m) |
| Glc/Rha | | | | | 6 | 62.3 | 3.86 (dd, 2.0, 12.0) |
| | | | | | | 3.69* |
| 1″ | 102.8 | 4.92 (d, 7.5) | 102.2 | 4.54 (br s) | | | |
| 2″ | 74.9 | 3.53 (dd, 7.5, 9.0) | 72.3 | 3.87 (br s) | | | |
| 3″ | 77.8 | 3.49 (dd, 9.0, 9.0) | 72.5 | 3.66 (dd, 3.5, 9.5) | | | |
| 4″ | 71.4 | 3.42* | 73.8 | 3.35* | | | |
| 5″ | 78.2 | 3.42* | 70.1 | 3.47 (m) | | | |
| 6″ | 62.5 | 3.90* | 17.8 | 1.16 (d, 6.0) | | | |
| | 3.71 (dd, 5.0, 12.0) | | | | | |
Measured in a) CD3OD, b) 125 MHz, c) 500 MHz. Assignments were done by HSQC, HMBC, COSY, and NOESY experiments. * Overlapped signals.
The other compounds were determined to be isolariciresinol 9′-O-β-D-glucopyranoside (3),18) lyoniresinol (4),19) lyoniresinol 9′-O-β-D-glucopyranoside (5),19) 1-O-(2′,4′-dihydroxy-6′-methoxyphenyl)-6-O-(4″-hydroxy-3″,5″-dimethoxybenzoyl)-β-D-glucopyranoside (6),20) 4′-O-[6″-O-(4‴-hydroxy-3‴,5‴-dimethoxybenzoyl)-β-D-glucopyranosyl]-3′-hydroxyphenethyl alcohol (7),21) 4-hydroxymethyl-2-methoxyphenyl-6′-O-syringoyl-β-D-glucopyranoside (8), phenethyl-6-O-α-L-arabinofuranosyl-β-D-glucopyranoside (9),22) 1-O-syringoyl-β-D-glucopyranoside (10),23) ampelopsisionoside (12),24) alangioside (13),24) alangionoside L (14),25) megastigm-7-ene-3-ol-9-one 3-O-[α-L-arabionfuranosyl-(1→6)-β-D-glucopyranoside] (15).26) Their physico-chemical properties were well consisted with those reported in the literature.
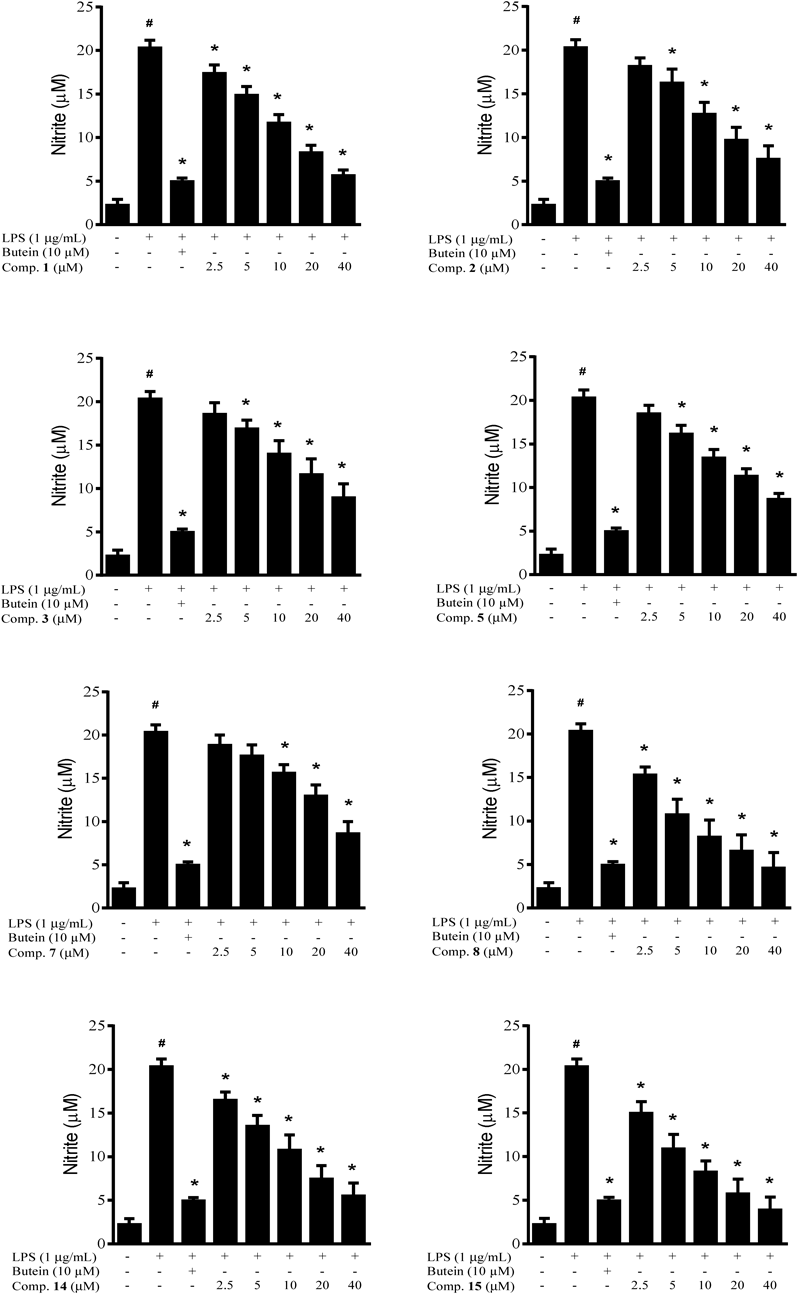
To evaluate anti-neuroinflammatory activity of isolated metabolites, the compounds 1–15 were firstly screened their effects on lipopolysaccharide (LPS)-induced NO production on BV2 microglial cells. At a concentration of 40 µM, eight compounds 1–3, 5, 7, 8, 14, and 15 significantly inhibited over 50% NO production in activated microglial cells meanwhile they did not affect to cell viability (cell viability in the range of 90–110%) which were chosen for dose-dependent study. Other compounds (4, 6, 9–13) reducing less than 50% NO production level were considered to be inactivity. The mentioned active compounds were then examined their inhibitory effects at series concentrations (2.5–40 µM) (Fig. 2). Butein (10 µM) was used as a positive control throughout all experiments. Its inhibitory rate was 85.02% in our experiment system. Although the number of compound analogous is not huge enough, however our results might primarily show that lignan glycosides (1–3, 5) exhibited higher inhibitory effects than an aglycone (4). Among phenyl derivatives (6–10), only compounds 7 and 8 (10 µM) significantly reduced NO production level with inhibitory values of 26.01 and 67.12%, respectively. Two compounds (14, 15) of five megastigmane derivatives (11–15) displayed inhibitory effects (21.23 to 90.83%) at all of tested concentrations. At concentration as low as 2.5 µM, only four of the selected compounds (1, 8, 14, 15) significantly displayed inhibitory effects on NO production in activated microglial cells with their inhibitory values of 16.23, 27.76, 21.23, and 29.44%, respectively. Lignans and megastigmanes are secondary metabolites naturally occurring in a huge variety in medicinal plants. Lignans have been known as potential anti-inflammatory agents by inhibition of NO production in macrophages.27) However, beside new lignans (1, 2), the anti-inflammatory activity of compounds 3, 5, 7, 8, 14, and 15 via inhibiting NO production in activated BV2 microglial cells have not been reported. Our results suggested that Antidesma hainanensis is rich of megastigmanes and phenolics as well as lignans, in particularly compounds 1–3, 5, 7, 8, 14, and 15, potential inhibiting NO production in activated BV2 microglial cells. They could be potential candidate drugs for the cure of neuro-inflammation.
Experimental
GeneralCD spectra and optical rotations were measured on a Chirascan spectrometer and Jasco DIP-370 automatic polarimeter, respectively. The NMR spectra were recorded on a Bruker AM500 FT-NMR spectrometer. HR-ESI-MS spectra were recorded on a LTQ Orbitrap XL Mass Spectrometer. Column chromatography was performed using either silica-gel (70–230 mesh and 230–400 mesh) or reverse phase (RP-18 resins, 150 µm). TLC was carried out using pre-coated silica-gel 60 F254 and RP-18 F254S plates. Spots were detected under UV radiation (254, 365 nm), sprayed with 10% H2SO4 solution followed by heating with heat gun.
Plant MaterialThe leaves of Antidesma hainanensis MERR. were collected in Tamdao, Vinhphuc province, Vietnam, in December, 2014 and identified by Dr. Nguyen Quoc Binh, Vietnam National Museum of Nature. A voucher specimen was deposited at Institute of Marine Biochemistry, VAST.
Extraction and IsolationThe dried leaves of A. hainanensis (3.7 kg) were extracted in MeOH three times using sonicator to yield 330 g of a dark solid extract. Crude extract was then suspended in water and successively partitioned with n-hexane, dichloromethane, and ethyl acetate to obtain n-hexane (AH1, 70 g), dichloromethane (AH2, 85 g), ethyl acetate (AH3, 62 g), and water layer (AH4, 110 g) after removal solvent in vacuo. The AH3 fraction (62 g) was chromatographed on a reverse phase column eluting with methanol–water (1 : 1.5, v/v) to give four smaller fractions (AH3A–AH3D). The AH3B fraction (6.2 g) was chromatographed on a silica gel column eluting with dichloromethane–methanol–water (10 : 1 : 0.5, v/v/v) to obtain five fractions (AH3B1–AH3B5). Preparative-TLC fractions AH3B1 and AH3B3 on a silica gel plate using dichloromethane–methanol–water (10 : 1 : 0.5, v/v/v) as a mobile phase yielded compounds 4 (6.0 mg) and 6 (15.0 mg). Fraction AH3B4 was purified on a reverse phase column, eluting with methanol–water (1 : 1.7, v/v) to yield compounds 7 and 12 (each 5.0 mg). Fraction AH3B5 was also loaded on a reverse phase column chromatography and eluted with methanol–water (1 : 2, v/v) to yield compounds 5 (6.0 mg) and 13 (5.0 mg). The water layer (AH4, 110 g) was chromatographed on a Diaion HP-20 column, eluting with water to remove sugar component, then increase concentration of methanol in water (25, 50, 75, 100% volume of methanol) to obtain four fractions, AH4A–AH4D, respectively. Based on TLC analysis, fractions AH4B and AH4C were combined and roughly separated on a silica gel column, eluting with dichloromethane–methanol (gradient from 100 : 1–0 : 1, v/v/v) to give four fractions (AH4B1–AH4B4). The AH4B3 fraction (15 g) was chromatographed on a silica gel column, eluting with dichloromethane–methanol–water (1 : 3 : 1, v/v/v) to obtain five sub-fractions (AH4B3A–AH4B3E). Fraction AH4B3A (0.3 g) was repeatedly chromatographed on a silica gel column, eluting with dichloromethane–methanol–water (7 : 1 : 0.05, v/v/v) to yield compounds 1 (8.0 mg) and 10 (10.0 mg). Compound 11 (11.0 mg) was isolated from fraction AH4B3B (1.0 g) by a silica gel column using ethyl acetate–methanol–water (12 : 1 : 0.05, v/v/v) as eluent. Fraction AH4B3C (1.5 g) was purified on a silica gel column chromatography, eluting with dichloromethane–acetone–water (1 : 1.7 : 0.1, v/v/v) to yield compounds 2 (11.0 mg), 3 (6.0 mg), and 9 (7.0 mg). Fraction AH4B3D (2.0 g) was chromatographed on a silica gel column, eluting with dichloromethane–acetone–water (1 : 1 : 0.1, v/v/v) to yield compounds 8 and 15 (each 6.0 mg). Finally, compound 14 (12.0 mg) was obtained from the AH4B3E fraction by column chromatography on a silica gel column eluting with dichloromethane–acetone–water (1 : 1.5 : 0.05, v/v/v).
(7S,7′R,8S,8′R)-3,3′-Dimethoxy-7,7′-epoxylignan-4,4′,9-triol 4-O-β-D-Glucopyranoside (1)Pale yellow amorphous powder, [α]D25 +24.1 (c=0.17, MeOH); CD (MeOH) λmax (mdeg): 223 (−0.36), 238 (+0.28); HR-ESI-MS m/z: 545.1995 [M+Na]+ (Calcd for C26H34O11Na, 545.1999); 1H- and 13C-NMR are given in Table 1.
9-O-Formylaviculin (2)Pale yellow amorphous powder, [α]D25 +32.6 (c=0.12, MeOH); CD (MeOH) λmax (mdeg): 216 (+2.77), 226 (−1.42), 239 (+2.51), 276 (+3.00), 293 (−2.53); HR-ESI-MS m/z: 557.1991 [M+Na]+ (Calcd for C27H34O11Na, 557.1999); 1H- and 13C-NMR are given in Table 1.
Cell Culture and StimulationBV2 microglial cells were received from Prof. Hyun Park (College of Pharmacy, Wonkwang University, Iksan, Korea). The cells were maintained at 5×10⁶ cells/dish in 100 mm dishes in Dulbecco’s modified Eagle’s medium (DMEM) supplemented with 10% heat-inactivated fetal bovine serum (FBS), penicillin G (100 units/mL), streptomycin (100 mg/mL), and L-glutamine (2 mM), and incubated at 37°C in a humidified atmosphere (5% CO2, 95% air). The cells (2×10⁴ cells/well) were cultured in 96-well tissue culture plates for 18 h, treated with various concentrations of compounds, and followed by stimulation with LPS (1 µg/mL) for another 24 h in incubator.
Cell ViabilityCell viability was measured by 3-(4,5-dimethylthiazol-2-yl)-2,5-diphenyltetrazolium bromide (MTT) assay as described previously.3) Briefly, MTT (final concentration of 0.5 mg/mL) was added at to the cell culture medium for 3 h and the formed formazan crystal was dissolved in acidic 2-propanol. Optical density was measured at 590 nm using a microplate reader (Bio-Rad, Hercules, CA, U.S.A.). The optical density of the formed formazan in control well (untreated with compounds) was considered to represent 100% cell viability.
Determination of NO ProductionThe nitrite concentration in the culture medium, an indicator of NO production, was measured by Griess reaction.3) Briefly, each supernatant (100 µL) was mixed with an equal volume of the Griess reagent (Solution A: 222488; Solution B: S438081, Sigma, St. Louis, MO, U.S.A.) and incubated at room temperature for 20 min. The absorbance of the mixture at 525 nm was determined using an enzyme-linked immunosorbent assay (ELISA) plate reader. The amount of nitrite in the samples was calculated from a standard curve which was built by NaNO2 serial dilution.
Statistical AnalysisThe data are expressed as the mean±standard deviation (S.D.) of at least three independent experiments. To compare groups, one-way ANOVA was used, followed Dunnett’s multiple comparison tests. The statistical analysis was performed with GraphPad Prism Software, version 3.03.
Acknowledgment
This research was supported by Vietnam National Foundation for Science and Technology Development (NAFOSTED) under Grant number 104.01-2013.05.
Conflict of Interest
The authors declare no conflict of interest.
References
- 1) Lull M. E., Block M. L., Neurotherapeutics, 7, 354–365 (2010).
- 2) Prinz M., Priller J., Nat. Rev. Neurosci., 15, 300–312 (2014).
- 3) Yoon C. S., Kim D. C., Lee D. S., Kim K. S., Ko W., Sohn J. H., Yim J. H., Kim Y. C., Oh H., Int. Immunopharmacol., 23, 568–574 (2014).
- 4) Iha A., Matsunami K., Otsuka H., Kawahata M., Yamaguchi K., Takeda Y., J. Nat. Med., 66, 664–670 (2012).
- 5) Nuengchamnong N., Ingkaninan K., Food Chem., 118, 147–152 (2010).
- 6) Patil P. C., Jadhav V. D., Mahadkar S. D., Pharm. Sin., 4, 136–142 (2013).
- 7) Puangpronpitag D., Yongvanit P., Boonsiri P., Suttajit M., Areejitranusorn P., Na H. K., Surh Y. J., Food Chem., 127, 1450–1458 (2011).
- 8) Martins R. C. C., Latorre L. R., Sartorelli P., Kato M. J., Phytochemistry, 55, 843–846 (2000).
- 9) Liang C. Q., Hu J., Luo R. H., Shi Y. M., Shang S. Z., Gao Z. H., Wang R. R., Zheng Y. T., Xiong W. Y., Zhang H. B., Xiao W. L., Sun H. D., Fitoterapia, 86, 171–177 (2013).
- 10) Li Y., Cheng W., Zhu C., Yao C., Xiong L., Tian Y., Wang S., Lin S., Hu J., Yang Y., Guo Y., Yang Y., Li Y., Yuan Y., Chen N., Shi J., J. Nat. Prod., 74, 1444–1452 (2011).
- 11) Nhiem N. X., Tai B. H., Quang T. H., Kiem P. V., Minh C. V., Nam N. H., Kim J. H., Im L. R., Lee Y. M., Kim Y. H., Bioorg. Med. Chem. Lett., 21, 1777–1781 (2011).
- 12) Jutiviboonsuk A., Zhang H., Tan G. T., Ma C., Van Hung N., Manh Cuong N., Bunyapraphatsara N., Soejarto D. D., Fong H. H., Phytochemistry, 66, 2745–2751 (2005).
- 13) Kim H. J., Woo E. R., Park H., J. Nat. Prod., 57, 581–586 (1994).
- 14) Park H. J., Lee J. C., Bull. Korean Chem. Soc., 29, 856–858 (2008).
- 15) Chin Y. W., Chai H. B., Keller W. J., Kinghorn A. D., J. Agric. Food Chem., 56, 7759–7764 (2008).
- 16) Carrington N. J., Vaughan G., Milborrow B. V., Phytochemistry, 27, 673–676 (1988).
- 17) Ngan N. T. T., Quang T. H., Tai B. H., Song S. B., Lee D., Kim Y. H., J. Agric. Food Chem., 60, 2815–2824 (2012).
- 18) Wen Q., Lin X., Liu Y., Xu X., Liang T., Zheng N., Kintoko, Huang R., Molecules, 17, 12330–12340 (2012).
- 19) Ohashi K., Watanabe H., Okumura Y., Uji T., Kitagawa I., Chem. Pharm. Bull., 42, 1924–1926 (1994).
- 20) Bicker J., Petereit F., Hensel A., Fitoterapia, 80, 483–495 (2009).
- 21) Furukawa M., Makino M., Ohkoshi E., Uchiyama T., Fujimoto Y., Phytochemistry, 72, 2244–2252 (2011).
- 22) Watanabe S., Hashimoto I., Hayashi K., Yagi K., Asai T., Knapp H., Straubinger M., Winterhalter P., Watanabe N., Biosci. Biotechnol. Biochem., 65, 442–445 (2001).
- 23) Klick S., Herrmann K., Phytochemistry, 27, 2177–2180 (1988).
- 24) De Marino S., Borbone N., Zollo F., Ianaro A., Di Meglio P., Iorizzi M., J. Agric. Food Chem., 52, 7525–7531 (2004).
- 25) Otsuka H., Yao M., Kamada K., Takeda Y., Chem. Pharm. Bull., 43, 754–759 (1995).
- 26) Li G. P., Zhao J. F., Tu Y. Q., Yang X. D., Zhang H. B., Li L., J. Integr. Plant Biol., 47, 362–367 (2005).
- 27) Zhang J., Chen J., Liang Z., Zhao C., Chem. Biodivers., 11, 1–54 (2014).