Abstract
An ultra-performance liquid chromatography (UPLC) method was developed and validated for the quantification of linezolid, PNU-142300, and PNU-142586 in human plasma. After protein precipitation using acetonitrile, the protein-free supernatant was separated using reverse-phase chromatography using an ACQUITY UPLC HSS T3 column and monitored at 254 nm. p-Toluic acid was used as the internal standard. No interference peak was observed at the retention times of linezolid, PNU-142300, PNU-142586, and p-toluic acid from blank plasma. The calibration curve of linezolid was linear from 0.2 to 50.0 µg/mL (coefficient of determination (r2) > 0.9999) and those of PNU-142300 and PNU-142586 were linear from 0.2 to 20.0 µg/mL (r2 > 0.9996 and > 0.9998, respectively). The intra- and inter-assay accuracy (%) and precision (relative standard deviation (RSD) %) of the three components were confirmed to meet the criteria of the U.S. Food and Drug Administration guidelines. Tests confirmed the stability of linezolid, PNU-142300, and PNU-142586 in plasma during three freeze-thaw cycles and long-term storage of frozen plasma for up to 30 d; in extracts they were stable in the UPLC autosampler for over 48 h at 4°C. Furthermore, plasma concentrations of linezolid, PNU-142300 and PNU-142586 in patients treated with linezolid could be measured using the UPLC method developed in this study. This assay would be a powerful tool for therapeutic drug monitoring and clinical pharmacokinetic/pharmacodynamic (PK/PD) analyses in the optimization of linezolid treatment.
Introduction
Linezolid is an oxazolidinone antibiotic with a broad spectrum of activity against Gram-positive bacteria, including methicillin-resistant Staphylococcus aureus (MRSA) and vancomycin-resistant enterococci (VRE).1–3) Linezolid selectively binds to the 50S subunit of bacterial ribosomes in the translation initiation reaction and inhibits the early stage of the protein synthesis process.4) Because of its high bioavailability, linezolid is available in both intravenous and oral formulations. It also has good tissue penetration5) and is used for the treatment of severe infections such as pneumonia and for skin and soft tissue infections. Unlike other anti-MRSA drugs, linezolid does not require therapeutic drug monitoring, and dosage adjustment according to renal function is unnecessary.6) In addition, linezolid is not a substrate or inhibitor of CYP, and the blood concentration level does not fluctuate in hepatic function disorder, so dosage adjustment based on liver function is unnecessary.7)
However, linezolid has the major adverse effect of myelosuppression, including anemia and thrombocytopenia. It has been reported that linezolid-associated thrombocytopenia is induced more frequently in patients with renal insufficiency than in those with normal renal function.8,9) The excretion of linezolid is thought to be decreased in patients with renal insufficiency, therefore, it accumulates in the blood. In addition, there are two major metabolites of linezolid: an aminoethoxyacetic acid, PNU-142300, and a hydroxyethyl glycine, PNU-142586.10) These metabolites are also likely to accumulate in the blood of patients with renal insufficiency.6) The mechanism of myelosuppression such as anemia and thrombocytopenia by linezolid or its metabolites has not been fully elucidated. Currently, it is unknown whether linezolid or its metabolites cause hematological toxicity. Therefore, in order to explain the mechanisms and risk factors of adverse effects and to prevent adverse effects during administration of linezolid, it is necessary to consider not only linezolid but also its metabolites. Hence, the plasma concentrations of linezolid and its metabolites in biological samples need to be measured.
Several methods for measuring linezolid using HPLC, ultra-performance LC (UPLC) and LC/MS have been developed.11–15) However, no methods have been reported to simultaneously quantify linezolid and its two major metabolites PNU-142300 and PNU-142586 in human plasma; therefore, in this study, we aimed to develop an UPLC method. Moreover, the method will be clinically applicable to pharmacokinetic and pharmacodynamic (PK/PD) analysis for optimization of linezolid treatment.
Experimental
Chemicals and ReagentsLinezolid was purchased from Sigma-Aldrich (Tokyo, Japan), PNU-142300 and PNU-142586 were purchased from Toronto Research Chemicals (Toronto, Canada), and the internal standard (IS), p-toluic acid (Fig. 1), was purchased from Wako Pure Chemical Industries, Ltd. (Osaka, Japan). Acetonitrile, 0.25 M potassium dihydrogen phosphate solution, and phosphoric acid were all of HPLC grade and purchased from Wako Pure Chemical Industries, Ltd. Plasma of a healthy volunteer was obtained from the Japanese Red Cross Society and used as the blank.
Instrumentation and Chromatographic ConditionsThe methods used in this study were improved by modifying previously reported methods.13) UPLC analyses were performed using an ACQUITY UPLC H-Class system (Waters, Milford, MA, U.S.A.) consisting of a quaternary solvent manager, sample manager-flow through needle, column heater, and photodiode array (PDA) detector. Chromatographic separation was performed using an ACQUITY UPLC HSS T3 column (1.8 µm, 2.1 × 100 mm) at 45°C.
The mobile phase was composed of buffer A (20 mM potassium dihydrogen phosphate buffer adjusted to pH 3.2 with ortho-phosphoric acid) and acetonitrile. Linezolid, PNU-142300, PNU-142586, and p-toluic acid were monitored at 254 nm. Chromatographic separation was performed at 0.40 mL/min with a 4 min run using the following gradient: 15% of acetonitrile from 0 to 0.33 min, 70% of acetonitrile at 1.00 min, 70% of acetonitrile from 1.00 to 1.73 min, and 15% of acetonitrile from 1.74 to 4.00 min.
Stock Solutions, Calibration Standards, and Quality Control SamplesLinezolid, PNU-142300, PNU-142586, and p-toluic acid stock solutions were prepared in water to obtain a final concentration of 1 mg/mL and stored at −30°C. Calibration standards were prepared at the beginning of each analytical run by serial dilution using blank plasma. The linezolid calibration curve concentrations were 0.2, 0.5, 1.0, 2.5, 5.0, 10.0, 25.0, and 50.0 µg/mL, and those of PNU-142300 and PNU-142586 were 0.2, 0.5, 1.0, 2.5, 5.0, 7.5, 10.0, and 20.0 µg/mL. Quality control (QC) samples of linezolid were prepared similarly to obtain a final concentration of 0.2 (lower limit of quantification, (LLOQ)), 0.6 (low QC), 6.0 (medium QC), and 40.0 (high QC) µg/mL and the PNU-142300 and PNU-142586 QC samples were 0.2 (LLOQ), 0.6 (low QC), 6.0 (medium QC), and 15.0 (high QC) µg/mL.
Sample PreparationSample pretreatment involved mixing 100 µL plasma samples with 5 µL IS in a 1.5 mL centrifuge tube. To precipitate the proteins, 200 µL acetonitrile was added, and the mixture was vortexed and centrifuged at 15000 rpm for 10 min at 4°C. A 100 µL aliquot of the supernatant was then transferred into a fresh centrifuge tube, 500 µL of buffer A was added, and the mixture was vortexed. Then, 8 µL of the final solution was injected into the column.
Method ValidationThe analytical method was validated for selectivity, calibration curve linearity, accuracy, precision, recovery, and stability, according to the U.S. Food and Drug Administration (FDA) guidelines.16)
SelectivityTo confirm the absence of interfering peaks from endogenous matrix components, selectivity testing was carried out using six different blank plasma samples.
Calibration CurveThe calibration curve was constructed using the peak area ratios of linezolid, PNU-142300, and PNU-142586 relative to the IS against the nominal calibration standard concentration. The calibration curve was calculated using linear least-squares regression analysis weighting: 1/y2.
The LLOQs of linezolid, PNU-142300, and PNU-142586 were defined as the lowest concentration of the calibration standards that could be measured with acceptable accuracy and precision.
Accuracy and PrecisionIntra-assay accuracy and precision were determined by analyzing five replicates of QC samples on the same day. Inter-assay accuracy and precision were analyzed using similar QC samples on 5 different days. Accuracy was calculated as a percentage error, whereas precision was expressed as the relative standard deviation (RSD %) of each QC concentration. The acceptance limits were defined as accuracy between 85–115% and precision of <15%, except at the LLOQs, which were defined as accuracy between 80–120% and precision of <20%.
RecoveryThe recovery of linezolid, PNU-142300, PNU-142586, and IS was calculated by comparing the peak areas of the low-, medium- and high-QC samples prepared in plasma (extracted) with those obtained from a set of QC samples prepared in water (unextracted).
StabilityStability experiments were performed to detect the degradation of linezolid, PNU-142300, and PNU-142586 under relevant conditions. In the stability test, freeze-thaw, long-term, and post-preparative stabilities were evaluated using low- and high-QC samples. Each sample was divided into control and storage samples before the start of each stability test and differences in the means were compared. To test freeze-thaw stability, QC samples were stored at −30°C for 24 h and then thawed unassisted at room temperature. When completely thawed, the samples were refrozen for 24 h under the same conditions. The freeze-thaw cycle was repeated two more times and then analyzed on the third cycle. Long-term stability was evaluated using QC samples stored at −30°C for 30 d. Post-preparative stability was assessed by comparing freshly prepared QC samples injected immediately after preparation with those left in the autosampler for 48 h.
Clinical ApplicationThe method described in the previous section was used to quantify linezolid and its metabolites PNU-142300 and PNU-142586 in plasma samples of patients who were treated with intravenous linezolid (600 mg twice daily) at the Osaka City University Hospital. The patients (n = 5) who provided consent in person were evaluated as subjects in the present study. Blood samples were collected under steady state conditions 3 d or more after administration of linezolid, and 2 to 3 samples were collected per patient during 2 to 14 h after administration of linezolid. The plasma samples were obtained by centrifugation at 3000 × g for 10 min at 4°C and stored at −80°C until assayed. This study was carried out in compliance with the ethical guidelines on clinical research and approval of the ethics review committee of the Osaka City University Hospital.
Results and Discussion
ChromatogramsFigure 2 shows chromatograms of blank plasma and plasma spiked with linezolid, PNU-142300, PNU-142586, IS and plasma from a patient administered linezolid. All compounds were well separated and the retention times of linezolid, PNU-142300, PNU-142586, and IS were 2.04, 1.86, 1.63, and 2.27 min, respectively. No interfering peaks were detected in the blank plasma. In this study, acetonitrile was used for deproteinization. Initially, the deproteinized supernatant was measured by adding buffer A and diluting twice. Although the theoretical plate number was good for the linezolid and PNU-142300 peaks, that of the PNU-142586 peak was not sufficient. Therefore, to improve the theoretical plate number of the PNU-142586 peak, buffer A had to be added to the deproteinized supernatant, followed by 6-fold dilution to increase the polarity.
LinearityCalibration curves were constructed for each assay by plotting the peak area ratio of the IS, linezolid, PNU-142300, and PNU-142586 against their respective plasma concentrations. In this study, the IS was used to obtain clinically reliable results. The equations of the calibration curves are shown in Table 1. Good linearity was exhibited over a concentration range of 0.20 to 50.0 µg/mL for linezolid (r2 > 0.9999) and 0.20 to 20.0 µg/mL for PNU-142300 (r2 > 0.9996) and PNU-142586 (r2 > 0.9998). The different range settings were selected for the clinical quantification expectations of linezolid, PNU-142300, and PNU-142586 in human plasma.
Table 1. Equations and Linearity of the Calibration Curves
| Drug | Equation | r2 |
|---|
| Linezolid | y = (0.0550 ± 0.0033)x + (0.0053 ± 0.0048) | 0.9999 |
| PNU-142300 | y = (0.0625 ± 0.0046)x + (0.0129 ± 0.0010) | 0.9996 |
| PNU-142586 | y = (0.0498 ± 0.0052)x + (−0.0023 ± 0.0012) | 0.9998 |
Values are mean ± standard deviation (S.D.).
Intra- and inter-assay reproducibility was evaluated, and the results are shown in Table 2. The intra- and inter-assay accuracies of linezolid were 92.92–103.57 and 93.61–111.45%, respectively, and the intra- and inter-assay precisions (RSD%) were <5.0 and <10.0%, except for the LLOQ. The inter-assay precision of linezolid for the LLOQ was <20%, meeting the criteria. Similarly, the intra- and inter-assay accuracies of PNU-142300 were 93.59–106.86 and 89.49–109.51%, respectively, and the intra- and inter-assay precisions (RSD%) were <2.0 and <4.0%, respectively. Similarly, the intra- and inter-assay accuracies of PNU-142586 were 96.93–101.48 and 92.80–97.34%, respectively, and the intra- and inter-assay precisions (RSD%) were <5.0 and <8.0%, respectively. These accuracy and precision of linezolid and its two metabolites were all within the range of reference values. The LLOQs of linezolid, PNU-142300 and PNU-142586 were all 0.20 µg/mL.
Table 2. Intra- and Inter-assay Accuracy and Precision for the Determination of Linezolid, PNU-142300, and PNU-142586 in Plasma Samples
| Drug | Nominal concentration (µg/mL) | Intra-assay (n = 5) | Inter-assay (n = 5) |
|---|
| Found (mean ± S.D.) (µg/mL) | Accuracy (%) | Precision (RSD %) | Found (mean ± S.D.) (µg/mL) | Accuracy (%) | Precision (RSD %) |
|---|
| Linezolid | 0.20 (LLOQ) | 0.19 ± 0.01 | 92.92 | 4.03 | 0.22 ± 0.03 | 109.97 | 15.71 |
| 0.60 (low QC) | 0.62 ± 0.00 | 103.57 | 0.71 | 0.67 ± 0.04 | 111.45 | 5.40 |
| 6.00 (medium QC) | 6.03 ± 0.02 | 100.48 | 0.29 | 5.62 ± 0.47 | 93.61 | 8.39 |
| 40.00 (high QC) | 37.38 ± 0.02 | 93.46 | 0.07 | 38.13 ± 2.72 | 95.33 | 7.14 |
| PNU-142300 | 0.20 (LLOQ) | 0.21 ± 0.00 | 106.86 | 1.66 | 0.22 ± 0.01 | 109.51 | 3.31 |
| 0.60 (low QC) | 0.06 ± 0.00 | 100.23 | 0.39 | 0.57 ± 0.02 | 95.77 | 3.70 |
| 6.00 (medium QC) | 5.69 ± 0.01 | 94.75 | 0.09 | 5.50 ± 0.17 | 91.72 | 3.02 |
| 15.00 (high QC) | 14.04 ± 0.01 | 93.59 | 0.09 | 13.42 ± 0.42 | 89.49 | 3.11 |
| PNU-142586 | 0.20 (LLOQ) | 0.20 ± 0.01 | 101.48 | 4.84 | 0.19 ± 0.01 | 97.34 | 5.95 |
| 0.60 (low QC) | 0.60 ± 0.01 | 99.68 | 1.63 | 0.56 ± 0.04 | 92.80 | 7.06 |
| 6.00 (medium QC) | 5.82 ± 0.08 | 96.93 | 1.41 | 5.82 ± 0.22 | 97.05 | 3.70 |
| 15.00 (high QC) | 15.02 ± 0.11 | 100.14 | 0.75 | 14.41 ± 0.79 | 96.06 | 5.47 |
LLOQ, lower limit of quantification; QC, quality control.
The results of the recovery tests for the three QC levels are shown in Table 3. The extraction recoveries of linezolid, PNU-142300, and PNU-142586 ranged from 106.1 to 109.6%, 91.4 to 131.1%, and 77.7 to 78.8%, respectively. The extraction recovery of IS (p-toluic acid) was 86.2%.
Table 3. Recovery Rates of Linezolid, PNU-142300, PNU-142586, and
p-Toluic Acid in Plasma Samples
| Drug | QC level | Recovery (%) |
|---|
| Linezolid | Low QC | 109.6 |
| Medium QC | 107.3 |
| High QC | 106.1 |
| PNU-142300 | Low QC | 131.1 |
| Medium QC | 95.5 |
| High QC | 91.4 |
| PNU-142586 | Low QC | 77.7 |
| Medium QC | 77.7 |
| High QC | 78.8 |
| p-Toluic acid (IS) | | 86.2 |
QC, quality control; IS, internal standard.
The results of the stability tests are shown in Table 4. Compared with the freshly prepared QC samples, the residual rates of the linezolid, PNU-142300, and PNU-142586 in QC samples after three freeze-thaw cycles of were 87.9 to 98.0%, 87.2 to 89.3%, and 98.3 to 98.7%, respectively. The long-term stabilities of linezolid, PNU-142300, and PNU-142586 at −30°C were confirmed by determining the ratios of the remaining percentages to those in freshly prepared QC samples and ranged from 100.1 to 111.7%, 89.2 to 90.5%, and 87.7 to 92.9%, respectively. No degradation tendency was observed for up to 30 d. The stabilities of linezolid, PNU-142300, and PNU-142586 following storage in the autosampler for 48 h were also confirmed when samples were compared with those injected immediately and ranged from 87.3 to 96.2%, 93.1 to 100.1%, and 97.5 to 98.0%, respectively. All compounds were stable under the conditions investigated in the stability testing of this study. Although the stability of linezolid has been evaluated in previous reports,12) this study newly showed that the major metabolites are also stable under each condition.
Table 4. Freeze and Thaw Stability, Long-Term Stability, and Post-Preparative Stability of Linezolid, PNU-142300, and PNU-142586 in Plasma Samples
| Drug | QC level | Freeze and thaw stability (% remaining) | Long-term stability (% remaining) | Post-preparative stability (% remaining) |
|---|
| Linezolid | Low QC | 98.0 | 111.7 | 87.3 |
| High QC | 87.9 | 100.1 | 96.2 |
| PNU-142300 | Low QC | 89.3 | 89.2 | 100.1 |
| High QC | 87.2 | 90.5 | 93.1 |
| PNU-142586 | Low QC | 98.7 | 87.7 | 98.0 |
| High QC | 98.3 | 92.9 | 97.5 |
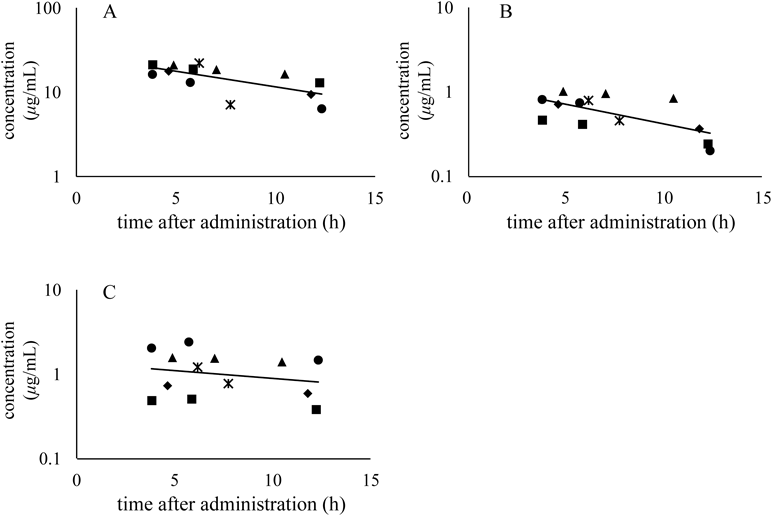
Figure 2F shows chromatograms of plasma samples from patients while Fig. 3 shows the plasma concentrations of linezolid, PNU-142300, and PNU-142586 after linezolid administration. The concentrations of linezolid and its metabolites were detectable at each sampling points. No peak affecting the quantification of linezolid and its metabolites was noted in the chromatograms of the plasma samples of patients. Measurement of linezolid using HPLC, UPLC, and LC-MS in human plasma has been reported,11–15) however, no study has reported its simultaneous quantification with PNU-142300 and PNU-142586. We have developed a method to simultaneously measure the concentration of these metabolites in human plasma.
Conclusion
In the present study, we developed a method for the simultaneous quantification of linezolid and its major metabolites, PNU-142300 and PNU-142586, in human plasma. The developed method had high general versatility and could be easily and quickly performed. In addition, the validated method enabled the quantification of clinical plasma samples. In the future, this method could be used for clinical PK/PD analyses, making it possible to evaluate the relationship between plasma concentration, clinical effects, and the occurrence of adverse events. This would lead to optimized linezolid dosage regimens tailored to individual patients.
A limitation of this study was the small number of clinical samples, which made it impossible to calculate PK parameters of linezolid and its metabolites. In the future, it would be necessary to accumulate cases to perform PK/PD analyses.
Acknowledgments
This research was supported by the Research Program on Emerging and Re-emerging Infectious Diseases from the Japan Agency Development, AMED [Grant number JP17fk0108208 and 18fk0108052h0002] and JSPS KAKENHI [Grant number 16K09939].
Conflict of Interest
The authors declare no conflict of interest.
References
- 1) Vinh D. C., Rubinstein E., J. Infect., 59 (Suppl. 1), S59–S74 (2009).
- 2) Stevens D. L., Dotter B., Madaras-Kelly K., Expert Rev. Anti Infect. Ther., 2, 51–59 (2004).
- 3) Bain K. T., Wittbrodt E. T., Ann. Pharmacother., 35, 566–575 (2001).
- 4) Shinabarger D. L., Marotti K. R., Murray R. W., Lin A. H., Melchior E. P., Swaney S. M., Dunyak D. S., Demyan W. F., Buysse J. M., Antimicrob. Agents Chemother., 41, 2132–2136 (1997).
- 5) Gee T., Ellis R., Marshall G., Andrews J., Ashby J., Wise R., Antimicrob. Agents Chemother., 45, 1843–1846 (2001).
- 6) Brier M. E., Stalker D. J., Aronoff G. R., Batts D. H., Ryan K. K., O’Grady M., Hopkins N. K., Jungbluth G. L., Antimicrob. Agents Chemother., 47, 2775–2780 (2003).
- 7) Hendershot P. E., Jungbluth G. L., Cammarata S. K., Hopkins N. K., J. Antimicrob. Chemother., 44 (Suppl.), A55 (1999).
- 8) Matsumoto K., Takeshita A., Ikawa K., Shigemi A., Yaji K., Shimodozono Y., Morikawa N., Takeda Y., Yamada K., Int. J. Antimicrob. Agents, 36, 179–181 (2010).
- 9) Tsuji Y., Hiraki Y., Matsumoto K., Mizoguchi A., Kobayashi T., Sadoh S., Morita K., Kamimura H., Karube Y., J. Infect. Chemother., 17, 70–75 (2011).
- 10) Slatter J. G., Stalker D. J., Feenstra K. L., Welshman I. R., Bruss J. B., Sams J. P., Johnson M. G., Sanders P. E., Hauer M. J., Fagerness P. E., Stryd R. P., Peng G. W., Shobe E. M., Drug Metab. Dispos., 29, 1136–1145 (2001).
- 11) Cattaneo D., Baldelli S., Conti F., Cozzi V., Clementi E., Ther. Drug Monit., 32, 520–524 (2010).
- 12) Boak L. M., Li J., Nation R. L., Rayner C. R., Biomed. Chromatogr., 20, 782–786 (2006).
- 13) Baietto L., D’Avolio A., Ariaudo A., Corcione S., Simiele M., Cusato J., Urbino R., Di Perri G., Ranieri V. M., De Rosa F. G., J. Chromatogr. B Analyt. Technol. Biomed. Life Sci., 936, 42–47 (2013).
- 14) Zander J., Maier B., Zoller M., Teupser D., Vogeser M., Clin. Chem. Lab. Med., 52, 381–389 (2014).
- 15) Barco S., Bandettini R., Maffia A., Tripodi G., Castagnola E., Cangemi G., J. Chemother., 27, 343–347 (2015).
- 16) U.S. Department of Health and Human Services, Food and Drug Administration, Center for Drug Evaluation and Research (CDER), “Guidance for industry: Bioanalytical method validation, 2001.”: ‹https://www.fda.gov/downloads/Drugs/Guidance/ucm070107.pdf.›, cited 6 January 2018.