Regular Articles
Anti-tumor Effect of Gambogenic Acid and Its Effect on CYP2C and CYP3A after Oral Administration
2023 Volume 71 Issue 5 Pages 334-341

Details
2023 Volume 71 Issue 5 Pages 334-341
Gambogenic acid (GNA), which has a broad spectrum of anti-tumor activity, is considered as a potential anticancer ingredient. In this study, we examined the anti-tumor effect and the effect of GNA on CYP and pregnane X receptor (PXR). In anti-tumor experiments, an A549 cells tumor-bearing nude mice model was established. Tumor weights and volumes were measured. Inhibition ratio (IR) was calculated. In a pharmacokinetic study, after intragastrical administration of GNA in rats, a cocktail method was adopted to evaluate the activities of CYP2C6, 2C11 and 3A1; RT-quantitative PCR (RT-qPCR) and Western blot (WB) assays were applied to evaluate the mRNA and protein expression levels, respectively. Compared with injection, oral administration also can inhibit tumor growth. Moreover, GNA increased the activities of CYP2C11 and CYP3A1 in the high-dose group as well as the mRNA and protein expression levels. The mRNA and protein expression levels of PXR were also slightly induced. Our study suggested that, oral administration of GNA was effective in inhibiting tumor growth in mice and could induced the activities of CYP2C and CYP3A in rats.
Gamboge, orange resin exuded from stem bark of Garcinia plants, was originally used as pigment, dye and folk medicine.1,2) Garcinia xanthones show diverse potent biological activities, such as anti-tumor, antibacterial and anti-inflammatory. These have aroused the attention of researchers from the fields of phytochemistry, chemosynthesis and pharmacology.3,4) Gambogenic acid (GNA, Fig. 1) is one of the main active ingredients in caged Garcinia xanthones. GNA showed promising cytotoxicity (IC50 < 5 µM) against A549, CNE-1, U251, HepG2, HepG2/Adr cell lines.5–9) The apoptosis effect of GNA was associated with decreased protein levels of p38, phospho-extracellular regulated protein kinases 1/2 (p-ERK1/2)8) and the inactivation of Akt signaling pathway.7) Moreover, the inhibitory effect of GNA on nuclear factor kappa-B (NF-κB) signaling had been found to block the growth and metastasis of bladder cancer cells.10) Furthermore, GNA synergistically potentiated bortezomib-induced apoptosis in multiple myeloma and this combined therapy could be a potential chemotherapy regimen for multiple myeloma.11) These efforts confirmed GNA was a promising anticancer candidate. In previous preclinical studies, GNA was injected into animals. The anti-tumor effect of oral medication has not been examined. Therefore, a test of oral administration was conducted in this study.

The possibly metabolic sites of GNA oxidized by CYP450s outlined in the oval.
CYP450 enzymes consist of multiple isoforms with different substrates. CYP2C enzymes are clinically important, which are responsible for more than 20% of all drug metabolism.12,13) The CYP3A subfamily, the most abundant CYP450 in the liver and intestine, can catalyze the oxidation of at least 50% of commonly used therapeutic drugs.14) Moreover, the pregnane X receptor (PXR), a member of the nuclear receptor superfamily, can regulate the expression levels of phase I (including CYP450), phase II drug metabolic enzymes and transporters. Both CYP450 and PXR can be activated by a huge variety of substances.15–18) Our previous observations indicated that GNA was metabolized by multiple CYP450 enzymes, including CYP2C and CYP3A.19) As a result, it is necessary to study the potential effects of xenobiotics on CYP2C (including CYP2C6 and CYP2C11) and CYP3A1 in rats. In addition, the quantitative real-time RT-qPCR (Table 1) and Western blot (WB) assays were used to evaluate the effect of GNA on mRNA and protein expression levels of CYPs and PXR, respectively.
| Gene name | Forward primer | Reverse primer |
|---|---|---|
| CYP2C6 | TCAGCAGGAAAACGGATGTG | AATCGTGGTCAGGAATAAAAATAACTC |
| CYP2C11 | GGAGGAACTGAGGAAGAGCA | AATGGAGCATATCACATTGCAG |
| CYP3A1 | TGCCATCACGGACACAGA | ATCTCTTCCACTCCTCATCCTTAG |
| PXR | GTGATGGCTGAACAGGTAGGC | CGGTGGAGCCTCAATCTTTTC |
| β-Actin | GCCCAGAGCAAGACAGGTAT | GGCCATCTCCTGCTCGAAGT |
Table 1 is marked in the RT-qPCR analysis.
As illustrated in Fig. 2, the tumor volumes in treatment group were smaller than that in control group, except for the GNA (intragastrically (i.g.), 7.5 mg/kg) group (p < 0.05). In particular, the volumes of the GNA (i.g., 30 mg/kg) group were close to those of the GNA (intraperitoneally (i.p.), 1.5 mg/kg) group. Compared with the control group, there was a decreasing trend even at a low dose of GNA (i.g., 7.5 mg/kg), although there was no significant difference. The tumor volumes in the control, cisplatin, GNA (i.p., 1.5 mg/kg), GNA (i.g., 7.5 mg/kg), and GNA (i.g., 30 mg/kg) groups were 0.484 ± 0.217, 0.161 ± 0.049, 0.208 ± 0.128, 0.290 ± 0.150, and 0.220 ± 0.154 cm3, respectively. The inhibition ratios (IRs) calculated from tumor weight in the cisplatin, GNA (i.p., 1.5 mg/kg), GNA (i.g., 7.5 mg/kg), and GNA (i.g., 30 mg/kg) groups were 60.56, 49.64, 28.98, and 45.45%, respectively. These results indicated that oral administration of GNA also had an anti-tumor effect. Body weight was monitored throughout the experiment as an indirect indicator of drug toxicity. The rate of weight change was calculated as follows: rate of weight change (%) = [(x−y)/(xn−yn)] × 100%, where x and y represented the average weight of 14-d and 0-d for each group, respectively; n represented the normal group. The rate of weight change in the cisplatin, GNA (i.p., 1.5 mg/kg), GNA (i.g., 7.5 mg/kg) and GNA (i.g., 30 mg/kg) groups were −65, 37.5, 70.5, and 87.5%, respectively. Cisplatin caused apparent weight loss which was a side effect of chemotherapy.20) Compared with the normal group, no significant change was found in GNA (i.g., 7.5 and 30 mg/kg) group, suggesting the safety of oral administration.

(a) Tumor image; (b) Tumor volume; (c) Tumor weight (mean ± S.D., n = 6, except n = 5 in cis group); One-way ANOVA was used to compare the intergroup difference. Statistical significance was shown as * p < 0.05 compared to the control.
In this study, based on our previous research, a simplified cocktail approach was successfully applied to evaluate the effect of GNA on CYP2C and CYP3A in rats.21) The liquid chromatography-tandem mass spectrometry (LC-MS/MS) method was validated by assessments of selectivity, accuracy, precision, matrix effect, recovery, and the stability profiles of the probe drugs. The lowest limits of the quantitation of diclofenac, omeprazole and midazolam in rat plasma were 20, 2, and 2 ng/mL, respectively (with a good precision less than 15%). The linear range of diclofenac was 20–2000 ng/mL, and the linear ranges of omeprazole and midazolam were both 2–200 ng/mL, with correlation coefficients above 0.99.
Effect of GNA on CYP2C6 activity: Pharmacokinetic parameters of diclofenac were used to evaluate the activity of CYP2C6. Mean plasma concentration–time curves and pharmacokinetic parameters of diclofenac were presented in Fig. 3 and Table 2, respectively. According to statistical analysis of the pharmacokinetic parameters elimination half-life (t1/2z), area under the plasma concentration versus time curve from zero to infinity (AUC0–∞) and total body clearance (CLz), no significant difference was observed between the CON and GNA pretreatment groups.
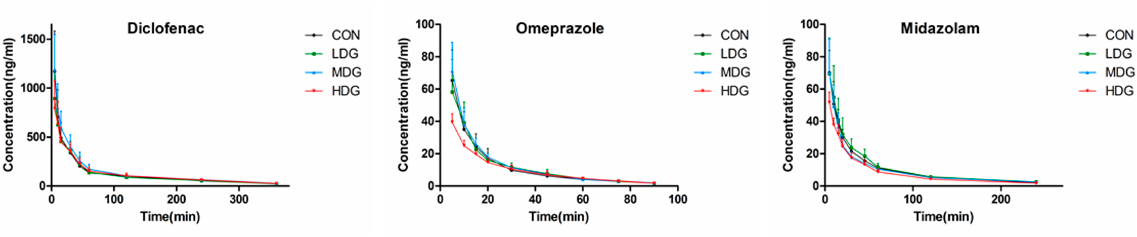
CON, LDG, MDG, HDG represent the control, low-, medium-, and high-dose group, respectively. The main pharmacokinetic parameters were represented in Table 2.
| Probe | Group | t1/2z (min) | AUC0–∞ (ng·min/mL) | CLz (L/kg/min) |
|---|---|---|---|---|
| Diclofenac | CON | 114.79 ± 24.63 | 53260.52 ± 10882.04 | 0.020 ± 0.004 |
| LDG | 106.84 ± 23.15 | 49072.77 ± 11238.72 | 0.022 ± 0.007 | |
| MDG | 108.26 ± 17.26 | 59682.26 ± 10675.04 | 0.017 ± 0.003 | |
| HDG | 110.21 ± 25.90 | 51277.30 ± 15689.33 | 0.022 ± 0.008 | |
| Omeprazole | CON | 28.13 ± 3.92 | 1432.82 ± 278.45 | 0.72 ± 0.13 |
| LDG | 23.42 ± 4.68 | 1419.34 ± 228.10 | 0.72 ± 0.11 | |
| MDG | 25.32 ± 5.97 | 1561.63 ± 328.42 | 0.66 ± 0.13 | |
| HDG | 27.46 ± 3.78 | 1048.70 ± 202.90* | 0.99 ± 0.24* | |
| Midazolam | CON | 45.64 ± 11.43 | 2812.81 ± 327.66 | 0.36 ± 0.045 |
| LDG | 48.12 ± 9.60 | 3060.69 ± 697.53 | 0.34 ± 0.082 | |
| MDG | 52.38 ± 6.21 | 2737.43 ± 533.25 | 0.38 ± 0.074 | |
| HDG | 50.02 ± 9.01 | 2263.43 ± 329.53* | 0.45 ± 0.068* |
CON, LDG, MDG, HDG represent the control, low-, medium-, and high-dose group, respectively. Data are expressed as mean ± S.D. (n = 6). One-way ANOVA was used to compare the intergroup difference. Statistical significance was shown as * p < 0.05 compared to the control.
Effect of GNA on CYP2C11 activity: Plasma concentration-time curves and the main pharmacokinetic parameters of omeprazole were presented in Fig. 3 and Table 2. In the low dose group (LDG), medium dose group (MDG) and high dose group (HDG) groups, the mean AUC0–∞ values were 0.99-, 1.09-, and 0.73-fold those observed in the CON group, respectively. These findings were consistent with the CLz values, which were 1.00-, 0.92- and 1.38-fold, respectively. According to statistical analysis, the primary parameters (t1/2z, AUC0–∞ and CLz) of omeprazole in LDG and MDG showed no significant change compared to CON. However, in the HDG, the lower exposure (AUC0–∞) and higher clearance (CLz) indicated the high dose of GNA could accelerate the elimination of omeprazole in rats.
Effect of GNA on CYP3A1 activity: The effects of different GNA doses on CYP3A1 activity in rats were evaluated by midazolam. The pharmacokinetic parameters were represented in Table 2, and the corresponding mean plasma concentration-time curves were depicted in Fig. 3. According to the statistical analysis, the primary parameters (t1/2z, AUC0–∞ and CLz) of midazolam in the LDG and MDG showed no significant change compared to CON. However, the mean AUC0–∞ and CLz of midazolam were 0.80- and 1.25-fold of those of CON, respectively. The results suggested that a high dose of GNA had the potential to induce rat hepatic CYP3A1 activity in vivo.
Biochemical Parameters and Histopathological AnalysisBody weights of rats were monitored throughout the experiment as an indirect indicator of drug toxicity. In our preliminary study, 200 mg/kg GNA caused weight loss and liver injury by increase of aspartate aminotransferase (AST) and alanine aminotransferase (ALT).
As displayed in Table 3, there was no significant difference in serum levels of ALT, AST, albumin (ALB) and alkaline phosphatase (ALP) between the CON and GNA treatment groups. Moreover, livers did not show obvious histopathological abnormities or lesions (Fig. 4) in GNA treatment groups. These results indicated that, after treatment for 14 d, three doses of GNA did not influence hepatic function in rats.
| Group | ALT (IU/L) | AST (IU/L) | ALB (g/L) | ALP (IU/L) |
|---|---|---|---|---|
| CON | 54.67 ± 9.42 | 101.50 ± 17.94 | 33.80 ± 1.63 | 185.50 ± 29.31 |
| LDG | 51.17 ± 9.15 | 96.67 ± 19.37 | 34.17 ± 3.07 | 166.50 ± 31.69 |
| MDG | 62.33 ± 12.13 | 107.00 ± 17.57 | 38.43 ± 3.82 | 172.00 ± 31.92 |
| HDG | 69.00 ± 13.54 | 100.67 ± 18.44 | 34.82 ± 1.24 | 179.33 ± 34.30 |
CON, LDG, MDG, HDG represent the control, low-, medium-, and high-dose group, respectively. Data are expressed as mean ± S.D. (n = 6). One-way ANOVA was used to compare the intergroup difference.

CON, LDG, MDG, HDG represent the control, low-, medium-, and high-dose group, respectively.
After 14 d of treatment with GNA, the protein levels of CYP isoforms in the livers of rats were measured by WB. A typical representative figure was shown (Fig. 5). The results of statistical analysis indicated that, CYP2C6 protein expressions was 1.30, 1.18 and 1.21 times the protein expression of CON in the LDG, MDG and HDG, respectively. GNA increased the protein expressions of CYP2C11 to 1.20-fold in the MDG and 1.26-fold in the HDG. For CYP3A1, the significant difference was only in HDG. The protein expression was 1.19-fold of the protein expression observed in CON. The protein expressions of PXR in the HDG was up to 1.18-fold.

CON, LDG, MDG, HDG represent the control, low-, medium-, and high-dose group, respectively. The protein expression was normalized to GAPDH. Data are expressed as mean ± S.D. (n = 3). One-way ANOVA was used to compare the intergroup difference. * p < 0.05 compared with the control group.
Searching for genetic mechanisms, the effect of GNA on the mRNA levels of CYP genes was investigated. After treatment with GNA, CYP2C6 mRNA expression was 1.84, 1.56 and 1.27 times the mRNA expression of CON in the LDG, MDG and HDG, respectively (Fig. 6). The experimental results indicated that the inductive effect of GNA on CYP2C6 was more potent after low-dose treatment than after high-dose treatment. Moreover, GNA induced CYP2C11 mRNA expression, resulting in increases of 1.55-fold in the MDG and 1.19-fold in the HDG (Fig. 6). For CYP3A1, the increases in mRNA expression were up to 1.62-, 1.16- and 1.22-fold in the LDG, MDG and HDG, respectively (Fig. 6). Similarly, GNA increased the mRNA expression of PXR to 1.82-, 1.49- and 1.22-fold, respectively (Fig. 6). The inductive effect of GNA on PXR was more potent after low-dose treatment than after high-dose treatment.

CON, LDG, MDG, HDG represent the control, low-, medium-, and high-dose group, respectively. The mRNA expression was normalized to β-actin. Data are expressed as mean ± S.D. (n = 3). One-way ANOVA was used to compare the intergroup difference. * p < 0.05 compared with the control group.
Available evidence demonstrated the anticancer characteristics of GNA.2,5–10,22) In this study, oral administration of GNA was attempted to evaluate the anti-tumor effect in vivo. Although the bioavailability of oral administration was reduced by some factors, such as the pH of the digestive system and CYP450 enzymes,19) this experiment still proved that GNA could effectively inhibit tumor growth in nude mice. It suggested oral administration of GNA would be feasible to inhibit tumor growth.
The effects of xenobiotics on CYP450 enzyme activity are very important for clinical use. In a total of 29 breast cancer patients, a pharmacokinetic interaction occurred between vinorelbine and lapatinib, because lapatinib was an inhibitor of CYP3A4.23) Fluorouracil altered the pharmacokinetics of tolbutamide by decreasing the hepatic expression of CYP2C6/11 in rats.24) Moreover, Food and Drug Administration (FDA) recommends that at least seven CYP isoforms, CYP1A2, CYP2B6, CYP2C9, 2C19, CYP2D6, CYP2E1, and CYP3A4/5 in human, should be investigated at new drug research and development stage. At present, limited information about GNA is available on CYP-mediated metabolism. We had studied the effect of GNA on CYP1A2, 2B1 and 2E1 in rats.21) The 14-d administration of GNA significantly increased the mRNA and protein expression levels as well as the activity of CYP2E1. The mRNA and protein expressions of CYP1A2 were clearly induced, while only the high GNA dose increased the activity of liver CYP1A2. GNA had a major effect only on the mRNA expression of CYP2B1 and CAR in rats. Based on our current results, the activity of CYP2E1 was significantly affected by GNA, even in the low-dose group. While the CYP1A2, CYP2C11 and CYP3A1 were affected by GNA only in the high-dose group.
And our previous observations indicated that, GNA was metabolized by CYP2C and CYP3A in rat liver microsomes.19) GNA in incubation system was measured in the absence or presence of selective inhibitors to explore the CYPs involved in the biotransformation of GNA. The chemical inhibitors were sulfaphenazole, quercetin, ticlopidine for CYP2C, ketoconazole for CYP3A. The results indicated that quercetin and ketoconazole were potent inhibitors of CYP-mediated metabolism of GNA. According to the FDA recommendations, quercetin and ketoconazole are chemical inhibitors of CYP2C8 and CYP3A4, respectively. The preferred substrates of CYP450 enzymes, taxol and midazolam would be metabolized by CYP2C8 and CYP3A4 to 6-hydroxy taxol and 1-hydroxy midazolam in human, respectively.
Gambogic acid (GA), which is similar to GNA in chemical structure and also from gamboge. The structure of its metabolites had been verified in the literature. GA could be metabolized to two main phase I metabolites in rat bile, and they were 10-hydroxygambogic acid and 9,10-epoxygambogic acid.25) 10-Hydroxygambogic acid was further identified as a major circulating metabolite of GA in human.26) According to several articles,1,2,27) we presume the sites inside the oval (Fig. 1) of GNA were most possibly oxidized by CYP450s. And oxidation products of the site in the green oval may be the major metabolites. The structure of GNA metabolites will be further investigated.
The doses of GNA given to rats were based on the literature and our previous experiments. In a clinical study of gambogic acid (GA, an analogue of GNA), volunteers received a single intravenous dose of 45 mg/m2 (approximately 7 mg/kg in rats) of GA injection which was from Jiangsu Kanion Pharmaceutical Co., Ltd., China).26) In the metabolism study, rats were treated with GA injection at a dose of 4 mg/kg.27) Additionally, Garcinia hanburyi extracts (0.932 g/kg, equivalent to 6.25 mg/kg GA and 2.87 mg/kg GNA) were administered orally to rats.28) Moreover, our observations indicated that the oral bioavailability of GNA was approximately 20% in rats.19) In our anti-tumor study, 1.5 mg/kg GNA (i.p.) and 30 mg/kg GNA (i.g.), these two doses can inhibit tumor growth in nude mice. There are dosage differences among different species, the dosage of human and mice are approximately 6.3 and 1.5 times that of rats, respectively. Therefore, we administrated three doses: low (5 mg/kg), medium (25 mg/kg) and high doses (100 mg/kg) of GNA by oral gavage to rats. These covered both the doses reported in the literature and the anti-tumor experimental doses in mice or rats.
The cocktail approach provided an efficient means by which multiple CYP isoform activities could be acquired in a single study.29,30) In our study, a simplified and rapid cocktail approach was applied, and this method was validated in terms of linearity, precision and accuracy. The FDA recommends that, diclofenac, omeprazole, and midazolam are qualified substrates of CYP2C9, CYP2C19, and CYP3A4 in humans, respectively. However, there are mainly CYP2C6, CYP2C11 and CYP3A1 in rats.31–33) In this study, there was no statistically significant difference in the main pharmacokinetic parameters (t1/2z, AUC0–∞ and CLz) of diclofenac. However, GNA induced the mRNA and protein expression levels of CYP2C6. According to the results of omeprazole, CYP2C11 activity could be significantly induced by GNA in the HDG, which contributed to reduced AUC0–∞ and increased CLz. Meanwhile, the upregulated mRNA and protein expression levels of CYP2C11 were also observed in the MDG and HDG. Only HDG showed significant inductive effects on CYP3A1 by evaluating the pharmacokinetic parameters of midazolam. However, GNA induced the mRNA expression of CYP3A1 in the three doses groups, and the most change was in the LDG. No statistically significant differences in CYP3A1 protein expression were observed in the LDG and MDG except for the HDG.
PXR was predominantly expressed in the liver and intestine, and played key roles in the regulation of major CYP enzymes (including CYP2C and CYP3A). Various compounds, such as rifampicin, dexamethasone and paclitaxel, have been shown to be PXR agonists.15) Hogle et al.34) had summarized the complex effect of Wu Wei Zi on PXR and CYP3A. The chemical components in Wu Wei Zi could activate PXR, then induce CYP3A; meanwhile, it could directly inhibit the CYP3A. Therefore, the overall net effect depended on the proportion of induction and inhibition triggered by constitutive phytochemicals contained in Wu Wei Zi. In our study, GNA induced the mRNA and protein expressions of PXR in rats. However, significant changes in pharmacokinetic parameters were observed in the HDGs treated with omeprazole and midazolam. Further studies of mechanism are still needed to confirm whether the mRNA and protein expression levels of CYP2C6, CYP2C11 and CYP3A1 are affected by PXR.
CYP450 enzymes and PXR are enriched in intestine. Oral dosing at 500 mg twice daily for 5 d is sufficient to achieve maximal hepatic and small intestine CYP3A4 inhibition.35) In our study, oral administration of GNA would also affect enzymes activities in the intestine, while the administration of probe drugs was intravenous but not oral. This meant the assessment of CYP450s enzymes activities of probe drugs were mainly in the liver rather than the intestine. Therefore, the effect of GNA on intestinal enzymes will be further investigated.
There were noncorresponding changes in the activity, mRNA and protein levels. In our study, 5, 25, and 100 mg/kg of GNA were orally administered to LDG, MDG and HDG once daily for 14 d, respectively. Biochemical parameters showed there was no significant difference in serum levels of ALT, AST, ALB and ALP between the CON and GNA treatment groups. And livers did not show obvious histopathological abnormities or lesions (Fig. 4) in GNA treatment groups. In our preliminary study, the highest doses of 200 mg/kg caused liver injury by increase of AST and ALT. Therefore, negative correlation between the doses and mRNA expression levels, which induced by liver injury might be excluded.
In human, diclofenac is the probe of CYP2C9 and the metabolic pathway of omeprazole is CYP2C19. Although they show a high homologous in gene structure, and they exhibit genetic polymorphisms which affect the metabolism of a number of substrates of these enzymes.13) For example, CYP2C9 is responsible for the hydroxylation of up to 90% of phenytoin, while CYP2C19 is partially related to phenytoin metabolism. Variants of CYP2C9 and CYP2C19 result in reduced metabolism of phenytoin.36) The preferred/qualified substrates or chemical inhibitors of CYP2C9 and CYP2C19 FDA recommended are different. Even there are variations in the transcriptional regulation of CYP2C9 and CYP2C19 genes by nuclear receptors and their inducers in liver. This may be one reason of the noncorresponding changes in the diclofenac and omeprazole.
Noncorresponding changes indicate that there might be some modifications in CYP expression in the liver. Protein expression levels depend on many factors, such as transcription, translation, translocation, protein stabilization and degradation. Moreover, there was evidence that chronic mild stress could lead to changes in brain nervous system function, including variations in the concentrations of peripheral glucocorticoids, catecholamines and cytokines. These substances would influence CYP450 signaling pathways in the liver. As a result, CYP2C11 protein level was decreased, without a change in enzyme activity or mRNA level.30) Available literature indicated that, erythromycin could induce the activity of CYP3A and form a complex compound with CYP3A, then inactivate the enzyme. Therefore, erythromycin was a substrate as well as an inhibitor of CYP3A.37) Another example, the active lignans in Wuzhi tablets had a stronger affinity for the CYP3A enzyme. When Wuzhi tablets were co-administrated with tacrolimus, the metabolism of tacrolimus by CYP3A was decreased.38)
The Ku’s study39) showed a negative correlation between mRNA expression levels and its doses. The researchers deeply verified the involvement of miRNA. They found that miR-27a was negatively associated with its target gene P-glycoprotein (P-gp). This could also be due to the inhibition of retinoid X receptor (RXR), the heterodimer partner of PXR. miR-27a could bind with RXR, thus weaken the binding of PXR and RXR, result in the inverse trend between miR-27a and P-gp expression.40) Moreover, it had been reported miR-34a41) and miR-148a42) can inhibit gene expressions of PXR. MicroRNA-mRNA relationship is a complex network. This may be one of the reasons for our negative correlation between the doses of GNA and mRNA expression levels.
In future studies, to well confirm the possibility of drug–drug interaction between GNA and other compounds, we would conduct the further studies in human or rat liver microsomes, such as, the determination of Km and IC50 in the Enzyme Kinetics module, the study of induction of primary hepatocytes in vitro, including the nuclear receptor PXR, which regulates CYP2C and 3A.
In our study, tumor growth was inhibited by oral administration of GNA in tumor-bearing Balb/c nude mice. GNA had inconspicuous effects on diclofenac, and the high dose of GNA showed significant inductive effects on omeprazole and midazolam by evaluating the pharmacokinetic parameters. GNA also induced the protein and mRNA expression levels of PXR. GNA was a promising anti-tumor ingredient. Oral administration of GNA could induce the activities of CYP2C and CYP3A in rats.
GNA (purity ≥98%) was isolated from gamboge as previously described.5,43) Diclofenac, omeprazole and midazolam were purchased from the National Institutes for Food and Drug Control (Beijing, China). Glibenclamide (internal standard, IS) was obtained from Shanghai Yuanye Bio-Technology Co., Ltd. (Shanghai, China). Acetonitrile and methanol were purchased from Merck (Darmstadt, Germany). Formic acid and sodium carboxymethyl cellulose (CMC-Na) were obtained from Sinopharm Chemical Reagent Co., Ltd. (Shanghai, China). Deionized water was prepared using a Milli-Q purification system (Millipore, Bedford, U.S.A.). All other reagents were of analytical grade or chromatographic grade, and were commercially available.
AnimalsAnimal experiments were performed according to the Institutional Guidelines for the Care and Use of Laboratory Animals and approved by the Experimental Animal Ethics Committee of Anhui University of Chinese Medicine (Hefei, China). Male Balb/c nude mice (4–6 weeks) were supplied by Charles River Experimental Animal Technology Co., Ltd. (Beijing, China). Healthy male Sprague–Dawley rats (220 ± 20 g) were obtained from the Laboratory Animal Center of Anhui Medical University (Hefei, China). All animals were maintained in an environmentally controlled room with a 12 h light/darkness cycle and allowed ad libitum access to water and food.
Anti-tumor Efficacy in Nude MiceLung adenocarcinoma A549 cells were obtained from the cell bank of Shanghai Institute of Cell Biology, China. A tumor model was generated by subcutaneous injection of 1 × 10⁷ A549 cells into the fat pad near the left axilla of the mice. When the tumor reached approximately 50 mm3, mice were randomly divided into 5 groups (n = 6 for each group): a control group (CON) with normal saline; a positive control group (i.p.) injected with cisplatin (CIS, 2 mg/kg)5,44); and three drug groups treated with 1.5 mg/kg GNA (i.p.), 7.5 mg/kg GNA by intragastric administration (i.g.), and 30 mg/kg GNA (i.g.). Cisplatin was given continuously for 5 d. The GNA (i.p.) group was injected one time every other day, a total of 7 times. The two GNA (i.g.) groups were administered once a day for 2 weeks. Body weights and tumor volumes (V = ab2/2, where a was the major axis and b was the minor axis measured by slide caliper) were measured twice a week after administration. At the end of the experiment, mice were sacrificed, and then the tumors were excised, weighted and photographed. The inhibition ratio (IR) was calculated as follows: IR (%) = [(x−y)/x] × 100%, where x and y represent the average tumor weight for the control group and treatment group, respectively.
Effect of GNA on CYP Isoform SubstratesGrouping and administration: Rats were randomly divided into four groups (n = 6 for each group): a control group (CON), low dose group (LDG), medium dose group (MDG) and high dose group (HDG). CON received 0.5% CMC-Na solution. A suspension of GNA was prepared with 0.5% CMC-Na solution, and then given orally at doses of 5, 25, and 100 mg/kg to LDG, MDG, and HDG once daily (in the morning) for 14 d.
Pharmacokinetic study: After GNA treatment, on the morning of the 15th day, all rats received a mixture of cocktail solution intravenously. The solution contained probe substrates: diclofenac (CYP2C, 1 mg/kg), omeprazole (CYP2C, 1 mg/kg) and midazolam (CYP3A, 1 mg/kg). Blood samples (250 µL) were collected from the retro-orbital plexus of rats at 0, 0.083, 0.17, 0.25, 0.33, 0.5, 0.75, 1, 1.25, 1.5, 2, 4 and 6 h after administration. Plasma samples were separated from the blood by centrifugation at 1000 × g for 10 min and stored at −80 °C for analysis.
Plasma sample preparation: Each plasma sample (100 µL) was spiked with the IS working solution (50 ng/mL, 100 µL) and 200 µL methanol. After 3 min of vortex-mixing and centrifugation (11000 × g for 10 min), the supernatant solution was collected and 5 µL of each sample was injected into the LC-MS/MS system for analysis.
UPLC-MS/MS Analysis: An Agilent 1290 Infinity (Agilent Technologies Inc., Palo Alto, CA, U.S.A.) system with a Qtrap 4500 triple quadrupole mass spectrometer (AB Sciex, Redwood City, CA, U.S.A.) was used for detection in multiple reaction monitoring (MRM) mode. Chromatographic separations were achieved on an Acquity CSH C18 column (2.1 × 100 mm, 1.7 µm, Waters Corp., Milford, MA, U.S.A.). The column temperature was maintained at 30 °C. The mobile phase consisted of A (0.1% aqueous formic acid) and B (acetonitrile). The gradient elution program was as follows: 0–1.0 min (90–20% A), 1.0–1.3 min (20% A), 1.3–2.0 min (20–5% A), 2.0–3.0 min (5–10% A), 3.0–3.5 min (10% A), and 3.5–5.0 min (10–90% A). The flow rate was 0.2 mL/min. The instrument was operated in positive ionization mode and the MRM transitions were m/z 296.0→250.0 for diclofenac (collision energy, CE:15 V), m/z 346.1→197.9 for omeprazole (CE: 14 V), m/z 326.1→290.6 for midazolam (CE: 35 V) and m/z 493.9→169.1 for IS (CE: 46 V). The MS parameter settings were as follows: ion spray voltage, 5500 V; capillary voltage, 3600 V; ion source temperature, 400 °C; desolvation temperature, 500 °C.
Serum Biochemical Analysis and Histopathological AnalysisRat grouping and administration were described in “Effect of GNA on CYP isoform substrates.” On the 15th day, rats were anesthetized and sacrificed. Blood samples were obtained from the abdominal aorta and kept for 40 min at room temperature followed by centrifugation at 1000 × g for 10 min. The serum was separated and serum levels of AST, ALT, ALB and ALP were determined by an automatic blood biochemical analyzer (Beckman Counter, U.S.A.).
Livers were quickly harvested. The same sections of each group livers were rinsed with pre-cooled normal saline, fixed with 10% formalin solution, stained with hematoxylin–eosin (H&E) and were analyzed by microscopy (Nikon 80i).
Western Blot AnalysisAs described in “Serum biochemical analysis,” after blood collection, rat livers were quickly harvested, then liver tissues were homogenized and lysed in ice-cold radio immunoprecipitation assay (RIPA) (Beyotime Biotechnology) buffer containing 1% proteinase inhibitor phenyl methyl sulfonyl fluoride (PMSF). After centrifugation, the protein levels in the supernatant were measured by the bicinchoninic acid (BCA) protein assay kit (Beyotime Biotechnology, Shanghai, China). Equal amounts of protein lysates were separated by 10% sodium dodecyl sulphate (SDS)-polyacrylamide gel electrophoresis and then transferred onto nitrocellulose membranes. After blocking in 5% nonfat milk, blots were probed using CYP2C6 antibody (1 : 1000, ab22723, Abcam, Cambridge, U.K.), CYP2C11 antibody (1 : 1500, ab3571, Abcam), CYP3A1 antibody (1 : 1000, ab22724, Abcam) and PXR antibody (1 : 1000, ab118336, Abcam) overnight at 4 °C. The membranes were washed and then incubated with secondary antibodies (goat anti-rabbit immunoglobulin G (IgG)-HRP, 1 : 10000, ZB-2301, zsbio; goat anti-rat IgG-HRP, 1 : 10000, ZB-2307, zsbio). Bands were visualized using the SuperSignal West Femto Kit (Thermo Fisher Scientific Inc., Waltham, MA, U.S.A.) and FluorChem FC3 (Proteinsimple, Santa Clara, CA, U.S.A.), and then analysed by AlphaView software. Glyceraldehyde-3-phosphate dehydrogenase (GAPDH) (Goodhere Biotechnology Co., Ltd., Hangzhou, China) was used as a housekeeping protein.
RT-qPCR AnalysisRat livers were harvested as described in “Western blot analysis,” then liver tissues (0.1 g) were extracted with TRIzol (Invitrogen, Carlsbad, CA, U.S.A.) according to the manufacturer’s instructions. The purity was determined by UV spectrophotometry (Bio-Tek Instrument Inc., Winooski, VT, U.S.A.) at 260 and 280 nm. Then, the RNA sample was reverse-transcribed into cDNA using the first-strand cDNA Synthesis Kit (Thermo Fisher Scientific Inc.). SYBR-PCR was performed using a StepOne Plus PCR System (Applied Biosystems, Foster City, CA, U.S.A.) with a SYBR Green PCR kit (Qiangen, Hilden, Germany). The protocol for RT-qPCR reactions was as follows: denaturation at 95 °C for 10 min, followed by 40 cycles of 95 °C for 15 s and 60 °C for 60 s. The mRNA expression was normalized to β-actin and was determined by a 2−△△Ct calculation. Each experiment was repeated three times. The forward and reverse primer sequences used in this study were listed in Table 1.
Statistical AnalysisPharmacokinetic parameters of substrates were analyzed with the DAS pharmacokinetic software (professional edition version 2.0, Drug and Statistics, Shanghai, China). Non-compartmental model was employed. The main parameters were as follows: t1/2z, AUC0–∞, and CLz. These parameters were defined as primary variables for assessing the effects of GNA on CYP2C and CYP3A. All values were expressed as the mean ± standard deviation (S.D.) which were obtained from at least three independent trials. Statistical analyses were performed using SPSS version 22.0. One-way ANOVA was used to compare the intergroup difference. Least significant difference (LSD) test was used for the homogeneity of variance. Dunnett’s test was used for heterogeneity of variances. p-Values <0.05 was considered statistically significant.
This work was supported by the National Natural Science Foundation of China (82073923) and pharmaceutical innovation fund of Anhui Medical University (YXCX202110).
The authors declare no conflict of interest.