| To whom correspondence should be addressed : Atsushi Miyawaki, Laboratory for Cell Function Dynamics, Advanced Technology Development Group, Brain Science Institute, RIKEN, 2-1 Hirosawa, Wako-city, Saitama, 351-0198, Japan. Tel: +81–48–467–5917, Fax: +81–48–467–5924 E-mail: matsushi@brain.riken.jp Abbreviations: AP1, adaptor protein 1; CFTR, cystic fibrosis transmembrane conductance regulator; Cx, connexin; EEA1, early endosome antigen 1; LAMP-1, lysosome-associated membrane protein 1; LAMP-2, lysosome-associated membrane protein 2; MEF, mouse embryonic fibroblast; mRFP1, monomeric red fluorescent protein1; TR-Dex, Texas-red dextran. |
Green fluorescent protein (GFP), originally isolated from the jellyfish Aequorea victoria (Aequorea GFP), has been the subject of continued interest since its cDNA was cloned in 1992. Mutagenesis studies have generated several color variants of Aequorea GFP, including BFP, CFP, and YFP (Tsien, 1998). Moreover, the discovery of novel fluorescent proteins from Anthozoans (coral animals) has significantly expanded the range of colors available for cell biological applications (Matz et al., 1999). Initially, Matz et al. cloned six natural Anthozoan fluorescent proteins, each with 26–30% identity to Aequorea GFP. Among these six proteins, DsRed is a widely used red fluorescent protein. More recently, the family of ‘GFP-like proteins’ has been expanded to include over 30 significantly different members (Chudakov et al., 2005). Despite only modest sequence identity with Aequorea GFP, these GFP-like proteins share a β-can fold (an 11-stranded β-barrel), and contain intrinsic chromophores.
However, a problem specific to the Anthozoan GFP-like proteins has been the appearance of punctate structures, presumably aggregates (Yanushevich et al., 2002). After transfection with the cDNAs encoding these GFP-like proteins, visible precipitates are scattered in the cytoplasm. Recently, protein aggregation has been a subject of great interest as it relates to both physiological and pathological events. For example, overexpression of an inefficiently folded cystic fibrosis transmembrane conductance regulator (CFTR) or inhibition of the proteasome in cells expressing CFTR led to the accumulation of stable, ubiquitinated aggregates of CFTR in the cytosol (Jensen et al., 1995; Ward et al., 1995). When CFTR was expressed as a GFP-fusion protein, these misfolded proteins appeared as large perinuclear precipitates surrounding the microtubule-organizing center (MTOC). It is widely accepted that when production of misfolded proteins exceeds the cellular capability to degrade them, the proteins form a novel subcellular structure, termed an aggresome (Johnston et al., 1998; Wigley et al., 1999; Kopito, 2000). In some neurodegenerative diseases, such as Parkinson’s disease, Polyglutamine (Poly Q) diseases, and Huntington’s disease, inclusion bodies containing misfolded proteins appear in cells. Similarly, because aggregation of fluorescent proteins may impede cellular applications and lead to toxicity, most cell biologists distrust these cytosolic precipitates.
Because all of the GFP-like proteins characterized to date form obligate oligomers (Miyawaki, 2005), aggregation may follow their oligomerization. Similarly, GFP-like proteins fused to host proteins may form massive aggregates through crosslinking if the host proteins are oligomeric or form complexes with other proteins. Indeed, DsRed produces large aggregates when fused to calmodulin (Mizuno et al., 2001), a protein that binds to a variety of cellular proteins. Overall, this aggregation could be solved by generating monomeric fluorescent proteins. Campbell et al. successfully engineered a monomeric RFP (mRFP1) from DsRed (Campbell et al., 2002). This mRFP1 forms less aggregates and has enabled red-fluorescence labelings that were not possible with DsRed.
Although the original data with mRFP1 suggested that oligomerization caused aggregation, we have observed visible precipitates with non-fused GFP-like proteins regardless of their oligomerization. For example, transfection of non-fused mRFP1 into HeLa cells causes visible precipitates in the cytosol. Such observations prompted us to investigate the nature of these cytosolic precipitates in order to determine how these precipitates are formed and if they should be avoided.
Rat astrocytes were prepared and cultured as described previously (Hama et al., 2004). Mouse embryonic fibroblast (MEF) cells were cultured as described previously (Kuma et al., 2004). Cells were transfected with plasmids using Lipofectamine 2000 reagent (Invitrogen). Cells were imaged on an inverted microscope (IX70, Olympus) with a standard 75-W xenon lamp and a 40× objective lens (Uapo/340, N.A. 1.35) at RT in HBSS added HEPES-NaOH (pH 7.4). Images were acquired using a cooled CCD camera (MicroMax, Roper Scientific). The whole system was controlled with MetaMorph 5.0 software (Universal Imaging). Confocal images were captured using a confocal microscope based on a Fluoview500 scanning unit (Olympus).
The cDNAs encoding fluorescent proteins were cloned into pRSETB (Invitrogen) for bacterial expression or into pcDNA3 (Invitrogen) for mammalian expression. The pS65T/EGFP/CFTR ΔF508 was a gift from Dr. Katherine H. Karlson (Dartmouth Medical School, Hanover, NH). Site-directed mutagenesis were introduced as described previously (Sawano and Miyawaki, 2000). The primers used for mRFP1 (S146G) and zFP506 (S148G) were 5'-GGCTGGGAGGCCGGCACCGAGCGGATG-3' and 5'-AACTGGGAGCCCGGCTGCGAGAAGATC-3', respectively.
HeLa cells were immunostained as described previously (Hirota et al., 2003). The following antibodies were used in this study: anti-AP-1 (clone 100/3, Sigma), anti-EEA1 (clone 14, BD Transduction Laboratories), anti-LAMP-1 (clone H4A3, Santa Cruz), anti-LAMP-2 (clone M3/84, Santa Cruz), and Alexa488-labeled secondary antibodies (Molecular Probes). Dextran internalization were performed with Texas Red-labeled dextran (Mr, 70,000 lysine fixable, Molecular Probes) as described previously (Hirota et al., 2003). The samples were visualized by confocal microscopy.
For immunoelectron microscopy, the post-embedding immunogold method was used to label cultured cells embedded in LR white resin (London Resin Co.) as previously described (Yamamoto et al., 1991).
Proteins were expressed in Escherichia coli and purified as described previously (Nagai et al., 2001). pH titration were performed as described previously (Nagai et al., 2001).
HeLa cells were disrupted by nitrogen cavitation (Cell Disruption Bomb, Parr). Lysosomes were purified using the Lysosome Isolation Kit (Sigma). To remove iodixanol, which was included in the Kit reagent, the lysosomal fraction was suspended in 5-fold PBS and centrifuged at 22,000×g for 30 min. Lysosome purification were evaluated by measuring organelle-specific enzymatic activities. The activities were measured using Acid Phosphatase Assay Kit (lysosomal marker, Sigma), Cytochrome c Oxidase Assay Kit (mitochondrial marker, Sigma), Cytochrome c Reductase Assay Kit (endoplasmic reticulum marker, Sigma), Catalase Assay Kit (peroxisome marker, Sigma) and LDH Cytotoxicity Detection Kit (cytosol, Takara). The yield and relative specific activity of lysosomal fraction to total homogenate are shown in Table II. The resulting pellets were subjected to osmotic shock by resuspending in a hypotonic solution (0.025 M sucrose). After 20 min at 0°C, the suspensions were centrifuged at 18,000×g for 30 min. The supernatants were adjusted to 0.3 M sucrose.
Recombinant fluorescent proteins (0.1 mg/ml) were treated with the lysosomal contents (0.1 mg/ml) in 125 mM KCl, 20 mM NaCl, 2 mM CaCl2, and 2 mM MgCl2 at pH 7.4 or 5.0. Twenty-five mM HEPES-NaOH (pH 7.4) or acetate buffer (pH 5.0) were used as the pH buffers. The sample mixtures were incubated at 37°C for 18 hours and analyzed by SDS-PAGE and stained with Coomassie Brilliant Blue or by native-PAGE and visualized on UV-illuminator. The results of SDS-PAGE were analyzed by the NIH-image and the band density of the fluorescent proteins was normalized to the density at pH 7.4.
Statistical significance was determined using the paired Student’s t-test. P<0.05 was considered statistically significant.
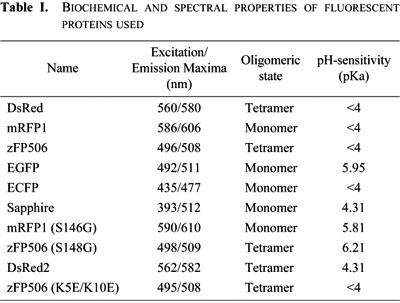
It has been reported that GFP-like proteins, even without fusion to other proteins, aggregate and form precipitates in cultured cells (Yanushevich et al., 2002). We examined the propensity of several fluorescent proteins to form these aggregates in HeLa cells. The proteins tested were mutants of Aequorea GFP, including enhanced green fluorescent protein (EGFP), enhanced cyan fluorescent protein (ECFP), and Sapphire, and GFP-like proteins, including DsRed, its monomeric version (mRFP1), and zFP506 (Matz et al., 1999). The biochemical and spectral properties of the fluorescent proteins used in this study are described in Table I. When synthesized in bacteria and purified, these proteins showed no substantial scattering in a buffer containing 125 mM KCl (Fig. 1), indicating that they were soluble in vitro.
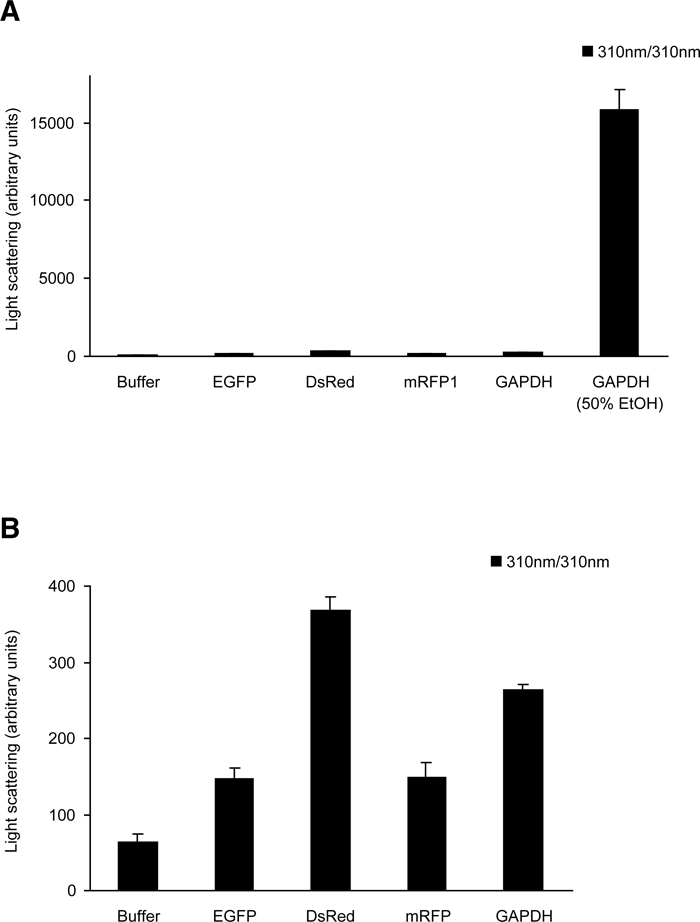 View Details | Fig. 1. Light scattering of solutions containing EGFP, DsRed, mRFP1, GAPDH, and GAPDH in the presence of 50% ethanol. (A) Recombinant proteins (100 μM) of EGFP, DsRed, mRFP1 and GAPDH were incubated in 125 mM KCl, 20 mM NaCl, 2mM CaCl2, 2 mM MgCl2, and 25 mM HEPES-NaOH (pH 7.4) for 2 hours at 37°C. Samples were then diluted 10 times with the same buffer. Light scattering was measured with the excitation and emission set at 310 nm in a spectrofluorometer. Data represent the means±S.D. of three independent experiments. (B) The columns except GAPDH with 50% ethanol are scaled up. |
Three days post transfection, 30–50% of the HeLa cells expressing DsRed, mRFP1, or zFP506 displayed visible precipitates in the cytoplasm (Fig. 2A–C and 2G). These precipitates are hereafter referred to as “fluorescent dots.” The dots appeared granular and were located predominantly in perinuclear regions. When mRFP1 and zFP506 were cotransfected into HeLa cells, the red and green dots were completely colocalized (Fig. 2H–J). Similarly, DsRed and zFP506 also colocalized (data not shown). Therefore, it is likely that the mechanisms for formation of fluorescent dots are common to these GFP-like proteins. On the other hand, transfection of EGFP, ECFP, or Sapphire did not produce any fluorescent bodies after three days of transfection (Fig. 2D–F); the absence of these fluorescent dots was confirmed for one week post transfection (data not shown). To determine if formation of fluorescent dots was specific to HeLa cells, we transfected other cultured cells with the cDNA of EGFP or mRFP1 (Fig. 2K–T). The fluorescence of EGFP was distributed homogeneously both in the cytoplasm and nucleus of COS-K1, COS7, HEK293, and BHK cell lines, or rat primary astrocytes. By contrast, fluorescent dots were observed in about 50% of cells expressing mRFP1. Although the fluorescent dots in HEK293 and CHO-K1 cells were more scattered, they were never found in the nucleus.
 View Details | Fig. 2. Formation of fluorescent dots in cells expressing GFP-like proteins. A, DsRed; B, mRFP1; C, zFP506; D, EGFP; E, ECFP; F, Sapphire. HeLa cells were imaged three days post transfection (G) Fraction of transfected cells with fluorescent bodies. Over 200 cells were counted for each experiment. Similar results were obtained in 3 other experiments. Data represent means±S.D. (H–J) HeLa cells were co-transfected with the cDNAs for mRFP1 and zFP506. Three days post transfection, confocal images were acquired for mRFP1 (H) and zFP506 (I) and their merged image (J). (K–T) Fluorescence images of expressing mRFP1 (upper columns) or EGFP (lower columns) in the following cell types: (K, P) CHO-K1, (L, Q) COS7, (M, R) HEK293, (N, S) BHK, (O, T) Rat astrocyte. Note that dots are observed in only mRFP1 transfected cells. Scale bar, 10 μm. |

There are numerous reports on aggregation of misfolded proteins, such as protein aggregation in relation to neurodegenerative diseases. Some aggregating proteins concentrate into a prominent perinuclear inclusion body, termed an “aggresome” (Johnston et al., 1998; Wigley et al., 1999; Kopito, 2000). We therefore investigated whether the mRFP1 fluorescent dots were aggresomes. Fluorescent aggresomes can be generated by transfection of GFP-ΔF508-CFTR, which is polyubiquitinated but assembles in the presence of MG132 (Haggie et al., 2002). When mRFP1 and GFP-ΔF508-CFTR were transfected into HeLa cells, the red fluorescence was completely differentiated from the green CFTR aggresomes (Fig. 3A). Because the fluorescent dots were shaped like granules, we examined their similarity to vesicular organelles. We performed immnocytochemistry on mRFP1-expressing HeLa cells using anti-adaptor protein 1 (AP1), anti-early endosome antigen 1 (EEA1), or anti-lysosome-associated membrane protein 1 (LAMP-1) to label the trans golgi network, early endosomes, and late endosome/lysosomes, respectively. Immunosignals for AP1 and EEA1 were distinct from the red fluorescence of mRFP1 (Fig. 3B and 3C, respectively). However, immunosignals for LAMP-1 colocalized with mRFP1 (Fig. 3D). The colocalization of mRFP1 and LAMP-1 inside lysosomes was verified by immunoelectron microscopy. The gold particles for mRFP1 (10 nm) were detected in the same vesicular structures labeled with the gold particles for LAMP-1 (5 nm) (Fig. 3F). When EGFP was immunolocalized, the gold particles (10 nm) were excluded from the LAMP-1-containing structures (Fig. 3G). Another marker used for visualizing lysosomes is Texas-Red Dextran (TR-Dex). This reagent is taken up by cells and targeted to lysosomes. We treated HeLa cells expressing zFP506 with TR-Dex, and observed complete colocalization between the green zFP506 and red dextran (Fig. 3E). These results indicate that fluorescent dots in the cytoplasm are lysosomes bearing GFP-like proteins.
 View Details | Fig. 3. Colocalization of fluorescent bodies with lysosomes in HeLa cells. (A) Cells were co-transfected with the cDNAs for mRFP1 and GFP-CFTR-ΔF508. Two days later, the cells were treated with MG132 (5 μM) for 24 hours, and then fixed and permeabilized. (B–D) Cells were transfected with the cDNA for mRFP1. Three days post transfection, cells were fixed, permeabilized, and stained with an antibody to AP-1 (B), EEA1 (C) or LAMP-1 (D). (E) Two days post transfection with the cDNA for zFP506, cells were incubated with medium containing TR-Dex (0.02 mg/ml) for 6 hours and then with normal medium for 18 hours. (A–E) Images were acquired using confocal microscopy. Scale bar, 10 μm. (F, G) Electron micrographs of HeLa cells expressing mRFP1 (F) and EGFP (G). Scale bar, 100 nm. |
Assuming that all fluorescent proteins expressed in the cytosol enter lysosomes and maintain their fluorescence, it is interesting that the GFP-like proteins but not the Aequorea GFP mutants generate fluorescent dots.
Because lysosomes have an acidic lumen (pH<5), one possibility is that although the Aequorea GFP mutants are present in lysosomes, their fluorescence is quenched by the acidic pH. In fact, pH-sensitivity differs between the two groups. DsRed, mRFP1, and zFP506 are all stable in a broad pH range (Fig. 4A), whereas EGFP loses its fluorescence at low pH (<5) (Fig. 4B). ECFP and Sapphire are also sensitive to acids but to a lesser extent than EGFP (Fig. 4B). If EGFP, ECFP, and Sapphire are quenched in lysosomes, their fluorescence could be maintained by blocking lysosome acidification. To examine this possibility, we treated cells with NH4Cl to alkalize the lysosomal lumen. However, the treatment did not result in formation of fluorescent dots in cells expressing EGFP, ECFP, or Sapphire (Fig. 4F–H, 4L–N).
 View Details | Fig. 4. Sensitivity of GFP-like proteins and Aequorea GFPs to acid quench and enzymatic degradation. (A) pH dependencies of fluorescence of GFP-like proteins: DsRed (solid circles), mRFP1 (open circles), and zFP506 (grey triangles). (B) pH dependencies of fluorescence of Aequorea GFPs: EGFP (solid circles), ECFP (open circles), and Sapphire (grey triangles). (C–N) Effect of intra-lysosomal alkalization with NH4Cl on fluorescence and stability. Three days post transfection, HeLa cells were imaged (C–H), treated with 30 mM NH4Cl, and then imaged again (I–N). Scale bar, 10 μm. (O) Recombinant fluorescent proteins (lanes 1–3, DsRed; lanes 4–6, mRFP1; lanes 7–9, zFP506; lanes 10–12, EGFP; lanes 13–15, ECFP; lanes 16–18, Sapphire) were incubated at pH 7.4, pH 5.0 or pH 5.0 with lysosomal contents (LC) for 18 hours at 37°C. The samples were analyzed by SDS-PAGE and stained with Coomassie Brilliant Blue (top panel) or by native-PAGE and visualized using a UV-illuminator (bottom panel). (P) The densities of bands on SDS-PAGE (O) were normalized to the value at pH 7.4. Data represent the means±S.D. of three independent experiments. *P<0.05, **P<0.005. |
Next we examined the second possibility that the Aequorea GFPs are not present in lysosomes because they are degraded by lysosomal enzymes. We incubated fluorescent proteins at pH 5.0 in the absence or presence of lysosomal contents, and then analyzed them by SDS-PAGE and Native-PAGE. All six fluorescent proteins were intact after treatment at pH 5.0 (Fig. 4O, lanes 1 vs. 2, 4 vs. 5, 7 vs. 8, 10 vs.11, 13 vs. 14, and 16 vs. 17; Fig. 4P, open and solid bars), and retained their fluorescent properties (Native-PAGE) (Fig. 4O, lanes 1 vs. 2, 4 vs. 5, 7 vs. 8, 10 vs.11, 13 vs. 14, and 16 vs. 17). However, incubation with lysosomal contents at pH 5.0 showed distinct effects on the two groups (Fig. 4O, lanes 3, 6, 9, 12, 15, and 18; Fig. 4P, red bar). While the fluorescence of DsRed, mRFP1, or zFP506 was retained although their size was slightly reduced (Fig. 4O and 4P, left), all of the Aequorea GFP mutants (EGFP, ECFP, and Sapphire) were degraded (Fig. 4O and 4P, right).
These results suggest that the GFP-like proteins can stably accumulate in lysosomes and retain their fluorescence whereas the Aequorea GFP mutants are degraded in these organelles, consistent with the immunoelectron microscopic data that show the presence of mRFP1 and the absence of EGFP in lysosomes (Fig. 3F and 3G, respectively). EGFP and mRFP1 are the representative monomeric versions of Aequorea GFP and GFP-like protein, respectively. When they were compared in terms of their resistance to guanidine hydrochloride, EGFP was considerably less stable than mRFP1 (Verkhusha et al., 2003; Stepanenko et al., 2004).
In Aequorea GFP, a replacement of histidine with glycine at position of 148 (H148G) increases acid-sensitivity (Wachter et al., 1998). Equivalent mutations were introduced into mRFP1 and zFP506. The resulting mutants, mRFP1 (S146G) and zFP506 (S148G), were both quenched by acids (Fig. 5A and 5B, respectively). However, these two mutants differed in their stability in lysosomes. While mRFP1 (S146G) was resistant to lysosomal proteases (Fig. 5K and 5L, left), zFP506 (S148G) was digested by these proteases (Fig. 5k and 5l, right). Transfection of mRFP1 (S146G) or zFP506 (S148G) into HeLa cells gave a similar homogeneous distribution of fluorescence (Fig. 5D and 5F, respectively). However, the reasons why these mutants failed to form fluorescent dots are different for the two cases. mRFP1 (S146G) was acid quenched in lysosomes, while zFP506 (S148G) was not present due to complete degradation by lysosomal proteases. Consistent with these biochemical results, fluorescent dots appeared after treatment with NH4Cl in mRFP1 (S146G)-expressing cells (Fig. 5H), but not in zFP506 (S148G)-expressing cells (Fig. 5J).
 View Details | Fig. 5. Sensitivity of mRFP1 and zFP506 and their mutants to acid quench and enzymatic degradation. (A) pH dependencies of fluorescence of mRFP1 (solid circles) and mRFP1(S146G) (open circles). (B) pH dependencies of fluorescence of zFP506 (solid circles) and zFP506 (S148G) (open circles). (C–J) Effect of intra-lysosomal alkalization with NH4Cl on fluorescence and stability. Three days post transfection, HeLa cells were imaged (C–F), treated with 30 mM NH4Cl, and then imaged again (G–J). Scale bar, 10 μm. (K) Recombinant fluorescent proteins (lanes 1–3, mRFP1; lanes 4–6, mRFP1 (S146G); lanes 7–9, zFP506; lanes 10–12, zFP506 (S148G) were incubated at pH 7.4, pH 5.0 or pH 5.0 with lysosomal contents (LC) for 18 hours at 37°C. The samples were analyzed by SDS-PAGE and stained with Coomassie Brilliant Blue (top panel) or by native-PAGE and visualized using a UV-illuminator (bottom panel). (L) The densities of bands on SDS-PAGE (K) were normalized to the value at pH 7.4. Data represent the means±S.D. of three independent experiments. *P<0.005. |
Protein aggregation is attracting the attention of the researchers who are interested in quality control of protein folding. As with cellular proteins, investigating aggregation of GFP-like proteins is challenging because it is difficult to quantify aggregation. When connexin (Cx) tagged with DsRed was expressed in HeLa cells, there was a distinct change in ER appearance and aggregates were observed in perinuclear regions (Lauf et al., 2001). Because Cx and DsRed oligomerize into hexameric and tetrameric structures, respectively, the fusion protein seemed to make a massive aggregate through crosslinking. However, aggregation occurs in non-fused GFP-like proteins regardless of their oligomerization. Such aggregated structures were detected as high molecular weight complexes in pseudo-native gel-electrophoresis (Yanushevich et al., 2002), as fluorescent precipitates in bacteria (Jakobs et al., 2000), or as punctate structures in the cytoplasm of cultured mammalian cells (Yanushevich et al., 2002). Aggregation may be due to electrostatic or hydrophobic interactions between GFP-like proteins. Recent studies support the role of electrostatic interactions in aggregation; mutants of GFP-like proteins generated by removing basic residues located near their amino termini did not form visible precipitates in 293T cells; a non-aggregating DsRed2 mutant was made by introducing three mutations (Arg2Ala, Lys5Glu, and Lys9Thr) into the amino terminus of DsRed (Yanushevich et al., 2002).
In this study, however, we demonstrated that the visible precipitates in the cytoplasm are lysosomes that have accumulated acid-resistant and non-degradable GFP-like proteins. We further characterized the non-aggregating mutant, DsRed2. Although neither DsRed nor DsRed2 was degraded at low pH regardless of the presence of lysosomal contents (Fig. 6E), DsRed2 was more acid sensitive (Fig. 6F, G). The difference in acid sensitivity between DsRed and DsRed2 was more prominent when the protein samples were incubated at 37°C for 18 hours. During this incubation, DsRed2 was irreversibly denatured and its fluorescence did not recover after the pH was returned to 7.4 (Fig. 6F, G). Consistent with these biochemical data and the previous literature (Yanushevich et al., 2002), transfection of DsRed2 resulted in much less fluorescent dots in the cytoplasm of HeLa cells than DsRed, and alkalization with NH4Cl did not substantially change their appearance (Fig. 6A–D).
 View Details | Fig. 6. Different properties of DsRed and DsRed2 in HeLa cells. (A–D) Intra-lysosomal alkalization with NH4Cl. Three days post transfection, cells were imaged (A, B), treated with 30 mM NH4Cl, and then imaged again (C, D). Scale bar, 10 μm. (E) After incubation at pH 7.4, pH 5.0 or pH 5.0 with LC for 18 hours at 37°C, samples containing recombinant proteins were analyzed by SDS-PAGE and stained with Coomassie Brilliant Blue. The densities of bands were normalized to the value at pH 7.4. Data represent the means±S.D. of three independent experiments. (F) After incubation at pH 7.4, pH 5.0 or pH 5.0 with LC for 18 hours at 37°C, samples containing recombinant proteins were subjected to native-PAGE and visualized using a UV-illuminator. The fluorescence intensities of bands were normalized to the value at pH 7.4. Data represent the means±S.D. of three independent experiments. *P<0.05, **P<0.005. (G) After incubation of solutions containing recombinant proteins at pH 7.4 or pH 5.0 for 18 hours at 37°C, pH was adjusted at pH 7.4 or pH 5.0. The fluorescence intensities of solutions were measured and normalized to the value at pH 7.4. Data represent the means±S.D. of three independent experiments. *P<0.05, **P<0.005. |
Fig. 7 diagrams the GFP-like proteins tested in this study and categorizes them based on their sensitivity to acid and lysosomal enzymes.
 View Details | Fig. 7. Classification of fluorescent proteins according to their sensitivities to lysosomal-degradation and acid-quenching. |
Taking advantage of the tolerance of the GFP-like proteins, we attempted to create a robust fluorescent probe for lysosomal compartments. When zFP506 was fused to Cathepsin B, a lumenal lysosomal resident protein, the chimeric protein illuminated the acidic compartments more brightly than Cathepsin B-EGFP (Linke et al., 2002) (Fig. 8).
 View Details | Fig. 8. CathepsinB-zFP506 labels lysosomes better than CathepsinB-EGFP. CHO cells were transfected with the cDNAs of CathepsinB-zFP506 (A, B) and CathepsinB-EGFP (C–E) and the images were acquired two days later. Differential interference contrast images (A, C) and fluorescence images (B, D) are shown. The sensitivity of CCD camera was the same in (B) and (D), and 10 times higher in (E). Scale bar, 10 μm. |
What are the mechanisms for lysosomal localization of the GFP-like proteins? One of the candidate pathways includes autophagy (macroautophagy), an intracellular bulk degradation system in which cytoplasmic components are directed to lysosomes by membrane engulfment (Klionsky and Emr, 2000; Ohsumi, 2001; Mizushima et al., 2002). Cytoplasmic constituents are first enclosed by double- or multiple-membrane structures called autophagosomes. Eventually, autolysosomes are generated by the fusion of the outer membranes of the autophagosomes and lysosomes. Lysosomal hydrolases degrade the cytoplasm-derived contents of the autophagosome, together with its inner membrane. Several proteins involved in macroautophagy were identified in yeast (Ohsumi, 2001), and their functions were characterized in mammalian cells (Mizushima et al., 2001). For instance, a disruption of Atg5 prevents autophagosome formation. To test if macroautophagy is involved in targeting GFP-like proteins to lysosomes, we examined the appearance of fluorescent dots in MEF cells prepared from Atg5-deficient mice. Fluorescent dots were formed in the Atg5-deficient MEF cells as seen in wildtype MEF cells (Fig. 9A–E). To verify the lysosomal localization of the dots in Atg5-deficient MEF cells, immunocytochemistry using anti-lysosome-associated membrane protein 2 (LAMP-2) was performed (Fig. 9F–K); anti-LAMP-2 antibody proved to work better than anti-LAMP-1 antibody in cells from mice. Cell biological studies are now underway to determine if a new type of autophagy or other cellular process is involved in the accumulation of GFP-like proteins in lysosomes.
 View Details | Fig. 9. Formation of fluorescent dots in Atg5-deficient MEF cells. (A–D) Fluorescent images of wildtype (A, B) or Atg5-deficient (C, D) MEF cells expressing mRFP1 (A, C) or Aequorea EGFP (B, D). Cells were imaged two days post transfection. Scale bar, 10 μm. (E) Fraction of dot-bearing cells of transfected cells. Over 200 cells were counted for each experiment. Data represent means±S.D. of three independent experiments. (F–K) Wildtype (F–H) or Atg5-deficient (I–K) cells were transfected with the cDNA for mRFP1. Two days post transfection, cells were fixed, permeabilized, and stained with an antibody to LAMP2 and imaged using a confocal microscope. Scale bar, 10 μm. |
Supposing that autophagy is a non-selective degradation system, Aequorea GFPs as well as GFP-like proteins may be transported from the cytosol to lysosomes. Alternatively, transport to lysosomes may depend on cytosolic protein aggregation. GFP-like proteins may aggregate in the cytosol triggering transport of thevaggregates from the cytosol to the lumen of lysosomes. If this hypothesis is correct, the Aequorea GFP mutants may avoid lysosomal transport because they do not aggregate. Further studies are necessary to examine these potential differences between Aequorea GFPs and GFP-like proteins.
We are grateful to Dr. Katherine H. Karlson for the gift of pS65T/EGFP/CFTR ΔF508 and Dr. Klaudia Brix for pCathepsinB-EGFP. We would like to thank David Mou for critical reading of the manuscript. This work was partly supported by grants from the Molecular Ensemble Development Research, Japan MEXT Grant-in-Aid for Scientific Research on priority areas, and the Human Frontier Science Program.
|