| To whom correspondence should be addressed: Akira Nagafuchi, Department of Biology, School of Medicine, Nara Medical University, 840 Shijo-cho, Kashihara, Nara 634-8521, Japan. Tel/Fax: +81–744–25–3345 E-mail: nagasan@naramed-u.ac.jp Abbreviations: KO, knockout; nE, nonfunctional E-cadherin; Eα, E-cadherin-α-catenin fusion protein |
The cadherin-catenin cell-adhesion complex consists of three proteins—cadherin, α-catenin, and β-catenin (or plakoglobin) (Ozawa et al., 1989; McCrea et al., 1991; Nagafuchi et al., 1991; Herrenknecht et al., 1991). Cadherin is a transmembrane protein with a long extracellular domain, a transmembrane domain, and a short cytoplasmic domain (Nagafuchi et al., 1987; Nose et al., 1987; Hatta et al., 1988). α-catenin is a cytoplasmic protein with actin-binding activity that also binds to other actin-binding proteins such as vinculin and ZO-1 (Rimm et al., 1995; Itoh et al., 1997; Watabe-Uchida et al., 1998; Weiss et al., 1998; Imamura et al., 1999; Yonemura et al., 2010). β-catenin is an armadillo family protein that functions in cadherin-based cell adhesion and the Wnt signaling pathway (McCrea et al., 1991, Peifer et al., 1993). Two proteins, β-catenin and a related protein, plakoglobin, play a central role in formation of the cadherin-catenin complex because they bind directly to the C-terminal region of the cadherin cytoplasmic domain and the N-terminal region of α-catenin (Aberle et al., 1994).
A deletion mutant of E-cadherin that lacks the β-catenin binding region, called nonfunctional E-cadherin (nE), fails to form a complex with other catenins and fails to mediate cell adhesion (Nagafuchi and Takeichi, 1988). The nE protein is covalently linked to the C-terminal half of α-catenin in an E-cadherin-α-catenin fusion protein (Eα). Expression of exogenous Eα, like expression of exogenous cadherin, confers strong cell adhesion activity to cadherin-deficient cells, such as mouse fibroblast L cells (Nagafuchi et al., 1994). This finding indicates that direct interaction between the C-terminal region of α-catenin and cadherin is necessary and sufficient for the strong adhesive function of cadherin.
The α-catenin C-terminal-half can bind ZO-1 (Imamura et al., 1999), and in non-epithelial cells, such as cardiac muscle cells, ZO-1 colocalizes with cadherin-based cell-cell contact sites (Itoh et al., 1993). In cadherin-deficient L cells, ZO-1 is localized to the cell periphery, not to cell-cell contact sites. Following exogenous cadherin expression in L cells, ZO-1 localized to cadherin-based cell-cell junctions, which mediate strong cell adhesion (Itoh et al., 1993). Interestingly, ZO-1 localized to Eα-based adhesion sites in L cells expressing the Eα (Imamura et al., 1999). Thus, ZO-1 localization is affected by the cadherin-catenin complex and particularly by the C-terminal half of α-catenin in non-epithelial cells. However, ZO-1 mainly localized to claudins and occludin-based tight junctions, rather than to cadherin-based adherens junctions, in epithelial cells (Anderson et al., 1988; Stevenson et al., 1986; Furuse et al., 1994; Itoh et al., 1999). In fact, even in the absence of ZO-1 and related proteins, cadherin-based junctions, spot adherens junctions, are formed in epithelial cells (Umeda et al., 2006). Thus, relationship between cadherin-catenin complex and ZO-1 is complex and not fully characterized.
Cadherin-mediated strong cell adhesion is supported by the actin-based cytoskeleton (Hirano et al., 1987). Cadherin-associated α-catenin may play a critical function in actin bundle formation at junctions through direct interactions with other actin-binding proteins or by binding actin filaments directly (Gates and Peifer, 2005). However, some reports claim that cytoplasmic α-catenin, rather than cadherin-associated α-catenin, plays critical roles in actin organization (Drees et al., 2005; Benjamin et al., 2010).
F9 is a mouse teratocarcinoma cell line that has strong cadherin-mediated cell adhesion activity (Berstine et al., 1973; Takeichi et al., 1981). We isolated several mutant F9 cells that lack α-catenin, β-catenin, and/or plakoglobin using gene-targeting strategies (Maeno et al., 1999; Fukunaga et al., 2005). Using α-catenin-deficient F9 cells, we revealed that α-catenin is required for strong cadherin-mediated cell adhesion. We also demonstrated that α-catenin expression is required for ZO-1 localization at cell-cell contact sites (Maeno et al., 1999). These findings indicate that E-cadherin-catenin complexes regulate ZO-1 localization even in F9 cells. Using β-catenin/plakoglobin double-null F9 cells, BP-2K cells (previously called BPD), we revealed that β-catenin or plakoglobin supports cadherin-based cell adhesion probably by targeting cadherin to the plasma membrane (Fukunaga et al., 2005). However, we had failed to isolate E-cadherin-null F9 cells previously.
Here, to define the roles of α-catenin in cell-cell adhesion, we modified BP-2K cells to generate cells that are also lacking E-cadherin (BPE-3K cells). Then, using BPE-3K cells, we isolated F9-derivative cells that lacked all four main cadherin-catenin complex components, β-catenin, plakoglobin, E-cadherin and α-catenin (BPEA-4K cells). Moreover, we isolated BP-2K, BPE-3K, and BPEA-4K cells that expressed Eα (Eα-BP-2K, Eα-BPE-3K, and Eα-BPEA-4K, respectively). Comparisons between Eα-BP-2K and Eα-BPE-3K suggested that endogenous E-cadherin perturbed Eα function in the absence of β-catenin and plakoglobin. Comparison between Eα-BPE-3K and Eα-BPEA-4K clearly showed that cytoplasmic α-catenin was not required for Eα function. A comparison between F9 and Eα-BPEA-4K cells revealed that there were two types of cadherin-based cell-cell contact/adhesion sites, those with ZO-1 and those without ZO-1, and the sites with ZO-1 were associated with thick actin bundles, while the sites lacking ZO-1 were not.
Mouse teratocarcinoma F9 cells and their derivatives (Berstine et al., 1973) were cultured in Dulbecco’s modified Eagle medium containing 10% heat-inactivated fetal calf serum. Culture dishes or cover slips were pre-coated with 0.2% gelatin for 15 min. Isolation of BP-2K (previously called BPD) cells was reported previously (Fukunaga et al., 2005). For each experiment, cells were transferred to fresh culture dishes 1 day before the experiment. Phase contrast microscopic images were acquired using an ECLIPSE TS100 microscope (Nikon, Tokyo, Japan) equipped with a Coolpix 990 digital camera (Nikon). Typical images were represented for each cell line.
E-cadherin genomic clones were isolated from a 129/Sv mouse genomic library (kindly provided by Dr. O. Chisaka). The E-cadherin targeting vector, pET2-RE-PEn2SIBP, comprised the following five distinct fragments: 1) a 28-bp repressor element, 2) a 2.8-kb KpnI-XhoI fragment that included E-cadherin exons 6–8, 3) the PEn2SIBP trap-selection cassette, 4) a 5.6-kb ApaI-AccI fragment that included a portion of E-cadherin exon 16, and 5) a pBluescript SK- plasmid. The repressor element was derived from the type II sodium channel gene (Kraner et al., 1992) and designed to repress expression of the drug-resistance gene if the targeting construct randomly integrated into genomic DNA. In PEn2SIBP, the splicing acceptor of PSIBP (Maeno et al., 1999) was replaced with an en-2 sequence that included a splice acceptor (Gossler et al., 1989; Mountford et al., 1994). The en-2 sequence was an EcoRI-ClaI fragment from pGT1.8IREShygropA2 (kindly provided by Dr. H. Niwa).
The pET2-RE-PEn2SIBP plasmid (81 μg) was linearized with NotI and transformed into 2×10⁷ BP-2K cells in 0.4 ml of HEPES-buffered saline via electroporation at 250 V and 960 μF using a gene pulser. To isolate cells with a targeting construct inserted into one of the three E-cadherin alleles present in BP-2K cells, transformed cells were subjected to G418 selection at 361 μg/ml for 2 weeks and at 100 μg/ml for another 3 days. To isolate cells with targeting constructs inserted into two of the three (double knockout (KO) BP-2K cells) and three of the three (triple KO BP-2K cells) E-cadherin alleles present in BP-2K cells, the E-cadherin single KO BP-2K cells were subjected to G418 selection at 1.5–2.0 mg/ml for 16 days. The G418-resistant clones, which formed single colonies after multiple rounds of selection, were isolated and propagated.
The targeting vector and methods used to knock out α-catenin in BPE-3K cells were similar to those used in our previous study (Maeno et al., 1999), except that α-catenin double KO BPE-3K cells were isolated using a higher concentration of G418 for selection rather than reintroducing the α-catenin targeting construct into single KO cells via electroporation.
Excision of the trap-cassettes was performed as previously reported. In brief, cells were transiently transfected with a Cre recombinase expression construct, Cre-pac, (Taniguchi et al., 1998) and cells, which expressed the Cre recombinase transiently, were subcloned following transient puromycin treatment.
Genomic DNA preparation and Southern blot analysis were performed as described previously (Maeno et al., 1999; Saitou et al., 1997). Correct targeting insertion was confirmed by hybridization with a probe specific to the targeted genes. Correct integration of a single targeting construct into cells was checked by hybridization using a probe specific to the β-geo (Fig. 1) sequence in PSIBP or PEn2SIBP trap-selection cassettes.
The following primary antibodies were used for immunocytochemical and immunoblot analyses: rat anti-mouse E-cadherin monoclonal antibody (mAb) (ECCD-2; Shirayoshi et al., 1986), rat anti-mouse α-catenin mAb (α18; Nagafuchi and Tsukita, 1994), mouse anti-rat ZO-1 mAb (T8-754; Itoh et al., 1993), mouse anti-β-catenin and mouse anti-γ-catenin (plakoglobin) mAbs (BD Transduction Laboratories), and anti-α-tubulin mAb (DM1A; Sigma-Aldrich). FITC- or Cy3-conjugated donkey anti-mouse and anti-rat IgG (Jackson Immunoresearch, West Grove, PA) were used as secondary antibodies. Alexa Fluor 488- or 568-labeled phalloidin (Molecular Probes) was used to stain filamentous actin (F-actin).
SDS-PAGE and immunoblotting were performed as previously described (Imamura et al., 1999). Cultured cells (1-day old) were washed with HEPES-buffered Ca2+, Mg2+ -free saline (HCMF; Takeichi, 1977) and immediately solubilized and boiled in 1×SDS sample buffer (0.125 M Tris-HCl, pH 6.8, 2% SDS, 10% glycerol, 0.002% bromophenol blue, and 5% 2-mercaptoethanol). Proteins in lysates derived from 1.25×10⁵ cultured cells were separated by SDS-PAGE and transferred to nitrocellulose sheets via electrophoresis. Nitrocellulose membranes were then sequentially incubated with primary and secondary antibody. Secondary antibody detection was performed using a biotin-streptavidin kit (GE Healthcare) according to the manufacturer’s instructions. Typical results were represented for each experiment. Semi-quantification of expression levels of E-cadherin and its derivatives was made with a freeware Image J.
Cells were trypsinized using two different methods for the differential removal of E-cadherin, as previously described (Takeichi, 1977). In brief, cells were treated with 0.01% trypsin either in the presence of 1 mM CaCl2 (TC-treatment) or in the presence of 1 mM EDTA (TE-treatment) at 37°C for 15 min. Generally, cadherins remain intact following TC-treatment but are digested following TE-treatment. For the cell dissociation assay, 1-day-old confluent cell monolayers grown in 6-cm dishes were treated with TC or TE and dissociated by drawing the cell suspension through a pipette 10 times (Nagafuchi et al., 1994). The extent of dissociation was represented by the cell dissociation index NTC/NTE, where NTC and NTE represent the total particle number after vigorous pipetting of TC and TE treated cells, respectively.
We constructed pCAG-EαC and pCAG-EM22 expression vectors for the Eα and nE molecules, respectively. For this purpose, we used four previously reported plasmids: a) pBATEαC, a β-actin promoter-based expression vector for an E-cadherin-α-catenin fusion, nEαC(509-906) (Nagafuchi et al., 1994), b) pCAG-neo-KS, a CAG promoter-based basic expression vector with a multicloning site (Niwa et al., 1991; Shimizu et al., 2008), c) pBATEM22, a β-actin promoter-based expression vector for a nonfunctional E-cadherin (Nagafuchi and Takeichi, 1988), d) pCAG-EM2, a CAG promoter-based expression vector for the full length E-cadherin (Shimizu et al., 2008). A BglII(blunted)-XbaI fragment from pBATEαC was inserted between the EcoRV and XbaI sites of pCAG-neo-KS to generate pCAG-EαC. The XhoI-XbaI fragment of pCAG-EM2 was replaced with the XhoI-XbaI fragment of pBATEM22 to generate pCAG-EM22.
For isolation of stable transfectants, expression vectors were transfected into appropriate cells using the Lipofectamin 2000 system (Invitrogen, Carlsbad, CA). Cells were subjected to G418 selection at 400 μg/ml for 2 weeks. At least three clones, which express introduced proteins at relatively high level, were isolated for each expression vector, and the clonal line that exhibited the most consistent phenotype was chosen to represent each expression vector in further experiments.
Confluent cells, which were cultured for 1 day on 15 mm 0.2% gelatin-coated cover slips were fixed, permeabilized, and then sequentially incubated with primary and secondary antibodies as previously described (Komiya et al., 2005). Cells were fixed with 3.5% formaldehyde solution for 15 min and permeabilized with 0.1% Triton X-100 for 10 min. Samples on coverslips were incubated with Alexa Fluor 488- or 568-labeled phalloidin instead of the secondary antibody to stain F-actin. Samples were mounted onto slides using a SlowFade Light Antifade kit (Molecular Probes). A FLUOVIEW FV1000 confocal microscope (Olympus) with a 60×/1.35 NA UPLSAPO objective was used to acquire the confocal images. Adjustments of brightness, contrast, color balance, and final image size were made with Adobe Photoshop CS5. Typical images were represented for each cell line.
To define the roles of α-catenin in cell-cell adhesion, we introduced cadherin-α-catenin fusion protein, Eα, into cells lacking all cadherin-catenin complex components. For this purpose, we isolated E-cadherin-null BP-2K cells using a targeting construct, pET2-RE-PEn2IBP (Fig. 1A). Following electroporation of the targeting vector, we isolated 200 G418-resistant BP-2K clones. Southern blot analysis indicated that a single E-cadherin allele had been knocked out in 2 G418-resistant BP-2K clones. Comparison of the signal from the wild-type allele with the signal from the KO allele suggested that there might be three E-cadherin alleles in BP-2K cells (Fig. 1B, lanes 2 and 6). Previous studies demonstrate that F9 cells have three alleles of some genes due to karyotype abnormalities (Stephens et al., 1993).
 View Details | Fig. 1. Targeted inactivation of the E-cadherin gene in β-catenin/plakoglobin-double null F9 cells. A: The structures of the wild-type E-cadherin allele, the E-cadherin KO targeting vector, the allele with the integrated targeting construct, the E-cadherin deletion allele following Cre treatment, and the PEn2SIBP trap-selection cassette are shown together with the pertinent restriction enzyme sites. Closed boxes indicate exon 4 to 16 from left to right. The probes for Southern blot analysis, Probe A for E-cadherin and Probe B for β-geo, are shown. The restriction enzymes used for Southern analyses and the expected lengths of the restriction fragments detected with probe A (white, red, and blue arrowheads and bars, respectively) are also shown. B and C: Southern blot analyses of DNA derived from each cell clone. Genomic DNA was digested with each restriction enzyme and hybridized with Probe A shown in 1 A. D: Western blot analysis of each cell clone with anti-E-cadherin mAb. Note that the expression of E-cadherin was completely lost in ET cells. α-tubulin (α-tub) levels were used as an internal control (lower panel). BP-2K: β-catenin/plakoglobin-double null F9 cells. ES(G), ED(G), and ET(G); E-cadherin single, double and triple KO BP-2K cells. ES, ED, and ET; ES(G), ED(G) and ET(G) cells lacking a trap-selection cassette following Cre treatment. ET cells, E-cadherin-null BP-2K cells lacking a trap-selection cassette, were designated BPE-3K cells, β-catenin/plakoglobin and E-cadherin triple KO cells. |
To remove the second and third E-cadherin alleles, cells from one E-cadherin single-KO cell line (clone 2) were cultured in medium with a higher concentration of G418, and we isolated 41 G418 resistant clones from this subculture. Southern blot analysis indicated that 40 clones had two E-cadherin alleles knocked out and 1 clone had three E-cadherin alleles knocked out. We chose clone 2–17 as the E-cadherin double-KO cell line (Fig. 1B, lanes 3 and 7) and clone 2–36 as the triple-KO cell line (Fig. 1B, lanes 4 and 8). Southern blot analysis using a β-geo probe (Fig. 1A, Probe B) indicated that unexpected recombination events had not occurred (data not shown). To remove the G418-resistance gene, E-cadherin single-, double-, and triple-KO cell lines were transiently transfected with a Cre recombinase expression construct, Cre-pac, (Taniguchi et al., 1998) and cells that expressed the Cre recombinase transiently were subcloned following transient puromycin treatment. Southern blot analysis revealed that correct excision of the G418 resistant gene cassette occurred in most of the subclones isolated (Fig. 1C). Following Cre treatment, we isolated β-catenin, plakoglobin, and E-cadherin-triple null F9 cells without a drug-resistant gene (Fig. 1C, lane 7). This triple-null cell line was designated BPE-3K. Immunoblot analysis indicated that E-cadherin expression was completely lost in BPE-3K cells (Fig. 1D). Immunocytochemical analysis also showed that E-cadherin signals were undetected in BPE-3K cells (data not shown. see Fig. 4D and Fig. 5D). We isolated α-catenin-deficient BPE-3K cells using a targeting construct, pαT2-RE-PSIBP, as described previously (see Materials and Methods). These cells were designated BPEA-4K cells because all four major components of cadherin-catenin complex, β-catenin, plakoglobin, E-cadherin and α-catenin were knocked out. Western blot analysis indicated that α-catenin, β-catenin, and E-cadherin were not detected in BPEA-4K cells (Fig. 3A, lane 2).
Eα is a simple, artificial cell-adhesion fusion protein (Fig. 2A) that mimics the roles of the cadherin-catenin complex in cell adhesion and ZO-1 reorganization in mouse L cells (Nagafuchi et al., 1994). As a first step to define the roles of α-catenin in cell-cell adhesion, we isolated BP-2K cells expressing Eα (Eα-BP-2K). Exogenous Eα, however, did not restore full adhesion activity in BP-2K cells (Fig. 2E). We previously reported that Eα conferred full adhesion activity to L cells. BP-2K cells, unlike L cells, express endogenous E-cadherin and do not express β-catenin (Fig. 2 B). Therefore, endogenous E-cadherin may have disturbed the function of the fusion protein or endogenous β-catenin may have been required for its function. To address these two possibilities, we isolated stable BPE-3K transfectants that express Eα (Eα-BPE-3K). BPE-3K cells only differ from BP-2K cells in that BPE-3K cells do not express endogenous E-cadherin; therefore, it is possible to evaluate the effect of endogenous E-cadherin on Eα function. Western blot analysis was used to examine the expression level of E-cadherin, β-catenin, α-catenin, and Eα in F9 and F9-derivative cells (Fig. 2B). The expression level of Eα in Eα-BP-2K and Eα-BPE-3K cells was similar to that in parental F9 cells (Fig. 2B, lanes 4 and 5). The expression level of E-cadherin in BP-2K cells was lower than that in parental F9 cells (Fig. 2B, lanes 1 and 2). E-cadherin expression was not detected in BPE-3K cells, (Fig. 2B, lane 3). Interestingly, the expression level of endogenous E-cadherin in Eα-BP-2K cells was significantly lower than that in BP-2K cells (Fig. 2B, lane 4). Immunocytochemical analysis showed that endogenous E-cadherin and Eα localized to cell-cell contact sites in all cells expressing these molecules (Fig. 2C).
 View Details | Fig. 2. Adhesive function and subcellular distribution of Eα molecules in BP-2K and BPE-3K cells. A: Schematic representation of the E-cadherin-α-catenin fusion molecule. E-cadherin/β-catenin/α-catenin complex (top) and nonfunctional E-cadherin (nE) (middle), and E-cadherin-α-catenin fusion, nEαC(509-906), (Eα) (bottom) are shown. E-cadherin (white and black box), β-catenin (dark gray box), and α-catenin (light gray box) are shown. The carboxyl-terminal portion (black box) of E-cadherin is responsible for β-catenin binding. Nonfunctional E-cadherin (nE) is an E-cadherin deletion mutant (1–657 amino acids of mature E-cadherin) lacking the carboxyl-terminal β-catenin-binding portion (black box) that cannot mediate formation of the cadherin-catenin complex. nEαC(509-906) (Eα) molecule is a fusion molecule between nE mutant and the carboxyl-terminal half (509-906 amino acids) of α-catenin. B: Western blot analysis of total cell lysates derived from each cell clone. E-cad; E-cadherin, Eα; nEαC(509-906) fusion, α-cat; α-catenin and β-cat; β-catenin. The expression level of Eα in Eα-BP-2K and Eα-BPE-3K cells was similar to that of E-cadherin in parental F9 cells (lanes 1, 4 and 5). α-tubulin (α-tub) levels were used as an internal control (Bottom panel). Relative expression levels of E-cadherin in BP-2K and Eα-BP-2K cells to that in F9 cells were 0.70 and 0.11, respectively. Relative expression levels of Eα in Eα-BP-2K and Eα-BPE-3K cells to E-cadherin in F9 cells were 0.74 and 1.16, respectively. C: Immunostaining with the anti-E-cadherin mAb. Single optical x-y sections focused at the upper region of the lateral membrane was acquired with a confocal microscope. Like E-cadherin, the Eα was distributed at the cell-cell contacts in both Eα-BP-2K and Eα-BPE-3K cells. Scale bar=20 μm. D: Phase contrast images. Cells were cultured for 1 day at approximately 40% confluency. In contrast with the non-adhesive phenotype of BPE-3K cells, Eα-BPE-3K cells showed a colony-forming ability similar to that of parental F9 cells. Eα-BP-2K cells displayed an intermediate morphology between that of BP-2K cells and parental F9 cells. Scale bar=50 μm. E: Cell adhesion activity of each cell clone. Cell adhesion activities are represented by the cell dissociation index (NTC/NTE: see Material and Methods). A lower value of NTC/NTE indicates higher cell adhesion activity. Note that the Eα molecule restored strong cell adhesion activity in BPE-3K cells (NTC/NTE: 0.21). Data are expressed as the means of at least three independent experiments. |
The morphology of F9 cells and F9 derivatives was examined (Fig. 2D). Phase contrast microscopic observation showed that F9 cells adhered to each other and formed compact colonies following 1 day of culture in a dish. In contrast, BP-2K and BPE-3K cells displayed a non-adhesive morphology; specifically, these cells grew sparsely on the dishes and did not form colonies. The Eα-BP-2K cells showed partial adhesive morphology; cells formed cell-cell contacts with neighboring cells, but these cells did not form compact colonies. Interestingly, the morphology of Eα-BPE-3K cells was similar to that of parental F9 cells; Eα-BPE-3K cells formed compact colonies. Close observation, however, revealed that Eα-BPE-3K cells were a little flatter and less adhesive than parental F9 cells probably depending on the functional difference of intact E-cadherin and Eα (Nagafuchi et al., 1994). The cell dissociation assay demonstrated that cell adhesion activity was correlated with colony formation phenotypes (Fig. 2E). F9 cells and Eα-BPE-3K cells rarely dissociated and maintained large aggregates following vigorous pipetting. In contrast, BP-2K and BPE-3K cells were easily dissociated into single cells even in the presence of Ca2+. Eα-BP-2K cells had an intermediate dissociation phenotype; these cells rarely dissociated into single cells following vigorous pipetting, but they did not remain in large aggregates (data not shown). The dissociation index of F9 and Eα-BPE-3K cells was significantly lower than that of BP-2K and BPE-3K cells. The dissociation index of Eα-BP-2K cells was an intermediate value (Fig. 2E). These data indicated that endogenous E-cadherin disturbed the activity of Eα in BP-2K cells without affecting its localization. These data also demonstrated that Eα supports full adhesion activity in the absence of endogenous E-cadherin and β-catenin.
We previously reported that Eα expressed in L cells did not form a complex with endogenous α-catenin (Nagafuchi et al., 1994). Moreover, α-catenin protein expression is very low in L cells in the presence of Eα, but it is up-regulated in the presence of E-cadherin (Nagafuchi et al., 1991, 1994). In contrast, α-catenin protein was clearly detected in the absence of E-cadherin, β-catenin, and/or plakoglobin in F9-derivative cell lines (Fig. 2B, lanes 2–5). Furthermore, cytoplasmic α-catenin might play a role that is independent of cadherin expression (Drees et al., 2005; Benjamin et al., 2010). To examine whether endogenous α-catenin was required for Eα function in F9-derivative cells, we isolated BPEA-4K transfectants that stably express Eα (Eα-BPEA-4K). BPEA-4K cells expressing nonfunctional E-cadherin (nE-BPEA-4K) were also isolated as negative control cells (see Fig. 2A). We isolated many stable Eα-BPEA-4K and nE-BPEA-4K clones and chose one clone of each type as representative. The representative clones expressed relatively high levels of the introduced proteins and exhibited the most consistent phenotype. Western blot analysis showed that Eα expression in BPEA-4K cells was comparable to that of E-cadherin in F9 cells (Fig. 3A, lanes 1 and 4). nE expression was lower than that of E-cadherin in F9 cells even in a clone expressing relatively high levels nE (Fig. 3A, lanes 1 and 3). Cell dissociation analysis showed that the dissociation index of Eα-BPEA-4K cells was significantly lower than that of BPEA-4K cells and similar to that of parental F9 cells. The dissociation index of nE-BPEA-4K cells was similar to that of BPEA-4K cells (Fig. 3B). Phase contrast microscopic observation showed that Eα-BPEA-4K cells, like parental F9 cells, formed compact colonies, but BPEA-4K and nE-BPEA-4K cells, like BPE-3K cells, did not form compact colonies (Fig. 3C). Close observation revealed that Eα-BPEA-4K cells, like Eα-BPE-3K, were a little flatter than parental F9 cells probably depending on the functional difference of intact E-cadherin and Eα (Nagafuchi et al., 1994). Eα-BPEA-4K cells, however, formed more compact colonies than Eα-BPE-3K did. Immunofluorescence analysis showed that Eα localized predominantly to cell-cell contact sites (Fig. 4J and Fig. 5J). These data demonstrated that Eα in F9-derivative cells supported strong cell adhesion activity in the absence of endogenous α-catenin.
 View Details | Fig. 3. Eα restored the strong cell-cell adhesion in BPEA-4K cells. A: Western blot analysis of total cell lysates derived from each cell clone. E-cad; E-cadherin, nE; nonfunctional E-cadherin, Eα; nEαC(509-906) fusion, α-cat; α-catenin, and β-cat; β-catenin. The expression level of Eα molecule in Eα-BPEA-4K cells was similar to that of E-cadherin in parental F9 cells (lanes 1 and 4). Expression level of nE was lower than that of E-cadherin in F9 cells even in a clone expressing relatively high levels of nE (lanes 1 and 3). α-tubulin (α-tub) levels were used as an internal control (bottom panel). Relative expression levels of nE in nE-BPEA-4K cells and Eα in Eα-BPEA-4K cells to E-cadherin in F9 cells were 0.40 and 1.53, respectively. B: Cell adhesion activity of each cell clone. Cell adhesion activities are represented by the cell dissociation index (NTC/NTE: see Materials and Methods). A lower value of NTC/NTE indicates higher cell adhesion activity. Note that Eα-BPEA-4K showed strong cell adhesion activity (NTC/NTE: 0.136). Data are expressed as the means of at least three independent experiments. C: Phase contrast images of each cell clone. Relative to the disperse phenotype of BPEA-4K and nE-BPEA-4K cells, Eα-BPEA-4K cells showed colony-forming ability similar to that of parental F9 cells. Scale bar=50 μm. |
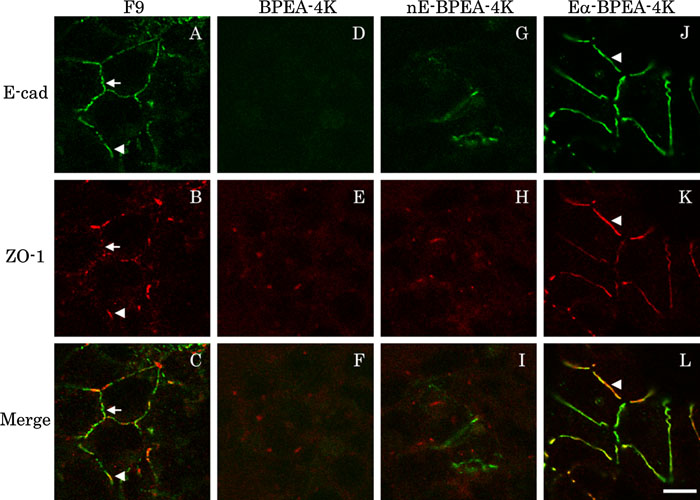 View Details | Fig. 4. Subcellular distribution of E-cadherin, nE, Eα and ZO-1. Each cell clone was doubly stained with anti-E-cadherin (green) and anti-ZO-1 (red) mAbs. Single optical x-y section at the upper region of the lateral membrane was acquired by the confocal microscope. Green and red channel images of each section are superimposed (Merge). Eα in BPEA-4K cells (J) was concentrated at cell-cell contacts in a more linear and continuous fashion than E-cadherin in parental F9 cells (A). nE in BPEA-4K cells was detected on a limited number of cells without special localization (G). In parental F9 cells, ZO-1 was partially co-localized with E-cadherin (A–C, arrowhead, a ZO-1-positive region; arrow, a ZO-1-negative one). In Eα-BPEA-4K cells, ZO-1 staining was present along almost all Eα signals at cell-cell contacts (J–L, arrowhead). In both BPEA-4K and nE-BPEA-4K cells, ZO-1 was localized to the cell periphery, not to cell-cell contact sites (E and H). Scale bar=10 μm. |
 View Details | Fig. 5. Subcellular distribution of E-cadherin, nE, Eα, and F-actin. Each cell clone was doubly stained with anti-E-cadherin mAb (green) and phalloidin (red). Single optical x-y sections focused at the upper region of the lateral membrane were acquired using a confocal microscope. Green and red channel images of each section are superimposed (Merge). The expression of Eα induced actin remodeling to form thick actin bundles at cell-cell contact sites (K), but expression of nE did not alter the F-actin distribution (E and H). Eα co-localized with thick actin bundles (J–L, arrowhead). In parental F9 cells, short actin bundles were detected at cell-cell contact sites (B, arrowhead). Two distinct E-cadherin signals seemed to exist in F9 cells: those associated with dense F-actin staining (A–C, arrowhead) and those associated with sparser F-actin staining (A–C, arrow). Scale bar=10 μm. |
We evaluated the role of E-cadherin, nE and Eα on ZO-1 localization and actin filament organization by comparing F9, BPEA-4K, nE-BPEA-4K and Eα-BPEA-4K cells (Fig. 4 and Fig. 5). In parental F9 cells, ZO-1 partially co-localized with E-cadherin at cell-cell contact sites, as previously reported (Fig. 4A–C, Chiba et al., 2003). In BPEA-4K cells lacking the cadherin-catenin complex, E-cadherin was not detected and ZO-1 localized to the cell periphery, but not to cell-cell contact sites (Fig. 4D–F). Expression of Eα, but not nE, in BPEA-4K cells dramatically changed ZO-1 localization (Fig. 4G–L). In Eα-BPEA-4K cells, most Eα signal at cell-cell contact sites overlapped with ZO-1 signal (Fig. 4J–L). In nE-BPEA-4K cells, ZO-1 localization was similar to that in BPEA-4K cells (Fig. 4H). Because ZO-1 is an actin filament-binding protein, we examined actin filament localization in each cell line. In parental F9 cells, signal from actin-filaments partially overlapped with signal from E-cadherin at cell-cell contact sites; some E-cadherin signals co-localized with actin filament signals, although others did not. Moreover, actin filaments also localized to the cytoplasm. Consequently, it was not clear whether actin filaments were consistently co-localizing with E-cadherin (Fig. 5A–C). In BPEA-4K and nE-BPEA-4K cells, actin filaments showed irregular localization near the plasma membrane and in the cytoplasm (Fig. 5E and H). In Eα-BPEA-4K cells, actin-filaments formed thick bundles at cell-cell contact sites and most Eα signal was associated with signal from actin filament bundles (Fig. 5J–L). These results indicated that cell-cell contact sites with ZO-1 were associated with actin-filament bundles. To confirm this assertion, actin filament localization was compared with ZO-1 localization in parental F9 cells, and actin filament signals were detected at most cell-cell contact sites with ZO-1 (Fig. 6). These data suggested that there are at least two types of junctions in F9 cells, junctions with ZO-1 and those without ZO-1. Eα probably supported only junctions with ZO-1 localization.
 View Details | Fig. 6. Spatial correlation between actin bundles and ZO-1 in parental F9 cells. Immunofluorescent double staining for phallodin (green) and anti-ZO-1 mAb (red) was conducted. At ZO-1-positive cell-cell contacts, the F-actin staining was intense (arrowhead). Scale bar=10 μm. Single optical x-y sections at the upper region of the lateral membrane were obtained using a confocal microscope. Green and red channel images were merged (Merge). |
We previously reported the isolation of BP-2K (previously called BPD) cells, which are F9 cell derivatives with inactivated β-catenin and plakoglobin genes. In this study, we used BP-2K cells to generate and isolate BPE-3K cells, which lacked β-catenin, plakoglobin, and E-cadherin, and BPEA-4K cells, which lacked all four main components of the cadherin-catenin complex—β-catenin, plakoglobin, E-cadherin, and α-catenin. Using these cell lines and derivatives that expressed an E-cadherin-α-catenin fusion (Eα), we clearly demonstrated that cytoplasmic α-catenin was not required for cell adhesion and actin cytoskeleton organization. Here, we discuss the roles of α-catenin in cadherin-based cell adhesion and organization of the actin-based cytoskeleton. We also discuss cell-cell junctions with and without ZO-1 in the context of the cadherin-catenin complex. Finally, we discuss the advantage of KO F9 cells for functional analysis of the cadherin-catenin complex components.
The roles of α-catenin in cell adhesion and cytoskeleton organization have not been investigated under the condition of complete loss of cytoplasmic α-catenin (Maeno et al., 1999). Here, we showed that Eα, an E-cadherin-α-catenin fusion protein, mediated strong cell adhesion and affected actin filament organization and ZO-1 localization independently of cytoplasmic α-catenin. Reportedly, cytoplasmic α-catenin forms dimers and regulates actin dynamics independently of cell-cell adhesion (Drees et al., 2005; Benjamin et al., 2010). It was also reported that the extracellular domains of cadherins form dimers (Shapiro et al., 1995; Nagar et al., 1996; Pertz et al., 1999). It is possible that the α-catenin domain in the Eα formed dimers and played the role of cytoplasmic α-catenin in addition to the role of cadherin-biniding α-catenin. Therefore, we were unable to definitively determine whether cytoplasmic α-catenin was involved in actin-bundle formation at cell-cell junctions. We, however, clearly demonstrated that cytoplasmic α-catenin was not required at least for Eα functions. Moreover, we confirmed that the C-terminal half of α-catenin was necessary and sufficient for strong cadherin-mediated cell adhesion and reorganization of the actin-based cytoskeleton and ZO-1 localization when it was linked to C-terminus of E-cadherin.
Close observations revealed that morphology of parental F9, Eα-BPE-3K and Eα-BPEA-4K cells was distinct from each other. Since both Eα-BPE-3K and Eα-BPEA-4K cells were a little flatter than parental F9 cells, this difference was probably depending on the functional difference between intact E-cadherin-catenin complex and Eα (Nagafuchi et al., 1994). On the other hand, Eα-BPEA-4K cells formed more compact colonies than Eα-BPE-3K did. Since expression levels of Eα were similar in these cells, it is possible that endogenous α-catenin affects the morphology of colonies (see below).
There are at least two types of cadherin-based junctions, those with ZO-1 and those without ZO-1. Junctions with ZO-1 are mainly observed in non-epithelial cells and junctions without ZO-1 are theoretically present in epithelial cells (Itoh et al., 1993). Both types of junctions occurred in F9 cells. We and others have reported that F9 cells could be used as an in vitro model of epithelial differentiation (Sherman and Miller, 1978; Chiba et al., 2003; Komiya et al., 2005). It is possible that even non-differentiated F9 cells have some epithelial characteristics and partially develop epithelial-type junctions without ZO-1. It is also possible that, even in nonepithelial cells, two types of junctions are formed depending on cellular context. The C-terminal half of α-catenin contains a ZO-1-binding domain (Imamura et al., 1999), and E-cadherin-α-catenin fusion with this domain supported junctions with ZO-1 (Nagafuchi et al., 1994); therefore, it is likely that the C-terminal half of α-catenin was involved in the formation of junctions with ZO-1. We have no information on the molecular architecture or physiological function of junctions that lack ZO-1, except that intact cadherin-catenin complex, but not E-cadherin-α-catenin fusions, is required for these junctions in F9 cells. Further analysis of junctions without ZO-1 might shed light on a previously unrecognized function of the cadherin-catenin cell adhesion complex.
The Eα fusion conferred full adhesive function to L and BPEA-4K cells, but not to BP-2K cells. BP-2K cells, unlike L and BPEA-4K cells, expressed endogenous E-cadherin; therefore, it is likely that endogenous E-cadherin perturbed Eα function in a dominant-negative fashion. We previously reported that intact E-cadherin molecules are unstable in the plasma membrane of BP-2K cells (Fukunaga et al., 2005). These findings suggested that, in Eα-BP-2K cells, which lacked β-catenin and plakoglobin, endogenous E-cadherin destabilized Eα in the plasma membrane through their cis-interactions. It was also possible that trans-interactions between endogenous E-cadherin and Eα destabilized Eα on neighboring cells. These hypotheses are consistent with the fact that only low level expression of endogenous E-cadherin was detected in Eα-BP-2K cells. In these cases, endogenous E-cadherin might interact with Eα. So far, several mechanisms of cadherin-cadherin interactions have been reported in vitro (Shapiro et al., 1995; Nagar et al., 1996; Pertz et al., 1999; Chappuis-Flament et al., 2001). We, however, do not know which of them are used in living cells. Because it is possible to introduce any type of cadherin mutant into KO F9 cells, we could investigate the molecular mechanisms of cadherin-cadherin interactions in cells using this system.
Recently, it was reported that not cadherin-associated but cytoplasmic α-catenin plays critical roles in junctional actin bundle formation (Drees et al., 2005). In this story, α-catenin dimer inhibits Arp2/3 branching function and supports actin bundle formation just under the mature cadherin-based junctions. It was also reported that cytoplasmic α-catenin regulate actin dynamics independently cadherin-mediated cell-cell adhesion (Benjamin et al., 2010). On the other hand, it was reported that cytoplasmic α-catenin is not required for circumferential actin bundling in endothelial cells (Noda et al., 2009). In these reports, remnant cytoplasmic α-catenin might be a cause of controversial results, since siRNA or sequestering of cytoplasmic α-catenin was used for reduction of cytoplasmic α-catenin. In KO F9 cells, intact α-catenin protein is completely ablated. Moreover it is possible to introduce any type of α-catenin mutant into BPEA-4K and Eα-BPEA-4K cells without affecting cell adhesion activity. Thus, the roles of cytoplasmic α-catenin could be examined using this system.
We successfully isolated BPEA-4K cells, which lacked all four main components of cadherin-catenin complex. Because we used a gene-knockout approach, it is unnecessary to consider the effects of residual endogenous protein, which are occasionally the cause of controversial results in knockdown system. Using BPEA-4K cells, it is theoretically possible to generate mutant cells that express any cadherin-catenin complex components or mutant versions of these components in any combination (Tominaga et al., 2008). There are many unrevealed questions concerning regulatory mechanism for cadherin-based cell adhesion, such as cadherin-cadherin interactions and cytoskeleton organization. Using this reconstitution system, we would be able to reveal a previously unrecognized regulatory mechanism for cell adhesion.
We thank Yoshitaka Fukunaga for sharing BP-2K cells without authorship, Tomoyo Koga for the PEn2IBP trap-cassette construct, Shigenobu Yonemura for critical reading of the manuscript, members of Furuse Laboratory for helpful discussion, Masatoshi Takeichi for the ECCD-2 monoclonal antibody, Osamu Chisaka for the mouse genomic library, Chiyoko Kobayashi and Satoshi Urayama for helpful discussions, and Chigusa Fujiwara-Tanaka, Erika Morikawa, and Tomoko Magarikaji for excellent technical assistance. A.N. also greatly appreciates the continuous encouragement from the late Shoichiro Tsukita.
The work at the Department of Cellular Interactions, the Institute of Molecular Embryology and Genetics, Kumamoto University and the Department of Biology, School of Medicine, Nara Medical University was supported, in part, by a grant to A.N. from the Core Research for Evolutional Science and Technology (CREST); Grants-in-Aid for Scientific Research and Cancer Research; a Grant-in-Aid for 21st Century Center of Excellence (COE) Research “Cell Fate Regulation Research and Education Unit” from the Ministry of Education, Culture, Sports, Science and Technology of Japan and the Advanced Education Program for Integrated Clinical, Basic and Social Medicine, Graduate School of Medical Sciences, Kumamoto University (Program for Enhancing Systematic Education in Graduate Schools, MEXT, Japan).
|