| To whom correspondence should be addressed: Takeharu Nagai, Research Institute for Electronic Science, Hokkaido University, N20W10, Kita-ku, Sapporo, Hokkaido 001-0020, Japan. Tel: +81–11–706–9438, Fax.: +81–11–706–9443 E-mail: tnagai@es.hokudai.ac.jp Abbreviations: CSU, confocal scanner unit; DMEM, Dulbecco’s Modified Eagle Medium; S/N, signal-to-noise; LED, light emitting diode; LUT, look-up table; NA, numerical aperture; EM-CCD, electron-multiplying charge-coupled device; ER; endoplasmic reticulum; YC3.60, yellow cameleon 3.60; ECFP, enhanced cyan fluorescent proteins; IMD, intensity modified display; FC, fixed connection; OGB, Oregon Green 488 BAPTA-1 AM; 3D, three-dimensional; FWHM, full width at half-maximum. |
Yokogawa CSU (Ichihara et al., 1996) is a high-speed confocal system that can achieve acquisition rates as high as 2,000 Hz, and can minimize photo-induced damage to live samples by reducing the excitation light power of each scanning point to as low as ~1/1000 of that for a single-point scanning system (Inoué and Inoué, 2002). However, use of a laser as the excitation light source is required by the CSU and limits the choice of excitation wavelengths. Previously, we developed a multiple-point scanning confocal microscopy system comprising the Yokogawa CSU10 and a 100 W mercury arc lamp as a light source (Saito et al., 2008). The excitation wavelength was selected by alternating the interference filters, similarly to a conventional wide-field epifluorescence microscope. With that system, we showed that both high-speed (up to 100 Hz) and multicolor (four-color) confocal imaging were possible when observing multiple dynamic biological events simultaneously (Saito et al., 2008). Despite this successful application of the system, there remains the problem that the power of excitation light from the incoherent source is much lower than that of laser illumination, preventing high-speed imaging from being performed with a high S/N ratio. A simple solution to this problem is to use a brighter light source, such as a high-power LED. However, this approach does not solve the inherent issue of the off-axis incident light from an incoherent source being unable to pass through the pinhole array. In this manuscript, we describe an innovative system that uses not only the on-axis but also the off-axis incident light in the Yokogawa CSU. As a result, we demonstrate ultra high-speed confocal imaging at a time resolution of 300 Hz and five-color time-lapse imaging, both with a satisfactory S/N ratio unachievable with the previous system.
A confocal fluorescence microscopy system was created by combining an inverted microscope (Ti-E; Nikon, Tokyo, Japan) and a Nipkow disk CSU (CSU10; Yokogawa Electric, Tokyo, Japan). An LED-based light source (Spectra 7 Light Engine; Lumencor, Portland, OR, USA), a 100 W mercury arc lamp and a 488 nm laser (Sapphire 488 LP; Coherent, Santa Clara, CA, USA) were used as light sources. A multimode optical fiber (APCH1000; Thorlabs, Newton, NJ, USA) with 0.39 NA, a 1.0 mm core diameter and a 2 m cable length was used to couple the LED-based light source with CSU10. A further multimode optical fiber with 0.20 NA, a 1.0 mm in core diameter and a 2 m cable length (ST1000H; Mitsubishi Electric Cable, Tokyo, Japan) was used to couple the 100 W mercury arc lamp with CSU10. A filter exchange unit (MAC 5000 system: Ludl, Hawthorne, NY, USA) was employed for switching the emission filters and for shuttering the excitation light. Images were taken with an EM-CCD camera (ImagEM C9100-13; Hamamatsu Photonics, Hamamatsu, Japan). The shutter, filter wheels and camera devices were controlled by the MetaMorph software (Version 7.74; Molecular Device, Downingtown, PA, USA).
Fluorescent beads (TetraSpeck; Life Technologies, Gaithersburg, MD, USA) with a diameter of 0.2 μm were used to evaluate the spatial resolution of the confocal system when equipped with the different light sources and different optical collimators. Excitation light was produced with the LED-based light source by using a 475/28 nm (central transmission wavelength/band widths at half-maximum transmittance) excitation filter (FF01-475/28-25; Semrock, Rochester, NY, USA), and with the 100 W mercury arc lamp by using a 470/40 nm excitation filter (FF01-470/40-25; Semrock). Ten images of the fluorescent beads were taken and averaged in order to compare the images with the different excitation light sources, where Plan Apo (magnification: 100×, NA: 1.40) and Plan Fluor (40×, 1.30) oil-immersion objective lenses (Nikon) were used to acquire the images. The power of the excitation lights was measured at the focus planes of the two above lenses, in addition to a Plan Apo (60×, 1.40) oil-immersion objective lens, with an optical power meter (Model 3664; Hioki, Nagano, Japan). Experiments were repeated three times, and the averaged data were then used for further analysis.
HeLa cells were cultured in a 35 mm glass-bottom dish containing DMEM (Sigma, St. Louis, MO, USA) and 10% fetal bovine serum (BioWest, Nuaillé, France). One to two days before observation, HeLa cells were transfected with plasmids with the aid of a transfection reagent, Lipofectamin 2000 (Life Technologies). Immediately before observation, the transfected cells were treated with Hoechst33342 (final concentration: 5 μM; Life Technologies) and MitoTracker Green (final concentration: 60 nM; Life Technologies) in order to stain the nuclei and mitochondria, respectively.
ER-specific marker, msECFP-er, was formulated by extending the N- and C-termini of msECFP (Matsuda et al., 2008) with the signal peptide sequence of calreticulin and the ER retention signal sequence KDEL, respectively. Furthermore, nucleolar marker, mKOκ-fib, was formulated by fusing fibrillarin to the N-terminus of mKOκ (Tsutsui et al., 2008). Peroxisome marker, mCherry-per, was prepared by connecting the localization signal sequence, SKL, to the C-terminus of mCherry (Shaner et al., 2004). msECFP-er, mKOκ-fib and mCherry-per were cloned into pcDNA3 vector (Life Technologies).
HeLa cells that transiently expressed YC3.60 (Nagai et al., 2004) were prepared for high-speed intracellular Ca2+ imaging. A Plan Apo (60×, 1.20) water-immersion objective lens (Nikon) was used to acquire images with an LED-based light source having an excitation wavelength of 438/24 nm. For simultaneous acquisition of ECFP and Venus images from YC3.60, we employed an image splitting system (W-View system; Hamamatsu Photonics) composed of 510 nm shortpass and 510 nm longpass dichroic beam splitters and 479/40 nm (ECFP channel) and 536/40 nm (Venus channel) bandpass filters (FF01-479/40-25 and FF01-536/40-25; Semrock). Image analyses were performed by using Aquacosmos software (Version 2.6.4.3; Hamamatsu Photonics). From the series of captured fluorescent images, relative changes of intracellular Ca2+ were calculated from the ratio between the fluorescence intensity obtained through the Venus channel and that obtained through the ECFP channel (Venus/ECFP ratio). These intensities were presented as a set of pseudo-color images in IMD mode.
HeLa cells were incubated in DMEM containing 5 μM OGB (Life Technologies) for 1 h at room temperature, washed twice with phosphate buffered saline, and transferred to DMEM before the observations. To perform 300 Hz ultra high-speed imaging, excitation light was generated from the LED-based light source by using a 475/28 nm excitation filter (FF01-475/28-25; Semrock). A Plan Fluor (40×, 1.30) oil-immersion objective lens (Nikon), and 8×8 binning and subarray settings for the EM-CCD camera, were then used to acquire the images. From the resulting fluorescent images, relative changes of intracellular Ca2+ were calculated from the ratio between the measured cell fluorescence intensities (F) and their initial values (F0). The time course of obtained F/F0 ratios was obtained as a series of pseudo-color images.
A Plan Apo (100×, 1.40) oil-immersion objective lens was used to acquire images. For multicolor time-lapse imaging, we used a 90% reflective mirror (T10; Asahi-spectra Co., Japan). When this mirror is placed at 45 degrees to the optical axis, it reflects approximately 90% of light in the 400–700 nm and transmits the remaining 10%. Five emission signals were acquired sequentially by changing the excitation light and emission filters for five dif-ferent fluorophores. For the LED-based light source, we used the following combinations of excitation light and emission filters, respectively: 386/23 and 457/50 nm for Hoechst33342, 438/24 and 482/35 nm for msECFP, 475/28 and 520/35 nm for MitoTracker Green, 512/25 and 579/34 nm for mKOκ, and 575/25 and 624/40 nm for mCherry (FF01-386/23-25 and FF01-457/50-25, FF01-438/24-25 and FF01-482/35-25, FF01-475/28-25 and FF01-520/35-25, FF01-512/25-25 and FF01-579/34-25, and FF01-575/25-25 and FF01-624/40-25; Semrock).
Previously, we utilized a 100 W mercury arc lamp. To homogenize the anisotropic emission of the incident light, a multimode optical fiber with 0.20 NA, 1.0 mm core diameter and 2 m cable length was used to couple the lamp with the spinning-disk CSU10 (Saito et al., 2008). Here, the power of the excitation light was increased by employing a high-power LED-based light source (Fig. 1A), and light was output from the fiber output into CSU10 via an FC connector. We first evaluated the power of the light at the specimen from the LED-based light source by using the 100 W mercury arc lamp as a control light source (Fig. 2A). With the use of objective lenses having magnifications of 40×, 60× and 100×, the power from the LED-based light source were 2.6- to 2.7-fold greater than that of the 100 W mercury arc lamp. Hence, we concluded that the LED-based light source is a better than the 100 W mercury arc lamp for performing microscopy with the CSU10.
 View Details | Fig. 1. Nipkow disk confocal unit with external illumination system. (A) Schematic of the confocal system with the developed optical collimator and Nipkow spinning disk. ML: 100 W mercury arc lamp; LE: LED-based light source (Light Engine); MMF: multimode optical fiber; CLpre: pre-installed collimator lens; CLex: developed external collimator lenses; M1 and M2: mirrors in CSU10; BS: beam splitter; MLD: microlens array disk; PHD: pinhole array disk; OBJ: objective lens; CS: cover slip and sample; FW: filter wheel for emission. (B) Photograph of Nipkow disk confocal unit with the developed collimating system and EM-CCD camera. (C and D) Schematic of light rays passing through MLD to CS. Here, the pinhole spacing length between the nearest pair, d2=0.25 mm, and the length between MLD and PHD, d1=10 mm. The on-axis illumination indicated in blue and green are emitted from the center of MMF output, run parallel to the optical axis, pass through the microlens and are focused onto the pinhole coaxially aligned to the microlens. The off-axis illumination indicated in red is emitted from the periphery of MMF output and moves away from the optical axis. In our previous collimating system, off-axis illumination with an inclination angle of less than 0.025 rad to the optical axis was blocked by the pinhole disk and was not transmitted to the specimen plane (C). In the current system, off-axis illumination with an inclination angle of 0.025 rad to the optical axis passes through the pinhole disk and is transmitted to the specimen plane (D). |
 View Details | Fig. 2. Power of excitation light in specimen plane provided by different collimating systems and incoherent light sources. Power of excitation light measured in specimen plane for LE or ML (A). Light is supplied by pre-installed collimator lens of CSU10 (CLpre). Power of excitation light measured in specimen plane for (B) LE or (C) ML. Light is supplied by CSU10 equipped with different collimating systems: CLpre in CSU10, or developed optical collimators employing 4×, 10×, or 20× CLex. |
To further increase the power of the excitation light, we attempted to harness off-axis incident light that is not able to pass through the pinhole array in CSU10. Light from the LED-based light source, output through the optic fiber, was passed through one of our developed external optical collimators. Each collimator was attached in a position close to the microlens array disk (approximately 150 mm from the scanning disk, Fig. 1A) such that the excitation light bypassed the pre-installed collimator lens of CSU10. We measured the power of the excitation when using of three types of external collimator lenses (Table I): Plan Apo (4×, 0.20), Plan Apo (10×, 0.45) and Plan Fluor (20×, 0.5); and objective lenses having three different magnifications: 40×, 60× and 100× (Fig. 2B). For all objective lenses, the 10×, 0.45 collimator lens produced the highest power of excitation light. From Table I, the divergence of the collimated beam for the 10× lens was 0.025 rad. The sample was uniformly illuminated by adopting a spiral pattern with equal pitch for the microlens and pinholes of CSU10 (Tanaami et al., 2002). Based on the distance between the microlens array disk and pinhole array disk (10 mm; d1 in Fig. 1C) and on the spacing between the nearest pinholes along the spiral and radial paths (0.25 mm; d2 in Fig. 1C), the inclination angle that allows light to be transmitted through the nearest adjacent pinhole on the same line of the spiral pattern of the Nipkow disk installed in the CSU10 is calculated to be 0.025 rad (red light ray in Fig. 1D). We thus coupled on-axis straight and off-axis aslant light rays that focused through the same pinhole onto an illumination point on the cover slip, as shown in Fig. 1D. Therefore, this collimated light ray having a 0.025 rad angle to the optical axis can enhance the power of the excitation light at the specimen. This finding is consistent with the image size of the fiber output at the pinhole array disk. Since the ratio between the focal lengths of the 10× collimator lens (20 mm) and the microlens (10 mm) is equal to 2, by using a multimode optical fiber with 1.0 mm core diameter, an image by a single microlens is halved in size on the pinhole array disk (0.5 mm diameter), which covers the nearest pinholes. Similar to estimation of the optimal inclination angle for the pinhole adjacent to that located on the optical axis, the inclination angle required for light to transmit through the next closest pinhole is calculated as 0.05 rad. This angle corresponds to the output beam divergence for the 20× collimator lens (Table I). Thus, the 20× collimator lens also achieved a high light power in the specimen plane when using each objective lens, because its light inclination angle enables transmission through the two pinholes closest to the spiral and radial paths of the disk pattern. In contrast, the 4× collimator lens provided excitation light in the specimen plane with power equivalent to that obtained by using the pre-installed collimator lens in CSU10, and the divergence of the collimated beam is less than 0.025 rad in both cases. As a result, aslant light is blocked by the non-aperture area of the pinhole disk and light from only the center of the multimode optical fiber output is available as excitation light. For the 10× or 20× collimator lens, aslant light can transmit through the first or the second adjacent pinhole to that located on the optical axis, enabling the external collimating system to efficiently utilize light from the peripheral output of the multimode optical fiber. We concluded that the LED-based light source and the developed external optical collimator incorporating a 10× collimator lens maximize the employment of incoherent light in CSU10. Note that the 10× collimator lens increased the power of the excitation light by 3.6, 2.4 and 1.8 fold when using the 40×, 60× and 100× objective lenses, respectively (Fig. 2B). These increases are considered to be a consequence of the different maximum focusing angles necessary to satisfy the sine condition: 0.0325, 0.023 and 0.014 for the 40×, 1.30; 60×, 1.40; and 100×, 1.40 objective lenses, respectively. The emergence angle of the aslant incident light passing through the adjacent pinhole is 0.025 rad. Thus, the 40×, 1.30 objective lens can focus the aslant light effectively, leading to the highest power of excitation light. The results may also be caused by the difference in the diameter of the back aperture for the objective lenses: 13, 9.3 and 5.6 mm for the 40×, 60× and 100× objective lenses, respectively. The beam diameter projected onto the microlens array is greater than either 7 or 10 mm, as determined by the dichroic mirror aperture size (Inoué and Inoué, 2002) and the divergence of the beam. Since the diameter of the microlens is approximately 0.25 mm and the focal length of the microlens and tube lens are 10 mm and 200 mm, respectively, the beam diameter that passes through a single microlens is enlarged by 20 times to 5 mm. Given that the incident beam diameter is 10 mm, the maximum beam diameter that can pass through the tube lens is 15 mm. Thus, only the 40× objective lens facilitates incident light to pass effectively. Because the light, which leaks through adjacent pinholes, has a higher angle than light that normally passes through the on-axis pinhole, an objective lens possessing a large back aperture diameter can collect a higher percentage of the aslant light.
We also tested the external collimator lenses with the 100 W mercury arc lamp (Fig. 2C). However, no significant improvement over the pre-installed collimator lens was found in the power, contrary to the case shown for the LED-based light source. This is because the effect of external collimator lens is affected by not only objective lens but also NA of multi-mode fibers. We used different multi-mode fibers for the light sources, which were selected so as to be effectively coupled with the each light source. The low divergence of the input beam (0.2 rad) from the multimode optical fiber for 100 W mercury arc lamp is unable to fill the NA of collimator lenses, 0.45 (10×) and 0.50 (20×), leading to a decreased contribution from off-axis light.
Next, we assessed the spatial resolution of our confocal microscopy system by comparing the 3D intensity profiles of images of fluorescent beads (φ0.2 μm) (Fig. 3). The images were acquired with a 100× objective lens (NA: 1.4), since this lens supplies the optimal spatial resolution in the optical axis for the pinhole size (50 μm) of the CSU (Toomre and Pawley, 2006). Means and standard deviations of FWHM of the bead images along the x, y and z axes were calculated as 0.31±0.006 μm, 0.31±0.005 μm and 0.63±0.009 μm, respectively (Fig. 3A-C). These values are close to those obtained by 488 nm laser illumination output to the FC connector of CSU10 via single-mode optic fiber: 0.28±0.001 μm (x), 0.29±0.001 μm (y) and 0.61±0.01 μm (z) (Fig. 3D-F). The lateral resolution of the images corresponded closely to the value expected from Abbe’s equation, which is a function of the emission wavelength and NA of the objective lens. Furthermore, the optical resolution, in both the focus plane and along the z-axis, of the LED-based light source passing through the developed optical collimators was almost equivalent to that of laser illumination passing through a pre-installed collimating system. We also measured FWHM of the bead images along the z-axis by using a 40× objective lens (1.3 NA) because this objective lens exhibited higher power of excitation light, owing to increased contribution from off-axis light, compared with the 100× objective lens (Fig. 2A). Because the size of the pinhole is fixed in the CSU10 system, axial resolution should decrease with a lower magnification objective lens. As expected, the FWHM along the z-axis in both systems was worse. However, the FWHM of the LED-based light source with the 10× external collimator lens (1.0±0.013 μm; Fig. 3G) was 1.6-fold smaller than that of the 488 nm laser with the pre-installed lens (1.6±0.033 μm; Fig. 3H). This result indicates that off-axis light contributes to increase the spatial resolution in optical axis.
 View Details | Fig. 3. 3D spatial resolution analysis of CSU10 with developed collimating system and LED-based light source. Fluorescence intensity profiles of images of 0.2 μm fluorescent beads. (A–F) Fluorescence intensity profiles of bead images (N=10) along x, y and z axes, obtained by a 100× objective (100× OBJ) and CSU10 with either (A–C) LE equipped with MMF light scrambler and 10× CLex or (D–F) a 488 nm laser with a single-mode fiber connected to CLpre. (G and H) Fluorescence intensity profiles of bead images (N=10) along the z-axis obtained by a 40× objective (40× OBJ) and CSU10 with (G) LE equipped with MMF light scrambler and 10× CLex or (H) a 488 nm laser with a single-mode fiber connected to CLpre. |
To examine the performance of the developed confocal microscopy system, we attempted to acquire images of the intracellular Ca2+ propagation of HeLa cells expressing the genetically encoded Ca2+ indicator protein, YC3.60, at a frame rate of 30 Hz. By using the proposed system, we could observe reciprocal changes of fluorescence intensity in the obtained Venus and ECFP channels (Fig. 4A, C, E, G and M). Such observations were not possible with the previous system, based on a 100 W mercury arc lamp and CSU10 pre-installed collimator lens, owing to its low excitation power (Fig. 4B, D, F, H and N). Furthermore, with the current system we clearly observed Ca2+ propagation from the periphery to the center of the cell upon histamine stimulation (Fig. 4I and K). The time course of the Venus/ECFP ratio showed a rapid increase in intracellular Ca2+ concentration (Fig. 4O). In contrast, the previous system could observe neither the spatial distribution of the histamine-evoked Ca2+ increase nor the subsequent Ca2+ propagation in the identical cell (Fig. 4J, L). The S/N ratio of the Venus/ECFP ratios from the previous system (~20, Fig. 4P) was about 1/10 of the value obtained from the new system (191, Fig. 4O).
 View Details | Fig. 4. High-speed (30 Hz) Ca2+ imaging of HeLa cell expressing YC3.60. (A–L) Image series of HeLa cell expressing YC3.60. (A and B: LUT1, C and D: LUT2) Venus channel in separate LUTs and (E and F: LUT3, G and H: LUT4) ECFP channel in separate LUTs, where scales bars represent 10 μm. (I and J) (Venus/ECFP) emission ratio and (K and L) pseudo-colored, IMD mode (M–P). Time course of (M and N) fluorescence intensities of Venus (red) and ECFP (green) channels and (O and P) Venus/ECFP ratio at regions of interest represented by white rectangles in (K and L). (A, C, E, G, I and K) Obtained by CSU10 with LE and 10× CLex. (B, D, F, H, J and L) Obtained by same CSU system with ML and CLpre. |
To further demonstrate our confocal system, we tried ultra high-speed Ca2+ imaging of OGB-loaded HeLa cells at 300 Hz (Fig. 5). Although the pattern of the Ca2+ dynamics was essentially the same as that found at 30 Hz by using YC3.60, at increased time resolution we could observe the dynamics with higher clarity (Fig. 5A) and with a satisfactory S/N ratio (33.3, Fig. 5B).
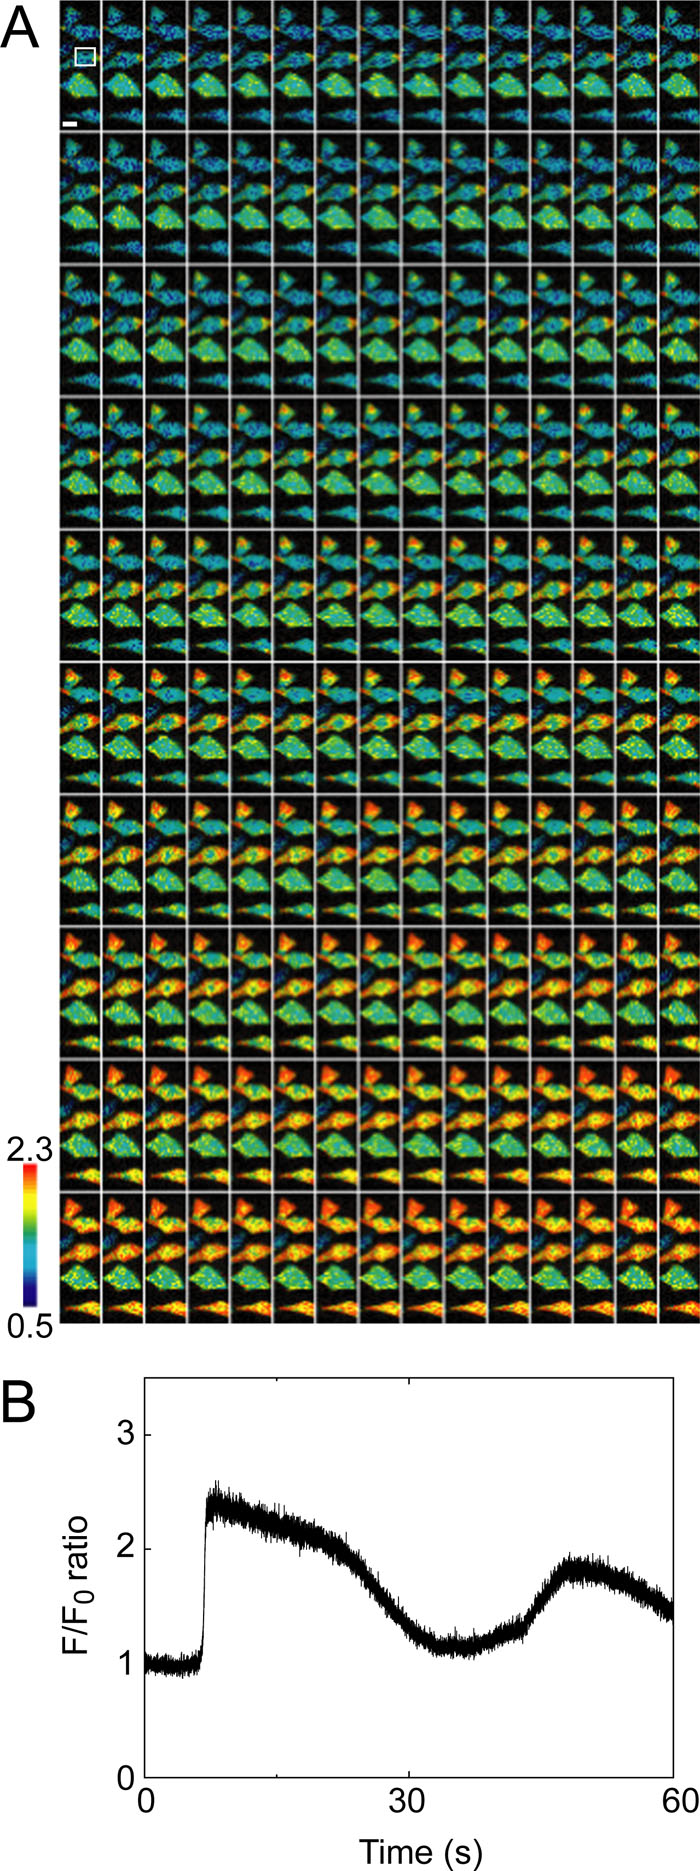 View Details | Fig. 5. Ultra high-speed (300 Hz) Ca2+ imaging of HeLa cells loaded with OGB. (A) Series of pseudo-colored, IMD mode images of HeLa cells loaded with OGB, where the scale bar represents 10 μm. (B) Time course of F/F0 ratio at the region of interest in (A). Data were obtained by CSU10 with LE and 10× CLex. |
The broad range of excitation wavelengths provided by the LED-based light source (386, 438, 457, 512, 542, 575 and 632 nm) enables the visualization of multiple fluorophores. However, such visualization typically requires the dichroic mirror to be exchanged, or a multiband interference mirror to be used, when conducting multiple-wavelength excitation and acquisition in epifluorescence imaging. In our previous study, we replaced the multiband interference mirror with a 50% reflective mirror in order to achieve multicolor imaging without exchanging the dichroic mirror (Saito et al., 2008). Although this 50% reflective mirror worked well when observing bright specimens, for dim ones, the 50% loss in fluorescence signal often exaggerated the image contrast. In the current system, the excitation power is high enough so that a mirror with high reflectivity can be used. As a result, to obtain more emission light, we swapped the 50% reflective mirror with a 90% reflective mirror (located at “BS” in Fig. 1A). Because the transmittance of this mirror is approximately 10% for wavelengths from 400 to 700 nm, around 90% of the total emission signal for wavelengths in this range is reflected toward the EM-CCD camera. An excitation light transmittance of 10% is considered adequate, since the illumination power is between 4.5- and 9.2-fold higher than that of the previous system (Fig. 2A and B). In performing multicolor imaging, we expressed genes for chimeric fluorescent proteins in HeLa cells in order to label three subcellular structures (see Materials and Methods): endoplasmic reticulum (msECFP-er), nucleolus (mKOκ-fib), and peroxisome (mCherry-per). Moreover, we added Hoechst33342 and MitoTracker Green to the transfected cells to stain the nuclei and mitochondria, respectively. The multilabeled HeLa cells were subjected to sequential confocal imaging in each fluorophore color by alternating the excitation light and emission filters. We succeeded in visualizing multiple cellular components in the living HeLa cells (Fig. 6). Moreover, we achieved five-color time-lapse and 3D imaging (see Supplementary movies 1 and 2) demonstrating the versatility of our developed confocal system.
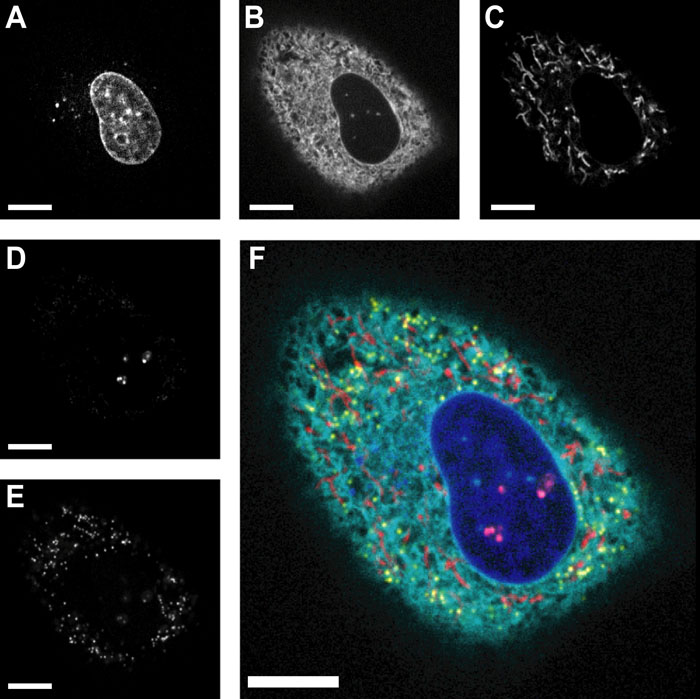 View Details | Fig. 6. Multicolor imaging by CSU10 with a 10% transmission/90% reflection mirror. Images of HeLa cells fluorescently labeled with (A) Hoechst33342, (B) msECFP-er, (C) MitoTracker Green, (D) mKOκ-fib and (E) mCherry-per. (F) Merged image consists of five channels pseudo-colored by blue (Hoechst33342), cyan (msECFP-er), red (MitoTracker Green), magenta (mKOκ-fib) and yellow (mCherry-per). Scale bars represent 10 μm. |
We have increased the availability of incoherent light to a Nipkow spinning-disk confocal system by coupling a high-power LED-based light source with a multimode optical fiber to the confocal system, and by using a developed external optical collimator. Although incoherent light sources have been used in the past as the light source for Nipkow spinning-disk confocal units (Watson et al., 2002; Saito et al., 2008), fluorescence signals were too dim to be used in high-speed imaging. Utilizing the off-axis incident light, which was blocked in conventional spinning-disk confocal systems, we achieved a substantial increase in the intensity of the excitation light without loss in spatial resolution. Thus, a practical system is provided for employing incoherent light as a light source for multicolor high-speed confocal microscopy.
We thank Mr. H. Hirukawa (Yokogawa Electric Corporation) for technical support and advice. We also thank the following companies: Nikon Imaging Center at Hokkaido University; Nikon, for providing the microscope; Life Technologies, for providing Hoechst33342; Tokai Hit, for providing the CO2 incubator system for the microscope; Hamamatsu Photonics, for providing the EM-CCD camera and Aquacosmos software; OPTO-LINE, for providing bandpass filters and the Light Engine; and Yokogawa Electric for providing CSU10. This work was partly supported by a Grant-in-Aid for Young Scientists (A) from the Japan Society for the Promotion of Science (no. 18687014), and by a Grant-in-Aid for Scientic Research on Advanced Medical Technology from the Ministry of Labor, Health and Welfare of Japan, both awarded to T.N.
|