| To whom correspondence should be addressed: Ayse Elif Erson-Bensan, Department of Biological Sciences, M.E.T.U., Inonu Bulvari, Ankara 06531, Turkey. Tel: +90 (312)210-5043, Fax: +90 (312)210-7976 E-mail: erson@metu.edu.tr |
miRNAs are conserved, non-coding RNAs that can regulate the stability and translation of target mRNAs generally through binding to their 3'-UTRs (untranslated regions) (Bartel, 2004), while a collection of intriguing findings showed existence of 5'-UTR, coding sequence and promoter binding miRNAs (Erson and Petty, 2008, 2009). It is also surprising to note that miRNA dependent gene regulation is not always inhibitory. For example, miR-369-3 can bind to the 3'-UTR of tumor necrosis factor-α (TNF-α) transcript to activate its translation under low serum conditions (Vasudevan et al., 2007). Another study showed positive regulation of global protein synthesis by miR-10a binding to the 5'-UTRs of ribosomal protein mRNAs to enhance their translation (Orom et al., 2008).
Despite many unknowns yet to be explored about miRNAs, it is well accepted that these ~22 nucleotide long, non-coding RNAs play key roles in diverse biological processes including development, differentiation, cell proliferation, and apoptosis. Therefore, their deregulation has been associated with various diseases, including cancer (Erson and Petty, 2008; Lu et al., 2005).
Investigation of individual miRNAs and identification of their direct and/or indirect effects in cancer cells are of vital importance to better understand their functions so as to explore potentials for developing diagnostic, prognostic and therapeutic tools. Among an expanding list of cancer related miRNAs, widespread deregulation of miR-125b has been documented in various types of cancers including breast, ovary, pancreas, squamous cell carcinoma of tongue, acute myeloid leukemia and oral cancers (Bloomston et al., 2007; Bousquet et al., 2008; Calin and Croce, 2006; Iorio et al., 2005, 2007; Park et al., 2009; Selcuklu et al., 2009; Wong et al., 2008).
In humans, miR-125 has two mature isoforms, miR-125a and miR-125b, encoded by three distinct genes: miR-125a, miR-125b-1 and miR-125b-2. miR-125a maps to 19q13.33 and codes for the mature form of miR-125a. miR-125b-1 and miR-125b-2 map to 11q24.1 and 21q21.1, respectively. miR-125b-1 and miR-125b-2 precursors are processed to form the same mature miRNA, miR-125b. According to miRBase, miR-125a and miR-125b have identical seed sequences but their mature sequences differ by 3 nucleotides (Griffiths-Jones et al., 2008).
Interestingly in breast cancer, miR-125b is one of the most consistently deregulated miRNAs. Microarray analysis of 10 normal and 76 primary breast tumors indicated decreased miR-125b expression (Iorio et al., 2005). Decreased expression of miR-125b was further detected in 13 ERBB2 (v-erb-b2 erythroblastic leukemia viral oncogene homolog 2) positive compared to 7 ERBB2 negative breast tumors (Mattie et al., 2006). Consistent with a potential tumor suppressor gene function, miR-125b was also shown to target the proto-oncogene BCL3 (B-cell CLL/lymphoma 3) in ovarian cancer (Guan et al., 2011; Zhang et al., 2011) and E2F3 (E2F transcription factor 3), a major cell cycle regulator, in bladder cancer (Huang et al., 2011) and ETS1, a member of ETS transcription factor family, in breast cancer (Zhang et al., 2011). Another confirmed target of miR-125 family is MUC I (Mucin I) oncogene in breast cancer (Rajabi et al., 2010). In addition, a short hairpin DNA analogous to miR-125b was used to target C-Raf expression and this negatively affected the proliferation and survival of breast cancer cells (Hofmann et al., 2009). miR-125b was also reported to have negative effects on cellular proliferation of breast cancer cells in an ERBB2 dependent manner (Scott et al., 2007). When an ERBB2 overexpressing cell line, SKBR3, was transfected with miR-125a and miR-125b, ERBB2 protein levels decreased approximately 35% and cells had decreased migration and invasion behavior (Scott et al., 2007). On the contrary, only marginal changes were observed for migration and invasion phenotype of non-tumorigenic immortalized MCF10A cells (Scott et al., 2007). Earlier, our group used an alternative method to investigate macromolecular changes due to miR-125b expression by ATIR-FTIR (Attenuated Total Reflectance Fourier Transform Infrared) spectroscopy and reported significant alterations in proliferation, lipid metabolism, membrane fluidity and lipid order in miR-125b expressing cells (Ozek et al., 2010).
In this study, we aimed to investigate cellular consequences of miR-125b expression in a breast cancer model system by restoring miR-125b expression in MCF7 cells that have low/no detectable levels of miR-125b. Here, we show evidence for considerable structural and functional changes due to miR-125b expression restoration in MCF7 cells, in an ERBB2 independent manner, and report ARID3B as a novel target of miR-125b.
MCF10A, BT474, CAL51, cell lines were obtained from ATCC (LGC Standards GmbH, Germany). EFM-19, JIMT-1, HCC1937, HCC1143, HDQ-P1, CAL85-1 cell lines were obtained from DSMZ (Braunschweig, Germany). MDA-MB-231, MCF7 and T47D cell lines were a kind gift from Dr. U.H. Tazebay (Bilkent University, Ankara). BT20, CAMA1, MDA-MB-157, MDA-MB-361, MDA-MB-453, MDA-MB-468, SKBR3, ZR-75-1 cells were a kind gift from Dr. I. Yulug (Bilkent University, Ankara). MCF10A cells were grown in DMEM/F12 medium with 5% horse serum, 100 mg/mL Epidermal Growth Factor (EGF), 1 mg/mL hydrocortisone, 1 mg/mL cholera toxin, and 10 mg/mL insulin, BT474 cells were grown in RPMI 1640 with 20% Fetal Bovine Serum (FBS), 10 μg/mL insulin and 2 mM L-Glutamine, CAL51 cells were grown in DMEM with 20% FBS and 4.5 g/L glucose, CAL85-1 cells were grown in DMEM with 10% FBS, 2 mM L-Glutamine and 1 mM sodium pyruvate, EFM-19, HCC1937 and ZR-75-1 cells were grown in RPMI 1640 with 10% FBS, HCC1143 cells were grown in RPMI 1640 with 20% FBS, HDQ-P1, JIMT1, MDA-MB-231, BT-20, CAMA1, MDA-MB-157, MDA-MB-361, MDA-MB-453 and MDA-MB-468 cells were grown in DMEM with 10% FBS, MCF7 cells were grown in MEM with Earle’s salts and 10% FBS, T47D cells were grown in DMEM, with 10% FBS and 0.1% non-essential amino acids, SKBR3 cells were grown in McCoy’s medium with 10% FBS. All media contained 1% Penicillin/Streptomycin. All cell lines were grown as monolayers and were incubated at 37°C with 95% humidified air and 5% CO2.
66 bp of miR-125b precursor was cloned into pSR-GFP/Neo (pSUPER) (Oligoengine, USA) after annealing of the following oligos: Sense: 5'/Phos/GATCCCCCAGTCCCTGAGACCCTAACTTGTGATGTTTACCGTTTAAATCCACGGGTTAGGCTCTTGGGAGCTGTTTTTA-3'. Anti-sense: 5'/Phos/AGCTTAAAAACAGCTCCCAAGAGCCTAACCCGTGGATTTAAACGGTAAACATCACAAGTTAGGGTCTCAGGGACTGGGG-3' (IDT, USA). Constructs were sequenced and stably transfected into MCF7 cells by FuGENE HD (3:2, Fugene:DNA ratio) (Roche, Germany) according to manufacturer’s instructions. Stable cell lines were selected with 500 μg/mL of G418 (Roche, Germany). Polyclonal cells were expanded under continuous selection with 250 μg/mL G418. For transient silencing of ARID3B via shRNA, short hairpin RNA (shRNA) oligos (IDT) corresponding to the ARID3B mRNA (NM_006465.2) nucleotide positions 1142-1162 (Kobayashi et al., 2006) were annealed and cloned into pSR-GFP/Neo (pSUPER). (sense: 5'-GATCCCCAGCTCCAGGCAGCAATTGATGTTCAAGAGACATCAATTGCTGCCTGGAGCTTTTTTA-3' and antisense: 5'-AGCTTAAAAAAGCTCCAGGCAGCAATTGATGTCTCTTGAACATCAATTGCTGCCTGGAGCTGGG-3'. Control oligos (sense: 5'-GATCCCCGTACGTTACGCGTAACGTATTCAAGAGATACGTTACGCGTAACGTACTTTTTA-3' and antisense: 5'-AGCTTAAAAAGTACGTTACGCGTAACGTATCTCTTGAATACGTTACGCGTAACGTACGGG-3') had no homology to human genome as was described previously (Akhavantabasi et al., 2010). Sequence confirmed constructs were transiently transfected to MCF7 cells by Fugene-HD (Roche) (3:2, Fugene: DNA ratio).
For anti-miR oligo transfections, 2'-O-methyl oligos were used to inhibit miR-125a (5'-UCACAGGUUAAAGGGUCUCAGGGA-3', IDT) and miR-125b (5'-UCACAAGUUAGGGUCUCAGGGA-3', IDT). As a negative control, non-specific 2'-O-methyl oligonucleotide (5'-AAGCGAAGCAGUGCGUCAAGUA-3', IDT) was used. Fugene-HD (Roche) was used (6:2 Fugene: oligo ratio) for transfections. Oligo final concentrations were 1.5 μg/mL.
Total cellular RNA was isolated using High Pure RNA isolation kit (Roche, Germany) according to manufacturer’s guidelines. Quantitiy and purity of RNA was determined using Nanodrop. First-strand cDNA synthesis was carried out from 1 μg of DNase treated RNA with random hexamers using RevertAid First Strand cDNA Synthesis Kit (Fermentas, Germany). Semi-quantitative duplex RT-PCR, as described previously (Erson et al., 2001), was performed using pre-miR-125b-1 F: 5'-TGCGCTCCTCTCAGTCCCTGAG-3' R: 5'-AGCACGACTCGCAGCTCCCAAG-3'), and GAPDH F: 5'-TATGACAACGAATTTGGCTAC-3' R: 5'-TCTCTCTTCCTCTTGTGCTCT-3'. A second set of miR-125b-1 primers were used to confirm expression of the cloned precursor (66 bp, miR-125b-1), F: 5'-CAGTCCCTGAGACCCTAA-3', R: 5'-CAGCTCCCAAGAGCCTAA-3'. PCR products were run on ethidium bromide stained 3% agarose gels, visualized and documented under UV. For mature miRNA quantification, cDNA was synthesized using 100 ng total RNA (isolated with Trizol) with specific stem-loop universal primers and Taqman microRNA reverse transcription kit (Applied Biosystems). Taqman microRNA assay kit (Applied Biosystems) was used for qRT-PCR according to the manufacturer’s instructions on Corbett Rotor-Gene 6000 (Qiagen, Corbett, Germany). PCR conditions were 40 cycles at 95°C for 15 s and 60°C for 60 s. RNAU6B was used as an internal control. To calculate expression level of mature miRNAs, ΔΔCt method was used (Livak K.J. and Schmittgen, 2001). Experiments were run in triplicates. For statistical significance, T test (nonparametric) analysis was performed using GraphPad prism software.
3×10⁵ stably transfected MCF7 cells were seeded and grown on 25×25 mm cover slips in 6-well tissue culture plates. Next day, cells were washed in PBS (Phosphate Buffered Saline) and fixed in 3.7% formaldehyde solution in PBS for 5 minutes. Fixation was stopped by adding 0.1 M glycine in PBS for 5 minutes. Cells were permeabilized for 1 min in 0.1% Triton X-100 (Sigma). For filamentous actin staining, fixed and permeabilized cells were incubated with 40 μM phalloidin (Fluorescin Isothiocyanate, Sigma) staining solution in PBS for 40 minutes at room temperature. Nuclei were stained with 30 nM DAPI solution (Invitrogen), at room temperature for 5 minutes. After washing the cover slips several times in PBS, images were captured, using Zeiss LSM 510 with 40X oil objective (Central Lab, METU). Image quantification (area occupied by protrusions per cell outline in pixels) was done by S.CO LifeScience (Germany).
Actively proliferating cells were harvested with lysis buffer (150 mM NaCl , 50 mM Tris, 1% Triton X-100, 0.5% Sodium deoxcholate, 0.1% SDS), and lysates were cleared by centrifugation. Supernatants were collected and protein concentrations were determined using BCA protein assay (Pierce). Proteins (50 μg) were denatured in 6X Laemmli buffer (12% SDS, 30% 2-mercaptoethanol, 60% Glycerol, 0.012% bromophenol blue, 0.375 M Tris) at 100°C for 5 min, resolved by an 8% SDS-polyacyrlamide gel and were transferred to PVDF membranes (Roche). Membranes were blocked for 1 hour at room temperature in Tris Buffer Saline Tween (TBST), (20 mM Tris, 137 mM NaCl, pH: 7.6, 0.1% Tween 20) with 5% non-fat dry milk (Biorad) for ARID3B detection, 2.5% non-fat dry milk (Biorad) for ERBB2 detection, and 10% skim milk (Fluka) for pERK1/2 detection. The membranes were then respectively incubated for 16 h at 4°C with; rabbit polyclonal anti-ARID3B antibody (1:1500, Abcam) in 5% non-fat dry milk-0.1% TBST, mouse monoclonal anti-ERBB2 antibody (1:250, Leica) in 2.5% non-fat dry milk-0.1% TBST and rabbit polyclonal anti pERK 1/2 (1:250, Santa Cruz). All membranes were washed three times with 0.1% TBST, and incubated for 1 hour with peroxidase conjugated mouse anti-rabbit antibody (1:2000, Santa Cruz) in 5% non-fat dry milk-0.1% TBST, peroxidase conjugated goat anti-mouse antibody (1:2000, Santa Cruz), in 2.5% non-fat dry milk-0.1% TBST and peroxidase conjugated mouse anti-rabbit antibody (1:2000, Santa Cruz) in 10% non-fat dry milk-0.1% TBST, respectively. After washing three times with 0.1% TBST, antigen-antibody complexes were visualized with the enhanced chemiluminecence kit (Pierce) by exposure to X-ray films (Kodak). ARID3B antibody detected a 61 kDa band along with a band of unknown identity at around 50 kDa (not shown). The blots were then stripped and hybridized with monoclonal goat anti-mouse β-actin antibody (1:1000, Santa Cruz) in 5% BSA (Roche)-0.1% TBST, and with secondary anti-mouse antibody (1:2000, Santa Cruz) in 5% BSA-0.1% TBST. Antigen-antibody complexes were visualized as described above. β-Actin antibody detected a 43 kDa band. ImageJ program (http://rsb.info.nih.gov/ij/) was used for densitometric quantification of the bands.
Cells were seeded in 6-well plates and incubated until they were 90% confluent. The monolayer of cells was scratched with a sterile pipette tip (Cimen et al., 2009). Cell debris was removed by washing twice with Hank’s Salt solution. Cells were then grown in MEM-Earle’s complete medium. 0, 24, 48 and 72 h after wounding, images were captured using an inverted Olympus microscope (4X objective) and Moticam 2300 camera system. Distances traveled by the cells were measured by Motic ImagePlus 2.0 software. Experiment was performed twice with 4 replicates for each sample. Statistical analysis of data was done by one-way ANOVA, followed by Tukey’s multiple comparison test (p<0.001).
Transwell migration assay was performed as previously described (Cimen et al., 2009). MCF7-125 and MCF7-EV cells were cultured in MEM-Earle’s medium with 1% FBS. After 24 hours, 200,000 cells in 0.1 mL MEM-Earle’s medium with 1% FBS were plated on the upper wells of transwell migration chambers (Corning, USA). SKBR3 and MCF7 cells were pre-starved in McCoy’s 5A modified and MEM-Earle’s media with 1% FBS, respectively and after 24 hours, 200,000 cells in 0.1 mL medium containing 1% FBS and AG825 (50 μM, Tocris Bioscience) or DMSO were plated on the upper wells of transwell migration chambers. Medium containing 10% FBS was added to lower wells. Cells were allowed to migrate through an 8 μm pore membrane for 24 h. Cells on the upper surface of the membrane were removed by scrubbing with sterile cotton swabs. 100% methanol was used to fix cells on the lower surface of the membrane for 10 minutes. Fixed cells were stained with Giemsa for 2 minutes and membranes were washed twice with distilled water. Cells on the lower side of the membrane were documented and counted under a Leica light microscope (10X objective). For ARID3B silenced cells, MCF7 cells were harvested 8 h after transfection. 30,000 cells were plated on the transwell migration chamber and cells were allowed to migrate for 72 h. 3 random fields were counted per membrane. 4 membranes were used for each sample. Mann-Whitney test was used for statistical analysis of data (p<0.001).
ARID3B 3'-UTR fragments with putative miR-125b binding sites were cloned into pMIR reporter vector (Ambion, USA) using HindIII and SacI sites. HindIII and SacI sites were introduced (underlined bases) into the following cloning primer sets. For pMIR-C1 F: 5'-ATTTGGCCAGACATTGAGAGCTCGGA-3', R: 5'-CCCAAGCTTCACAGCCTCTTCCTTCAGACTA-3', for pMIR-C2 F: 5'-TATGTGTTGAGCTCACTTTTGTTTTTTTTT-3', R: 5'-CCCAAGCTTGGAGCTGTGGAGTTATT-3' and for pMIR-C3 F: 5'-ACACATACCCGAGCTCCCGAGGGCTG-3' R: 5'-CCCAAGCTTAGGGCAGTGAGGGTTCACTCCA-3' primer sequences were used. All clones were confirmed by sequencing before transfections. pMIR constructs (600 ng) were transiently co-transfected with Renilla luciferase phRL-TK plasmid (200 ng) (Promega, USA) into MCF7 cells by 2 μl of Lipofectamine 2000 (Invitrogen) (for each well of 24-well tissue culture plate) according to manufacturer’s guidelines. 48 h after transfection, cells were lysed in passive lysis buffer and dual luciferase activities were measured using Modulus Microplate Multimode Reader (Turner Biosystems, USA). Dual-Luciferase reporter assay system was used (Promega, USA). Statistical analysis of data was done by one-way ANOVA, followed by Tukey’s multiple comparison test (p<0.001).
Site directed mutagenesis was performed as previously described (Fisher and Pei, 1997). For the deletion of miR-125b seed sequences in the ARID3B 3'-UTR, following primers were used; F: 5'-CAGACAGCGTTGTCCAATTGTCCTGGA GAACTG-3' and R: 5'-CAGTTCTCCAGGACAATTGGACAACGCTGTCTG-3'. Constructs confirmed by sequencing were transiently transfected into MCF7-125b and MCF7-EV cells for dual luciferase assays as described above.
In the Cancer Genome Project database (http://www.sanger. ac.uk/genetics/CGP), miR-125b-1 locus is denoted as an LOH (Loss of Heterozygosity) region in 18 of 45 breast tumors. Consistent with DNA level losses, our screen for miR-125b-1 expression in breast cancer cell lines resulted with low or no expression of miR-125b-1 in 74% (14 of 19) of breast cancer cell lines compared to MCF10A, an immortalized non-tumorigenic mammary cell line whereas miR-125a expression was detected in almost every sample (Fig. 1A).
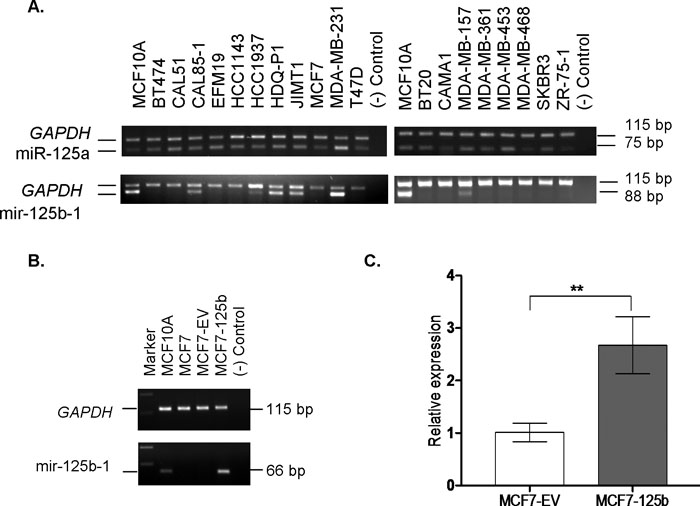 View Details | Fig. 1. (A) miR-125a and miR-125b-1 expression detection by end point semi-quantitative RT-PCR. miR-125a and miR-125b-1 precursors (product sizes, 75 and 88 bp) and GAPDH (product size 115 bp) transcripts were co-amplified in 19 breast cancer cell lines and MCF10A cells (non-tumorigenic, immortalized breast cell line). (B) Confirmation of miR-125b-1 transfections in MCF7 cells by RT-PCR. A 66 bp miR-125b-1 PCR product confirmed expression in transfected MCF7 cells (MCF7-125b). MCF10A cells were used as a positive control for miR-125b-1 expression. MCF7-EV cells were empty vector (pSUPER) transfected cells. (–) control sample contained no cDNA. GAPDH transcript was amplified in all samples, confirming the quality of cDNA samples. (C) Mature miR-125b expression in MCF7-EV and MCF7-125b cells was detected using Taqman miRNA Assay. RNAU6B was used as an endogenous control. ** indicates statistical significance (p<0.05). |
Earlier, miR-125b expression was found to have negative effects on cellular proliferation of breast cancer cells in an ERBB2 dependent manner (Scott et al., 2007). Due to its common deregulation in breast cancer, we aimed to investigate possible effects of miR-125b in a model system which represents ERBB2 negative breast cancers. Therefore, based on our RT-PCR results, MCF7 cells were selected among the low/no miR-125b-1 expressing cell lines, and were stably transfected with the miR-125b-1 precursor construct to restore mature miR-125b expression. miR-125b-2 precursor which may also give rise to mature miR-125b, was not detected in MCF7 cells by RT-PCR (Supplementary Figure).
Expression of the miR-125b-1 precursor in the stably transfected MCF7 cells comparable to MCF10A was detected and confirmed by RT-PCR (Fig. 1B). Empty vector (EV) transfected and untransfected MCF7 cells did not have any detectable miR-125b-1 precursor transcript. Mature miR-125b levels in the transfected cells were also confirmed with Taqman miRNA assay (Fig. 1C).
After the establishment of stable miR-125b expression, cytoskelatal morphology of the MCF7-125b cells was investigated with phalloidin to stain the filamentous actin (Fig. 2A). While the control cells (MCF7-EV) had actin based cytoplasmic protrusions around the periphery of cells, total area occupied by protrusions per cell outline (set to 100 pixels) in miR-125b expressing cells had a marked decrease (~70%) (Fig. 2B). Due to such actin cytoskeleton changes, a possible change in the motility of cells was questioned. Therefore, to look into the directional migration of cells without any chemoattractants, an in vitro wound closure assay was performed. MCF7-EV and MCF7-125b cells were grown to confluency and a wound was introduced with a sterile pipette tip. Distances traveled by the cells were measured until 72 h when MCF7-EV cells almost closed the gap. MCF7-125b cells had a significantly decreased wound closure rate compared to MCF7-EV cells (Fig. 3A). To further confirm if the migration of cells was affected from miR-125b expression, MCF7-125b and MCF7-EV cells were plated in low serum medium on the upper well of a transwell chamber and cells were observed for their ability to migrate through 8 μm pores of a membrane to reach to the high serum containing medium in the bottom wells. MCF7-125b cells had ~50% impaired migration rate compared to MCF7-EV cells in 24 h (Fig. 3B). The decreased migration rate of MCF-125b cells were partly restored when cells were transiently transfected with 2'-O-methyl oligos for anti-miR-125b compared to non-specific oligo and mock transfections (Fig. 3C).
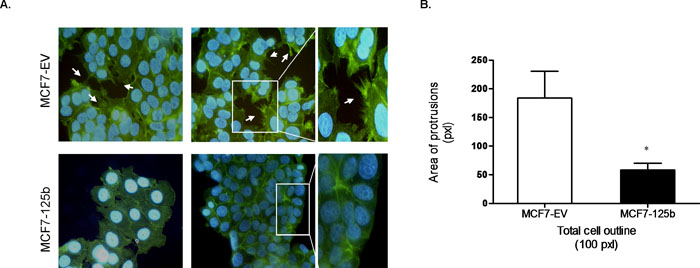 View Details | Fig. 2. (A) Phalloidin staining of the actin cytoskeleton (green) in MCF7-EV and MCF7-125b cells. Nuclei were stained with DAPI (blue). Numerous cytoplasmic protrusions are indicated with arrows. Images were taken using Zeiss LSM 510 with 40X oil objective. (B) Quantification of cytoplasmic protrusions. Total area occupied by protrusions per cell outline (set to 100 pixels) was detected (p<0.05). |
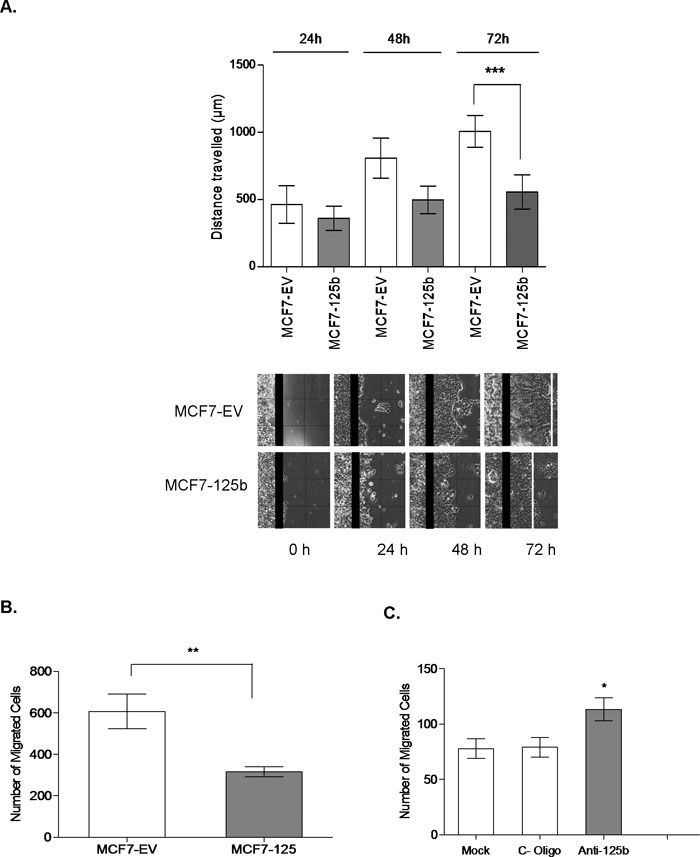 View Details | Fig. 3. (A) In vitro wound closure assay. Monolayer of confluent MCF7-EV and MCF7-125b cells was scratched with a sterile pipette tip. 0, 24, 48 and 72 h after wounding, images were captured using an inverted Olympus microscope (4X objective). Distances traveled by the cells were measured by Motic ImagePlus 2.0 software. Experiment was repeated twice with 4 replicates. *** indicates significant difference between the wound closing rates of MCF7-EV and MCF7-125b cells at 72 h, p<0.001. (B) Transwell migration assay. 200,000 pre-starved (in 1% FBS) MCF7-EV and MCF7-125b cells in 0.1 mL MEM-Earle’s medium with 1% FBS were plated on the upper wells of transwell migration chambers. Medium with 10% FBS was added to the lower wells. Cells were allowed to migrate for 24 h. Experiments were performed 3 independent times with at least 6 membranes. 3 random fields were counted per membrane. ** indicates statistical significance (p<0.05). (C) MCF7-125 cells were transfected with 1.5 μg/mL anti-miR-125b and non-specific control oligos (C-oligos), using Fugene HD (6:2) Fugene. Mock transfected cells only contained the transfection reagent. After 24 h, 200,000 cells were plated as described above. Cells were allowed to migrate for 24 h. Experiments were performed 3 independent times with 6 membranes. 3 random fields were counted per membrane. * indicates statistical significance (p<0.05). |
Earlier Scott et al. (2007) restored miR-125b expression in SKBR3 cells that overexpress ERBB2 and reported a decreased cell migration due to targeting of ERBB2 by miR-125b. Since MCF7 cells are not ERBB2 dependent, before searching for novel miR-125b targets that may have roles in cell motility and migration, we investigated the status of ERBB2 levels and activation in MCF7-125b cells. Western blotting for ERBB2 and for phosphorylated ERK1/2 (pERK1/2), downstream targets of ERBB2 activation pathways (Spencer et al., 2000) clearly demonstrated that MCF7 cells did not have ERBB2 overexpression and that there was no significant decrease in already low levels of ERBB2 in MCF7-125b cells. Furthermore, while pERK1/2 activation was detected in uninduced SKBR3 cells, no bands corresponding to pERK1/2 was seen in MCF7-EV and MCF7-125b cells (Fig. 4A). To further eliminate the possibility of any contribution of ERBB2 to MCF7 cell migration behavior, we treated MCF7 cells with a specific ERBB2 inhibitor, AG825 (Tsai et al., 1996). While in ERBB2 overexpressing SKBR3 cells, cell migration decreased ~65% due to AG825 treatment (Fig. 4B), no change in MCF7 cell migration was detected, indicating that low levels of ERBB2 in MCF7 cells did not contribute to cell migration.
 View Details | Fig. 4. (A) Western blot showing ERBB2 and pERK1/2 levels in SKBR3 (ERBB2 overexpressing positive control cell line), MCF7-EV and MCF7-125b cells. Blots were hybridized with anti-ERBB2, anti-pERK 1/2 and then with anti-β-actin antibodies to test equal loading. Image J program was used for the quantification of the bands. (B) AG825 effect on migration was determined by transwell migration assay. 200,000 pre-starved SKBR3 and MCF7 cells in 0.1 mL medium with 1% FBS and AG825 or DMSO (vehicle) were plated on the upper wells of migration chambers. Medium with 10% FBS was added to the lower wells. Cells were allowed to migrate for 24 h. 3 random fields were counted per membrane. 6 membrane replicates were used for each sample. * indicates statistical significance (p<0.05). “NS” indicates not significant. |
In search of miR-125b targets that may have roles in cell migration in an ERBB2 independent background, we used TargetScan (Friedman et al., 2009), PITA (Kertesz et al., 2007), PicTar (Krek et al., 2005), and “microRNAs.org” (Betel et al., 2008) prediction tools for possible mRNA targets. ARID3B (AT rich interactive domain 3B (BRIGHT-like)) was selected among the common predicted targets of miR-125b by all 4 programs. Moreover, ARID3B was already shown as a target of miR-125a in ovarian cancer cells (Cowden Dahl et al., 2009). Since both miR-125a and miR-125b share the same seed but different mature sequences according to miRBase (Griffiths-Jones et al., 2008), we were interested in investigating if miR-125b also targeted ARID3B in breast cancer cells. Indeed, ARID3B protein level was approximately 50% decreased in MCF7-125b cells compared to MCF7-EV and untransfected MCF7 cells detected by Western blotting (Fig. 5A). When MCF7-125b cells were transfected with anti-miR-125b oligos, ARID3B protein levels recovered (~30%). Silencing of miR-125b in MCF7-125b cells were confirmed by Taqman assay (Suppl. Fig. 2). Anti-miR-125a oligos were used as a positive transfection control for ARID3B targeting and ~20% recovery was detected in MCF7-125b cells. Given that miR-125b expression is lost in MCF7, not miR-125a, we focused on bioinformatic predictions for miR-125b and ARID3B. As shown in Fig. 5B, miR-125b was predicted to have 3 conserved binding sites within the 3'-UTR of ARID3B predicted by TargetScan and PITA. Only the seed binding sequence in the region indicated as C1 was commonly predicted by all above mentioned programs. Regions indicated as C1, C2 and C3 with putative miR-125b binding sites were cloned into the luciferase reporter vector pMIR. pMIR-C1, pMIR-C2, pMIR-C3 and empty pMIR were then co-transfected with phRL-TK (Renilla luciferase, for normalization purposes) into MCF7-EV and MCF7-125b cells. 48 h post transfection, dual luciferase expression levels were measured. pMIR-C1 transfected MCF7-125b cells showed ~60% decrease in luciferase activity whereas pMIR-C2 and pMIR-C3 transfected cells had similar luciferase read-outs comparable to empty pMIR transfected MCF7-125b cells (Fig. 6A). No significant luciferase expression change was detected for pMIR-C1, pMIR-C2 and pMIR-C3 transfections in MCF7-EV cells compared to pMIR. To confirm that the decrease in the luciferase activity was indeed due to the direct binding of miR-125b to ARID3B 3'-UTR, C1-MUT construct was generated. C1-MUT contained a 7 bp deletion in the 2102nd–2108th nucleotides of ARID3B 3'-UTR (Fig. 5C). The C1-MUT construct resulted with a ~30% recovery of the low luciferase activity of C1 construct compared to pMIR in MCF7-125b cells whereas no difference was detected in MCF7-EV cells (Fig. 6B).
 View Details | Fig. 5. (A) Western blot indicated approximately 50% decrease in ARID3B protein in MCF7-125b cells compared to MCF7-EV and untransfected MCF7 cells. MCF10A cells were used as a positive control for ARID3B expression. The second Western blot indicates approximately 20% and 30% ARID3B protein recovery in MCF7-125b cells transfected with anti-miR-125a and anti-miR-125b oligos (1.5 μg/mL), compared to mock transfected MCF7-125b cells. Both blots were stripped and re-hybridized with β-actin antibody to test equal loading. Image J program was used for the quantification of the bands. Fold increases are indicated on top of the bands. (B) Alignment of ARID3B 3'-UTR and the predicted conserved miR-125b binding sites (non-conserved sites are not shown). 3 conserved miR-125b binding sites were predicted (by TargetScan and PITA) between the 1885th and 4237th bases of the ARID3B mRNA. Each prediction region was cloned into pMIR and indicated as C1 (472 bp), C2 (422 bp) and C3 (301 bp). Top strands show the sequence of ARID3B 3'-UTR, below is the miR-125b sequence. (C) A 7 bp deletion was generated by site-directed mutagenesis in the miR-125b seed binding sequence of ARID3B 3'-UTR (C1 construct). Top strand shows the sequence of ARID3B 3'-UTR (C1-MUT), underlying strand is the miR-125b sequence. |
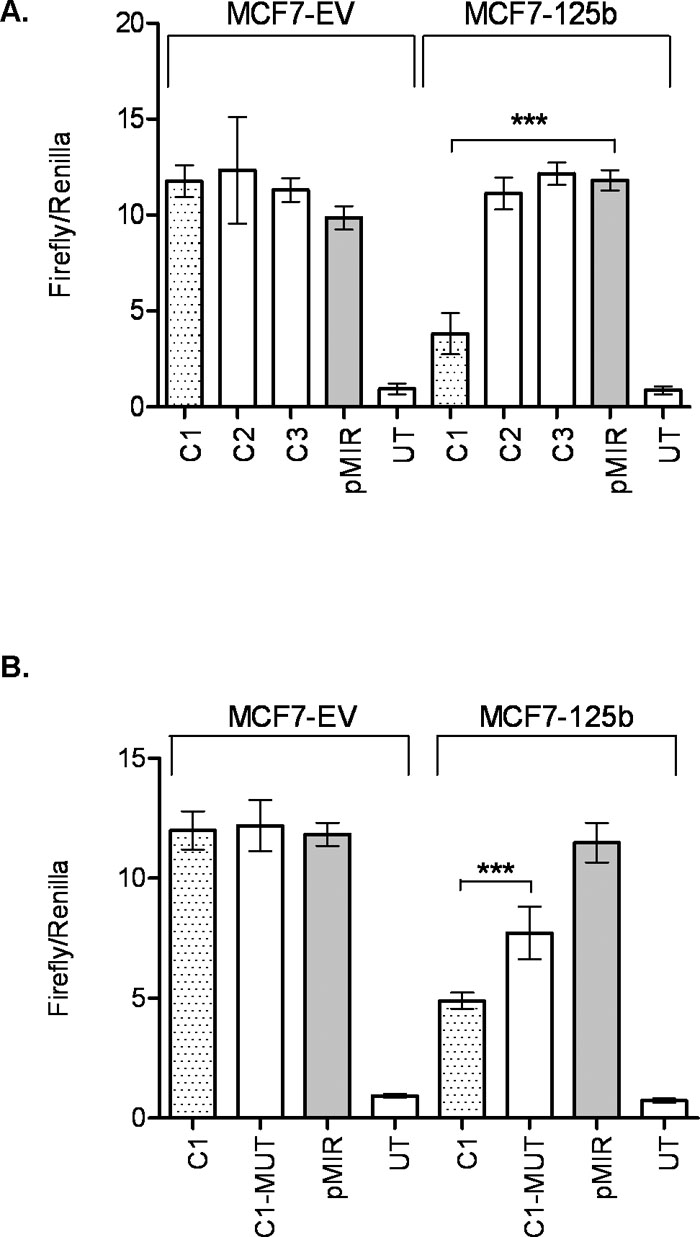 View Details | Fig. 6. miR-125b interacts with ARID3B 3'-UTR. (A) MCF7-EV and MCF7-125b cells were transfected with ARID3B 3'-UTR constructs (C1, C2 and C3) or empty pMIR. 48 h after transfection, luciferase activities were measured. “UT” stands for untransfected cells. Transfection efficiencies were normalized by Renilla luciferase. Data shown is a result of two independent experiments with a total of 8 replicates. *** indicates statistical significance (p<0.001). (B) miR-125b seed sequence binding site was deleted from C1 (C1-MUT). C1, C1-MUT and empty pMIR were transfected into MCF7-EV and MCF7-125b cells. “UT” stands for untransfected cells. Transfection efficiencies were normalized by Renilla luciferase. Data shown is a result of two independent experiments with a total of 7 replicates. *** indicates statistical significance (p<0.001). |
Next, to explore if the decreased migration and motility in MCF7-125b cells could be explained by ARID3B, we transiently silenced ARID3B expression in MCF7 cells. Due to approximately 40% silencing of ARID3B protein (Fig. 7A), a reduced migration rate (45%) was detected compared to control transfected cells by transwell migration assay (Fig. 7B). No significant decrease in cell proliferation was noted in ARID3B silenced cells compared to ARID3B expressing MCF7 (data not shown), indicating that miR-125b targeting of ARID3B was important for cell migration behavior changes.
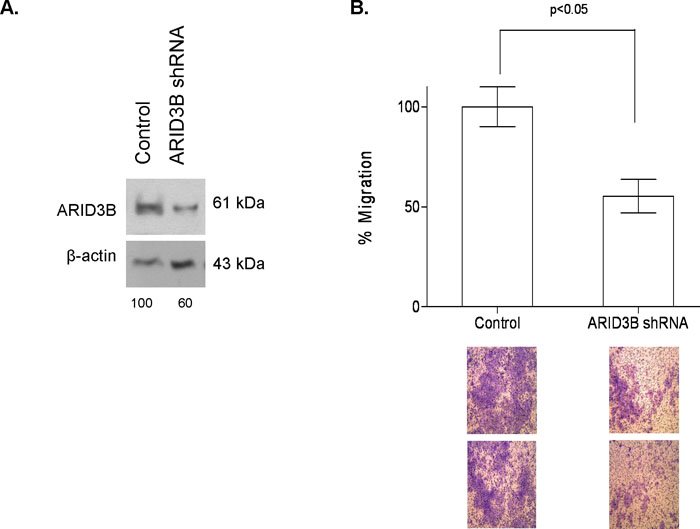 View Details | Fig. 7. (A) Transient ARID3B silencing in MCF7 cells detected by Western blot. Control or ARID3B shRNA constructs were transfected into MCF7 cells. Protein was isolated 72 h after transfection. The blots were first hybridized with anti-ARID3B antibody, then stripped and re-hybridized with β-actin antibody to test equal loading. Image J program was used for the quantification of the bands. (B) ARID3B silenced and control transfected cells were plated on the transwell migration chambers were allowed to migrate through 8 μm pores for 72 h. A total of 3 membranes were used for each sample. Migration rate of ARID3B silenced cells decreased by approximately 45% compared to MCF7-EV cells. Representative membrane images are given below the graph. Unpaired T-test was used with p<0.05. |
To further investigate miR-125b and ARID3B connection, we screened four ERBB2 independent breast cancer cell lines for a possible correlation between ARID3B levels and mature miR-125b (Fig. 8A, B). In the examined cell lines, ARID3B protein levels correlated not only with miR-125b mature levels but also, as would be expected, with miR-125a which is a known regulator of ARID3B in ovarian cancer cells (Cowden Dahl et al., 2009). Given that miR-125b loss is more common in breast cancers, when we transfected anti-miR-125b oligos into T47D cells with already high endogenous miR-125a levels, an approximately 40% increase in the ARID3B levels was observed, further confirming miR-125b and ARID3B connection (Fig. 8C). While targeting of ARID3B by more than one miRNA would be expected, miR-125b, a commonly lost miRNA in breast cancers, seems to be among important regulators of ARID3B in addition to miR-125a (Cowden Dahl et al., 2009).
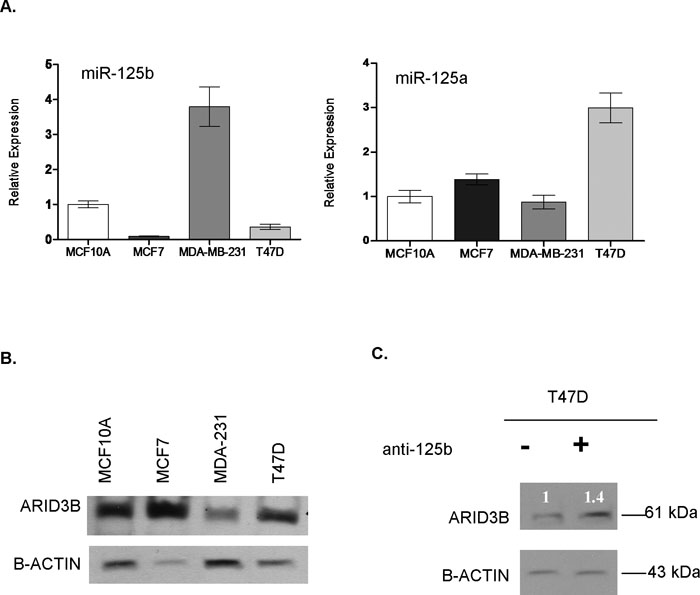 View Details | Fig. 8. (A) Mature levels of miR-125b and miR-125a in MCF10A, MCF7, MDA-MB-231 and T47D cells were detected by Taqman miRNA Assay. RNAU6B was used as an endogenous control. (B) Western blot showing ARID3B protein levels in MCF10A, MCF7, MDA-MB-231 and T47D cells. Blot was stripped and re-hybridized with β-actin antibody to test equal loading. (C) Western blot revealed an increase (1.4 fold) of ARID3B protein level in T47D cells transfected with miR-125b inhibitor (anti-miR-125b, 1.5 μg/mL), compared to mock transfected T47D cells. Total protein was isolated from transfected cells after 24 h. Blot was stripped and re-hybridized with β-actin antibody to test equal loading. |
Previously, miR-125b expression was found to be decreased in ERBB2 positive breast cancers (Mattie et al., 2006) and when miR-125b expression was restored in ERBB2 positive SKBR3 cells, a major decrease of invasiveness and anchorage dependent growth was observed, whereas this effect was not significant in MCF10A (immortalized, non-tumorigenic epithelial) cells (Scott et al., 2007). In this study, we investigated the effects of miR-125b expression in MCF7 cells as an in vitro model system for ERBB2 independent breast cancer subtypes. Stable restoration of miR-125b expression in MCF7 cells caused significant decrease in the number and area of the cytoplasmic protrusions around the cell periphery as well as decreased motility and migration rates compared to control cells. These findings on cell shape and motility changes are indeed in agreement with our previous data showing increased lipid order and hence decreased membrane fluidity in MCF7 cells due to miR-125b expression detected by FTIR and ESR (Electron Spin Resonance) spectroscopy techniques (Ozek et al., 2010). Membrane lipid composition and dynamics are implicated in diverse cellular functions such as transport, endocytosis, chemotherapeutic cytotoxicity, cell motility and growth (Sade et al., 2011; Spector and Yorek, 1985).
miR-125b expressing and control MCF7 cells were further investigated for ERBB2 involvement in cell motility. No ERBB2 overexpression and/or activation of pERK1/2 were detected in MCF7-125b and MCF-EV cells. These findings are in agreement with Spencer et al. (2000) where low levels of ERBB2 were silenced in MCF7, T47D and MDA-MB-435 cells (Spencer et al., 2000). No changes in the migratory or adhesion properties of uninduced and serum starved cells were reported in ERBB2 silenced cells, suggesting that basal levels of ERBB2, when uninduced, may not have a significant role in cell migration behavior in ERBB2 non-overexpressing cells. Then to investigate the motility decrease in miR-125b expressing, non ERBB2 overexpressing MCF7 cells, among numerous target predictions, we showed ARID3B as a valid target of miR-125b in MCF7 cells. Luciferase activity of pMIR-C1 in MCF7-125b cells was decreased compared to controls. When the predicted seed binding sequence was deleted from C1 construct (C1-MUT), luciferase activity was recovered ~30%. Presence of an additional putative non-conserved miR-125b binding site in C1 region may explain why only partial recovery of luciferase activity in C1-MUT transfected cells was observed.
Interestingly, no change in the ARID3B transcript levels was detected by RT-PCR in MCF7-125b and MCF7-EV cells (data not shown) indicating translational inhibition rather than mRNA degradation as a mechanism of miRNA dependent gene expression regulation.
ARID group of proteins are evolutionarily conserved transcription factors that have roles in the control of cell growth, differentiation, and development (Wilsker et al., 2002). ARID3B was first described as an RB (retinoblastoma) binding protein (Numata et al., 1999). Later, immortalization ability of ARID3B was shown for mouse embryonic fibroblasts and roles in embryonic mesenchymal transition were proposed (Kobayashi et al., 2006). Interestingly, a recent study investigated the role of ARID3B in chick and mouse limb bud development during embryogenesis and showed that ARID3B is involved in the regulation of cell motility and actin cytoskeleton organization (Casanova et al., 2011). While the specific roles for ARID3B remain to be investigated, downregulation of ARID3B in response to miR-125b expression and the correlating phenotype changes suggest that ARID3B may be an interesting regulator of cell motility in cancer cells. Earlier, as others we have also reported decreased proliferation in miR-125b expressing cells (Ozek et al., 2010), however, silencing of ARID3B did not seem to alter the proliferation rate of MCF7 cells (data not shown). It should be emphasized that miRNAs are predicted to target hundreds of mRNAs (Krek et al., 2005), in a tissue and context dependent manner, and while migration behavior was investigated in an ERBB2 negative background here, others have elegantly showed different targets of miR-125b that have roles in diverse cell phenotypes such as proliferation through targeting of ETS1 (v-ets erythroblastosis virus E26 oncogene homolog 1) oncogene (Zhang et al., 2011). Although in the same study, lack of migration was reported for MCF7 cells that were transiently transfected with pre-miR-125b-1, the stable restoration of expression and anti-miRNA transfection approaches allowed us to observe possibly longer term structural changes and hence alterations to directional motility and migration of miR-125b expressing cells. Moreover, we further confirmed altered migration behavior when ARID3B was specifically silenced via shRNA.
In summary, increasing number of evidence suggests miR-125b as a critical miRNA that targets well known (e.g: ERBB2 and ERBB3, (Scott et al., 2007)) oncogenes in breast cancer cells. Therefore, common loss of miR-125b expression may be of further interest for potential therapeutic applications in the future. Our findings point out involvement of miR-125b in ERBB2 independent pathways that regulate cell shape and motility characteristics which may have further implications in the complex events of tumorigenesis.
The authors would like to thank Dr. Cengiz Yakicier and Dr. Sreeparna Banerjee for helpful discussions throughout this work, Dr. Can Özen from Central Laboratory of METU for fluorescent microscopy, and Cansaran Saygili for technical help. This project was funded by Scientific and Technological Research Council of Turkey (TUBITAK-108S381). A. Sapmaz is funded by OYP (YYU, Van). S. Akhavantabasi is funded by TUBITAK Project 108S381.
|