| Yuji Kamioka and Kenta Sumiyama: These authors contributed equally to this work. To whom correspondence should be addressed: Michiyuki Matsuda, Laboratory of Bioimaging and Cell Signaling, Graduate School of Biostudies, Kyoto University, Kyoto 606-8501, Japan. Tel: +81–75–753–4421, Fax: +81–75–753–4655 E-mail: matsudam@lif.kyoto-u.ac.jp Abbreviations: FRET, Förster resonance energy transfer; CFP, cyan- fluorescent protein; YFP, yellow-fluorescent protein; TFP, teal fluorescent protein; dbcAMP, dibutyryl cyclic AMP; 2P, two photon excitation. |
Genetically-encoded biosensors based on the principle of Förster resonance energy transfer (FRET) have been widely used in biology to visualize the spatiotemporal dynamics of signaling molecules (Depry and Zhang, 2010; Hodgson et al., 2008; Jares-Erijman and Jovin, 2006; Kiyokawa et al., 2010). Through the efforts of many research groups, FRET biosensors have been created to visualize the changing concentrations of ions, sugars, and phospholipids, and to monitor the activities of GTPases, protein kinases and proteases. The number of available FRET biosensors to date now exceeds more than one hundred (Kiyokawa et al., 2010).
Despite the increasing multitudes of these biosensors, their application has been mostly limited to cultured cells that transiently express the FRET biosensor constructs, due to particular difficulties in the development of cell lines and transgenic mice with FRET biosensors (Hara et al., 2004). This difficulty may be caused by recombination between the cDNAs of donor and acceptor fluorophores, most of which are GFP variants such as cyan- (CFP) and yellow-fluorescent (YFP) proteins. In agreement with this speculation, we previously reported generation of cell lines expressing FRET biosensors by using coral-derived teal fluorescent protein (TFP) as the donor fluorophore (Kamioka et al., 2010; Yoshiki et al., 2010). However, the sensitivity of the TFP-based FRET biosensor is usually inferior to that of CFP-based biosensor. To overcome this problem, we recently reported a method to establish stable cell lines expressing FRET biosensors with a piggyBac transposon system (Komatsu et al., 2011).
Transgenic mice are currently generated by the microinjection of linearized DNA constructs into pronuclei of fertilized mouse oocytes. With this traditional technique, physical damage to the oocytes is common, resulting in less than a 10% survival rate among injected eggs. We previously reported that the general efficiency of transgenic mouse production could be markedly improved by the cytoplasmic co-injection of Tol2 transposase mRNA and a circular plasmid harboring Tol2 recombination sites (Sumiyama et al., 2010). These technical advances encouraged us to employ Tol2-mediated gene transfer to generate transgenic mice expressing FRET biosensors. Here, we report the efficient establishment of transgenic mouse lines with heritable and functional biosensors for protein kinases.
Arachidonic acid and U0126 were purchased from Sigma-Aldrich (Saint Louis, MO). PD184352, PD0325901, and dibutyryl cyclic AMP (dbcAMP) were purchased from Calbiochem (San Diego, CA). Qtracker 655 was purchased from Invitrogen (Carlsbad, CA). Isoflurane (Forane) was purchased from Abbott (Chicago, IL). Theophylline (Theodrip) was purchased from TEVA-KOWA Pharma (Tokyo, Japan). DbcAMP (Actosin) was purchased from Daiichi Sankyo (Tokyo, Japan). LY293111 was purchased from Cayman chemical (Ann Arbor, MI).
FRET biosensors for PKA and ERK were reported previously (Harvey et al., 2008; Komatsu et al., 2011; Zhang et al., 2001).The plasmid carrying Tol2 recombination sites, pT2AL200R175-CAGGS-EGFP, was reported previously (Urasaki et al., 2006). We replaced the EGFP cassette in pT2AL200R175-CAGGS-EGFP with each respective FRET biosensor (Fig. 1A). Fertilized eggs derived from Jcl:B6C3F1 (B57BL/6N Jcl X C3H/HeN Jcl) mice were microinjected with a mixture of Tol2 mRNA and the respective pT2A-derived FRET biosensor vectors (Sumiyama et al., 2010). Founder animals were bred with Jcl:ICR mice to produce stable lines. Newborn mice were illuminated with a blue flashlight LEDGFP-3W (Optocode, Tokyo, Japan) and inspected for green fluorescence through yellow-colored glasses. The animal protocols were reviewed and approved by the Animal Care and Use Committee of Kyoto University Graduate School of Medicine (No. 10584).
 View Details | Fig. 1. Generation of transgenic mice expressing FRET biosensors. (A) Structure of FRET biosensors. AKAR3EV and EKAREV are FRET biosensors for PKA and ERK, respectively. YPet, a yellow fluorescent protein used as a FRET acceptor; TurquoiseGL and ECFP, cyan fluorescent proteins used as FRET donor; FHA1 and WW, phospho-threonine recognition domains; EV linker, a 116 amino-acid flexible linker; PKA and ERK substrates, substrates specific for PKA and ERK, respectively. NC, NES, and NLS denote negative control, nuclear exclusion signal, and nuclear localization signal, respectively. (B) The mode of action of a FRET biosensor. Phosphorylation of the biosensor by each kinase induces conformational change and increases in FRET. (C) A newborn transgenic mouse expressing AKAR3EV and a control mouse were inspected under blue light. (D) A reconstituted 3D structure of the skin of a transgenic mouse expressing AKAR3EV. Localization of AKAR3EV (green) and collagens (magenta) were determined by fluorescence and second harmonic generation (SHG) microscopy, respectively. Open and closed arrowheads indicate the epidermal and dermal layers, respectively. Grid size=30 μm. (E) CFP and SHG images of the skin of a transgenic mouse expressing EKAREV or a non-transgenic ICR mouse. Under the routine imaging condition, autofluorescence is mostly limited to hair follicles (arrowheads). Scale bar=20 μm. (F) Peritoneal macrophages were collected from the transgenic mice, cultured on glass based bottom dishes, timelapse-imaged to obtain FRET/CFP videos. For the activation of PKA and ERK, 1 mM dbcAMP and 1 μM TPA, respectively, were added at time zero. (G) A transverse section of E14.5 embryo expressing EKAREV demonstrating broad expression of EKAREV. FRET Images with 512 by 512 pixels were tiled and stitched. Shown are CFP in gray scale and FRET/CFP in intensity modulated display mode with 32-intensity in 8-ratio. NS, cartilage primordium of nasal septum; OE, olfactory epithelium; G, globe; ON, optic nerve; SB, cartilage primordium of sphenoid bone; Co, cochlea; Po, Pons; MO, medulla oblongata; SP, upper cervical region of spinal cord; BA, basilar artery; VAs, vertebral arteries. Scale bar=2 mm. |
The protocol for FRET imaging with epifluorescence microscopes has been described previously (Aoki and Matsuda, 2009). For two photon excitation (2P) microscopy, we used a BX61WI/FV1000 upright microscope equipped with a ×25 water-immersion objective lens (XLPLN25XW-MP; Olympus, Tokyo, Japan) or an IX81/FV1000 inverted microscope equipped with a ×30 silicon oil-immersion objective lens (UPLSAPO 30xS; Olympus), both of which were connected to a Mai Tai DeepSee HP Ti:sapphire Laser (Spectra Physics, Mountain View, CA). The excitation wavelength for CFP was 840 nm. We used an IR-cut filter, BA685RIF-3, two dichroic mirrors, DM505 and DM570, and three emission filters, FF01-425/30 (Semrock) for the second harmonic generation image, BA460-500 (Olympus) for CFP, and BA520-560 (Olympus) for YFP, respectively. Acquired images were analyzed with MetaMorph software (Universal Imaging, West Chester, PA) and Imaris Software (Bitplane AG, Zürich, Switzerland).
Five milliliter of PBS was injected into the peritoneal cavity of sacrificed mice. After gentle massage, peritoneal cavity was opened to collect the peritoneum washes into collagen-coated culture dishes. Three hours later, PBS was replaced with DMEM containing 10% FBS.
Mice were anaesthetized initially with pentobarbital (intraperitoneal injection, 37 mg/kg) and later with isoflurane (1.5% inhalation, 0.5 L/min). Then, after depilation, mice were placed on a microscope stage maintained at 30°C, and observed with the inverted 2P microscope as described. For laser ablation, the laser power was increased up to 30–50%, and the pre-determined regions were scanned 2–5 times. For the induction of skin inflammation, 20 μl of 10% arachidonic acid in acetone was topically applied to the auricle. After 3–4 hours, the mice were anaesthetized and observed as described. An LTB4 receptor inhibitor LY293111 was injected at 4 mg/kg via intraorbital space. A MEK inhibitor PD0325901 in PBS was injected at 5 mg/kg via intraorbital space.
Mice were anaesthetized as described. An incision was made in the median line of the abdominal wall. The small intestine was pulled out of the abdominal cavity and filled with phosphate buffered saline to minimize peristalsis. The serosa of the small intestine was positioned on the cover glass of the stage maintained at 37°C and observed with the inverted 2P microscope as described. For the stimulation of PKA, 12 mg/kg theophylline and 0.5 g/kg dbcAMP were sequentially administered via the right jugular vein. For the quantification of peristalsis, the coordinates of the nuclei of intermuscular plexus neurons were recorded every 30 seconds during the acquisition. The distance between the two coordinates of two sequential time points was calculated at each time point and then averaged for the nearby five time points. This value roughly reflects the level of peristalsis and was used to demonstrate its correlation with PKA activity.
To demonstrate the versatility of Tol2-mediated gene transfer, we generated transgenic mice expressing FRET biosensors for ERK and PKA (Harvey et al., 2008; Komatsu et al., 2011; Zhang et al., 2001) (Fig. 1A and B). The CAG promoter-driven expression cassettes of these FRET biosensors were inserted into the pT2A expression vector carrying the flanking Tol2 recombination sites (Sumiyama et al., 2010). After co-injection of oocytes with the pT2A-derived expression plasmids and Tol2 mRNA, mouse viability ranged from 23% to 47% (Table I). The integration rate ranged from 5% to 41%, a conservative estimate based on our simple visual inspection of body fluorescence at birth (Fig. 1C). Under the 2P microscope, the fluorescence signals from the FRET biosensors were readily distinguished from autofluorescence signals (Fig. 1D and E). To confirm the functional expression of FRET biosensors, peritoneal macrophages were collected and observed on glass base dishes (Fig. 1F). PKA activation by cAMP analogue and ERK activation by TPA were confirmed with the epi-fluorescence microscope. In embryos, the CAG promoter-driven broad expression allowed us to obtain an ERK activity map (Fig. 1G). Importantly, the transgenes were transmitted to offspring by Mendelian inheritance. Until the sixth generation of the transgenic mouse lines, the FRET biosensors were functional without any detectable change in the expression level.
We next demonstrated the utility of the transgenic mice expressing FRET biosensors by visualizing the activation of PKA and ERK in the epidermis. Upon localized laser ablation of the auricular epithelium, PKA was rapidly and diffusely activated in the squamous epithelium, as monitored by the increase in FRET/CFP ratio (Fig. 2A, Supplementary Movie S1). Interestingly, in squamous cells adjacent to the injured region, PKA was activated immediately (<1 minute), followed by a longer period of sustained activation (>60 minutes). Meanwhile, in cells 60 to 100 μm from the lesion, a gradual decrease in PKA activity followed the initial response. This observation suggested that the immediate response in PKA was caused by heat, and that the sustained activation was the result of chemical mediators. Epinephrine, for example, is known to activate PKA via the β2-adrenergic receptor in keratinocytes (Sivamani et al., 2009). In transgenic mice expressing the negative control FRET biosensor, no increase in FRET/CFP ratio was observed in the squamous epithelium (Fig. 2B, Supplementary Movie S1).
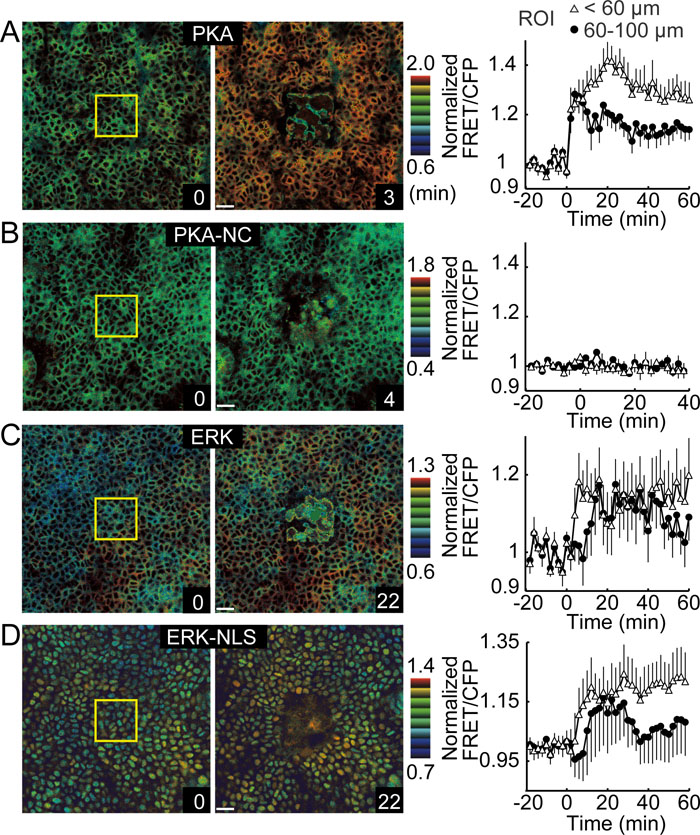 View Details | Fig. 2. Rapid and transient activation of PKA and ERK in laser-ablated skin. The auricular epidermis of transgenic mice expressing AKAR3EV (A), AKAR3EV-NC (B), EKAREV (C), or EKAREV-NLS (D) were observed by 2P microscopy (Supplementary Movie S1, S2). AKAR3EV-NC lacks the PKA phosphorylation site and serves as a negative control. FRET biosensors are localized at the cytoplasm (A, B, C) or the nucleus (D). Laser ablation was performed in the region demarcated by the yellow box. The colored side bars show the FRET/CFP ratio ranges. Scale bar=20 μm. Circular ROIs adjacent to (open triangles, <60 μm) or remote from (closed circles, 60–100 μm) the laser-ablated region were quantified for FRET/CFP signal ratios and plotted against time. Error bars indicate SD. |
Two FRET biosensors, EKAREV and EKAREV-NLS, were used to monitor ERK activities in the cytoplasm and the nucleus, respectively. Owing to their different localizations, EKAREV was advantageous to define the cell shape, whereas EKAREV-NLS precisely discriminated the activity changes of neighboring cells. In basal layer cells adjacent to laser-ablated lesions, ERK was rapidly activated, followed by a gradual increase in activity, which peaked at ten minutes (Fig. 2C and D, Supplementary Movie S2). Unlike PKA activation, the initiation of activation was delayed in cells adjacent to the lesion in a distance-dependent manner. Similar wound-mediated ERK activation was reported previously in cultured monolayer cells (Matsubayashi et al., 2004).
The transgenic mice described here allow direct video-monitoring of agonist/antagonist pharmacodynamics affecting various signaling molecules in different cell types of live mice. The marked activation of ERK in activated granulocytes prompted us to examine the effect of ERK inhibition on the migration of granulocytes induced by arachidonic acid. ERK activity in granulocytes dropped within a few minutes after intravenous injection of a MEK inhibitor, PD0325901 (Fig. 3A and B, Supplementary Movie S3). Interestingly, granulocytes halted migration approximately ten minutes after the inhibition of ERK activity (Fig. 3C and D). Close examination of cell movement in the video images revealed that several minutes after ERK inhibition, each granulocyte stochastically stopped migration, but continued to extend pseudopodia in many directions (Fig. 3B). Because granulocyte migration within the connective tissue requires attachment to and detachment from the extracellular matrices, our observation suggests that ERK activity may be required for the detachment process.
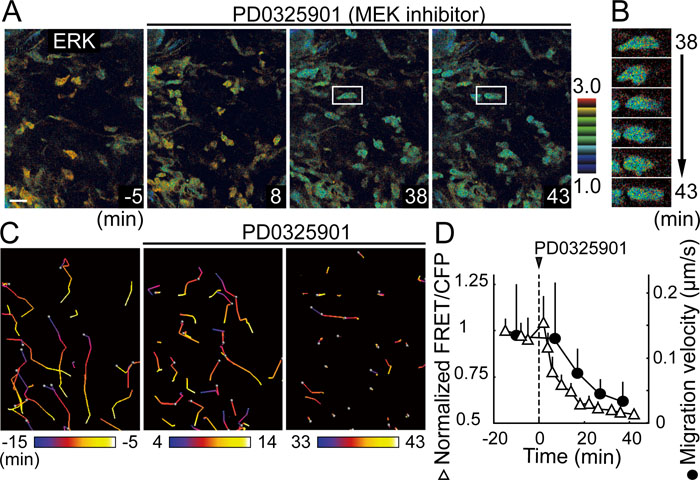 View Details | Fig. 3. Real-time monitoring of the pharmacodynamics of a MEK inhibitor. (A) Time-lapse 2P FRET images of the auricular dermis in a transgenic mouse expressing EKAREV, four hours after treatment with 10% arachidonic acid. A MEK inhibitor, PD0325901, was injected intravenously (5 mg/kg) at time zero. (B) Time-lapse images of a granulocyte indicated in (A). The granulocyte shows continuing morphologic changes even after migration arrest. (C) Track charts of granulocytes are shown at the indicated periods. (D) Migration velocities and normalized FRET/CFP ratios of granulocytes in (A) were calculated at the indicated time points and plotted against time, which shows a significant delay in granulocyte arrest following ERK inactivation. Error bars indicate SD. |
The transgenic mouse expressing the FRET biosensors also provides a tool to untangle the upstream signaling pathways that lead to chemotaxis in living mice (Fig. 4, Supplementary Movie S4). The arachidonic acid-induced mobilization and ERK activation of granulocytes in the dermis was suppressed by a competitive antagonist of a chemotactic cytokine LTB4, LY293111, injected at 0 min. Following laser ablation at 83 min induced rapid ERK activation and chemotaxis of the neighboring granulocytes toward the injured region, indicating that tissue damage-induced chemotaxis does not require LTB4 signaling. Injection of PD0325901 at 95 min suppressed ERK activity and inhibited migration of granulocytes. A second laser ablation of the nearby tissue at 129 min no more activated ERK nor evoked chemotaxis of granulocytes. These data showed the essential role of ERK activity in chemotaxis of granulocytes in live mice.
 View Details | Fig. 4. Effect of LTB4 receptor antagonist on granulocyte migration and ERK activity. Time-lapse FRET images of the auricular dermis in a transgenic mouse expressing EKAREV four hours after treatment with 10% arachidonic acid. Antagonist of LTB4 receptor, LY293111, was injected intravenously (4 mg/kg) at time zero. PD0325901 was injected intravenously (5 mg/kg) at 96 minutes. Laser ablation was performed in the region demarcated by the yellow box at the indicated time points. Scale bar=20 μm. |
Considering the enormous number of drugs that activate/inactivate PKA either directly or indirectly via Gs or Gi-coupled receptors, transgenic mice expressing the PKA FRET biosensor will provide an ideal animal model to study the pharmacodynamics of these pro- or anti-PKA drugs. To investigate this possibility, the cAMP phosphodiesterase inhibitor theophylline and a cAMP analogue, dibutyryl cyclic AMP (dbcAMP), were sequentially administered to these transgenic mice. PKA activity was monitored in the muscular layer of the small intestine, where intermuscular plexus neurons, smooth muscles, and endothelial cells were observed for their sensitivity to the reagents (Fig. 5, Supplementary Movie S5). Intestinal peristalsis was simultaneously quantified by the drift of the plexus neurons. Upon theophylline administration, PKA activity increased modestly in the smooth muscle cells, endothelial cells, and intermuscular plexus neurons. However, this modest increase in PKA was able to suppress the intestinal peristalsis only transiently. Additional injection of dbcAMP fully activated PKA in the smooth muscle cells and intermuscular plexus neurons, which resulted in the cessation of peristalsis. Remarkably, dbcAMP increased the PKA activity in the endothelial cells only marginally. Thus, the difference in the sensitivity to PKA agonists was also readily visible in the transgenic mice expressing the PKA FRET biosensor.
 View Details | Fig. 5. Monitoring the effect of PKA stimulators on PKA activity and peristalsis of the small intestine. (A) Intravital 2P FRET imaging of the muscular layer of the small intestine of a transgenic mice expressing AKAR3EV. A cAMP-specific phosphodiesterase inhibitor, theophylline, and a cAMP analogue, dbcAMP, were administered intravenously at 5 and 35 minutes after acquisition of the images. Scale bar=20 μm. (B) Peristalsis was quantified by the drift of the nucleus of plexus neurons. PKA activities (FRET/CFP ratio) in three cell types are plotted against time. Complete cessation of peristalsis was observed at 40 minutes, when PKA activity was increased in intermuscular plexus neurons. |
The difficulty of establishing transgenic mice expressing FRET biosensor has not been clearly described in previous papers. A rare example is a study by Calebiro et al. (2009). They attempted to generate transgenic mice carrying a FRET biosensor for cAMP, Epac1-camp. They also used the CAG promoter to drive ubiquitous expression of the probe and obtained ten PCR-positive pups after several rounds of injection. A high level of body fluorescence was detected in three of them, of which two showed heterogeneous expression, leaving only one transgenic mouse for the analysis. In many studies that reported the generation of transgenic mice expressing FRET biosensors, analysis was conducted in vitro with cells isolated from the tissues of transgenic mice (Atkin et al., 2009; Hara et al., 2004; Isotani et al., 2004; Nikolaev et al., 2006; Tsujino et al., 2005), and only a few of them succeeded in FRET imaging in living tissues (Atkin et al., 2009; Tsujino et al., 2005), probably due to low levels of expression.
Recently, Yamaguchi et al. succeeded in the generation of transgenic mice expressing a FRET biosensor for Caspase3 by introducing insulator sequences (Yamaguchi et al., 2011). The authors suggested that the low expression of FRET biosensors is caused by silencing of the transgene. Our transgenic mice lines are currently at the sixth generation. During this period, we have not observed decrease in the expression level of FRET biosensors. Therefore, the transposon-mediated gene transfer may not only inhibit recombination between cDNAs of CFP and YFP, but also prevent gene silencing of the FRET biosensor gene.
The high and broad expression of FRET biosensors could potentially develop two serious flaws. First, the high expression could perturb endogenous signaling pathways and deteriorate development of the transgenic mice. In fact, we have found that expression of a FRET biosensor for Ras caused infertility of the transgenic mice. Second, in solid tissues such as brain, identification of cell types is often difficult due to diffuse expression of the FRET biosensors. To circumvent these problems, we are developing transgenic mouse lines that express FRET biosensors in a Cre recombinase-dependent manner.
Experiments with tissue culture cells have yielded a great amount of information about signaling pathways over the past half century. However, striking differences between in vitro cultures and in vivo tissues are often difficult to reconcile. The successful generation of transgenic mice expressing FRET biosensors has the potential to fill the gaps in our understanding of the differences between tissue culture cells and live animals. Another promising application of these transgenic mice will be in monitoring of drug pharmacodynamics. Reporter mice expressing additional FRET biosensors will likely become indispensable in the development and screening of drugs targeting specific signaling molecules, and the assessment of both pharmacodynamics and drug toxicity.
We thank J. Miyazaki, J. Zhang, K. Svoboda, and K. Kawakami for the plasmids, Y. Inaoka, K. Hirano, R. Sakai, K. Naruo, N. Nonaka and A. Kawagishi for their technical assistance, and J. Hejna and A. Elfenbein for critical reading of our manuscript. This work was supported by a Grant-in-Aid for Scientific Research on Innovative Areas “Fluorescence Live imaging” (No. 22113002), by a Research Program of Innovative Cell Biology “Cell Innovation”, and by an Innovative Techno-Hub for Integrated Medical Bio-imaging Project of the Special Coordination Funds for Promoting Science and Technology.
|