Abstract
Polymer electrolyte membrane (PEM) water electrolysis has received significant attention as a suitable technology for hydrogen production because it can operate at a high current density, is compact, and can produce high purity hydrogen. However, this process involves high costs because precious metal catalysts are required to maintain high performance. To overcome this challenge and develop new materials to replace precious metals, the complex overlapping overpotentials must be considered separately. In a previous study, a structure that uses double reference electrodes by shifting the electrode arrangement was proposed for separating the overpotentials. This structure allows the electrolyte surface potential to be measured by a reference electrode far from the electrode by changing the potential distribution. However, the structure may cause a complicated three-dimensional potential distribution, which may adversely affects accurate measurement of the electrode potential. Therefore, the potential distribution was analyzed and evaluated using three-dimensional multiphysics simulations incorporating proton and electron conduction. As a result, a remarkable phenomenon called potential wraparound, which affects the distribution of electric potential, was observed. Furthermore, a significant finding was that this effect can be suppressed by changing the shape of the electrode.
1. Introduction
In recent years, hydrogen has been adopted as a new energy source due to the global movement toward carbon neutrality.1,2 Therefore, polymer electrolyte membrane (PEM) water electrolysis has gained attention as a hydrogen production method because it can operate at a high current density and produce high-purity hydrogen, and has a compact configuration.3,4 In addition, water electrolysis is part of the technology applied for storing hydrogen produced during electricity generation from renewable energy sources (P2G).5–8
Therefore, various approaches have been studied to further improve the performance of PEM water electrolyzers. Overpotentials are an important research topic to consider during electrolysis because they are directly related to electrolysis energy efficiency. Ojong et al.9 used a two-dimensional model to evaluate the contribution to cell voltage from multiple overpotentials, and suggested that activation overpotentials should be the focused for improving cell performance. The method includes improvement of catalytic performance. Lu et al.10 investigated the iridium-catalyzed oxygen evolution reaction and determined the reaction parameters. Mandal et al.11 measured the proton and electronic conductivities in the catalyst layer at different ionomer loadings. However, the catalysts were composed of precious metals such as platinum and iridium,12 resulting in high process costs.13 Additionally, research and development of different structures and alternative materials to reduce the use of expensive materials have been conducted. Babic et al.14 showed the relationship between proton transport resistance and catalyst loading of the anode. Schuler et al.15 developed microporous layers with advanced interfacial properties, which resulted in high catalyst utilization and low mass transport overpotentials.
On the other hand, it is also important to reduce the mass transport overpotential.9 The methods include stable temperature and pressure conditions, as well as a stable supply of water. Suermann et al.16 investigated the kinetic and mass transport overpotentials under high pressure. Sone et al.17 developed a cell that separates gas and water at the electrode surface, and Nakajima et al.18 modeled water transport in a gas-liquid separating cell using a finite element method.
Thus, overpotentials and their related performance have been evaluated from many perspectives, but they have included contact resistance. If porous transport layer (PTL) is soft, the contact resistance is small, and the membrane resistance could be measured almost accurately by impedance measurement. However, in water electrolysis, especially when the anode is titanium, the contact resistances with the current collector plate and catalyst layer is higher due to its hardness compared with carbon fibers. Liu et al.19 coated titanium based PTL with Ir and confirmed that the contact resistance between PTL and separator and between PTL and catalyst layer can be reduced to the level of carbon paper. It was also confirmed that it is possible to reduce the Ir loading while maintaining cell performance and reducing the contact resistance between the PTL and the catalyst layer.20 Thus, there is concern about the effects of contact resistance and efforts to reduce it, which shows the importance of overpotential separation. For an in-depth understanding, further research is necessary to separate and investigate overpotentials due to oxygen generation, membrane resistance, and other factors that affect process performance. However, each contact resistance cannot be separated at electrochemical impedance spectroscopy, so the reference electrodes are important.
Mitsushima et al.21 suggested a structure that used double reference electrodes by deliberately shifting the arrangement of electrodes to separate the overpotential of the two electrodes, the electrolyte, and their boundaries. They showed that the potentials at both sides of the electrolyte can be measured at a distance from the electrodes by modifying the shape of the electrodes and controlling potential distribution inside a PEM electrolyte. In addition, the use of double reference electrodes eliminates contact resistance and allows for separation of the anode, cathode, and membrane. Nagasawa et al.22 measured the overpotential and contact resistances using the structure proposed by Mitsushima et al. and determined the optimum clamping pressure of the electrolyzer. Watanabe et al.23 modeled the structure proposed by Mitsushima et al. in two dimensions and analyzed the changes in potential distribution with different amounts of electrode shift using multiphysics simulations. However, the two-dimensional analytical model is not sufficient to examine the effects of wraparound other than those from the electrode contact surface. Potential wraparound is a phenomenon caused by the change in the electric potential at a location away from the contact surface of the electrode and membrane due to the influence of the electric potential at various locations on the contact surface. This is an effect exhibited by the three-dimensionality of the model, and is also assumed to occur in practice. The contact surface between the electrolyte and the membrane is a straight line in the two-dimensional model, whereas it is a plane in the three-dimensional model, and the potential distribution on the electrolyte is affected by the new planar direction.
To overcome these gaps between experimental and numerical results in the literature, we modeled the structure20 in three dimensions and compared the potential distribution of this model with that of the two-dimensional model to clarify the effect of potential wraparound. We also propose a new shape for the electrode and confirm that the new T-shaped electrodes can suppress the effect of potential wraparound and improve measurement accuracy. In this study, we provide new insights into the shape change of the electrode and the potential wraparound based on the results of further analysis.
2. Methods
2.1 Calculation method
To evaluate the potential distribution, the reaction current density (iv) was calculated using the Butler-Volmer equation,24 and the charge transport was calculated using Ohm’s law25 and charge conservation. The main parameters are listed in Table 1.
Table 1. Model parameters.
| Parameter |
Value |
Unit |
Explanation |
| i0a |
3.3 × 10⁵ |
A m−3 |
anode exchange current
density |
| i0c |
8.3 × 10⁷ |
A m−3 |
cathode exchange
current density |
| αa |
0.5 |
|
anode charge transfer
coefficient |
| αc |
0.5 |
|
cathode charge transfer
coefficient |
| n |
2 |
|
reaction electron
number |
| F |
96485 |
C mol−1 |
Faraday constant |
| R |
8.3145 |
J (mol K)−1 |
gas constant |
| T |
353.15 |
K |
operating temperature |
The Butler-Volmer equation is expressed as
| \begin{equation}
i_{\text{v}} = i_{\text{0m}}\left[\exp \left(\frac{\alpha_{\text{a}}nF\eta}{RT} \right) - \exp \left\{-\frac{(1 - \alpha_{\text{c}}) nF\eta}{RT} \right\} \right]
\end{equation}
| (1) |
where
i0 is the exchange current density, α is the rate of reaction,
n is the number of electrons,
F is the Faraday constant,
η is the polarization,
R is the gas constant,
T is the temperature, a represents the anode, and c the cathode.
Ohm’s law and charge conservation are expressed as
| \begin{equation}
i_{\text{p}} = -\sigma_{\text{p}}\nabla \varphi_{\text{p}},\ i_{\text{e}} = -\sigma_{\text{e}}\nabla \varphi_{\text{e}}
\end{equation}
| (2) |
| \begin{equation}
i_{\text{v}} = \nabla i_{\text{e}} = -\nabla i_{\text{p}}
\end{equation}
| (3) |
where
ip is the proton current density,
σp is the proton conductivity,
φp is the proton potential,
ie is the electron current density, σ
e is the electron conductivity, and
φe is the electron potential.
As initial conditions, the electronic conductivity was assumed to be sufficiently high in the electrode and proton conductivity to be constant over the entire area.
The assumed boundary conditions were electronic insulation at the interface between the electrode and membrane, and proton insulation at the surfaces of the electrode and membrane. These boundary conditions can be expressed as
| \begin{equation}
n_{\text{e}}\cdot i_{\text{e}} = n_{\text{p}} \cdot i_{\text{p}} = 0
\end{equation}
| (4) |
where
ne is the normal vector of the interface between the electrode and membrane and
np is the normal vector of the surfaces of the electrode and membrane.
2.2 Cell geometry
Figure 1 depicts the calculation model used in this study, and Table 2 lists its basic dimensions. The model consists of a membrane sandwiched between electrodes, and the thickness appearance was enlarged 80 times in the y-axis direction.
Table 2. Dimensions of the calculation model.
| PEM thickness |
127 µm |
| PEM size |
20 mm × 20 mm |
| Catalyst layer thickness |
10 µm |
| Active area |
10 mm × 10 mm |
| Electrode shift |
two-dimensional
0 mm, 0.5 mm |
three-dimensional
(rectangular)
0 mm, 0.5 mm |
three-dimensional (T-shaped)
0 mm, 0.2 mm, 0.5 mm,
1 mm, 2 mm |
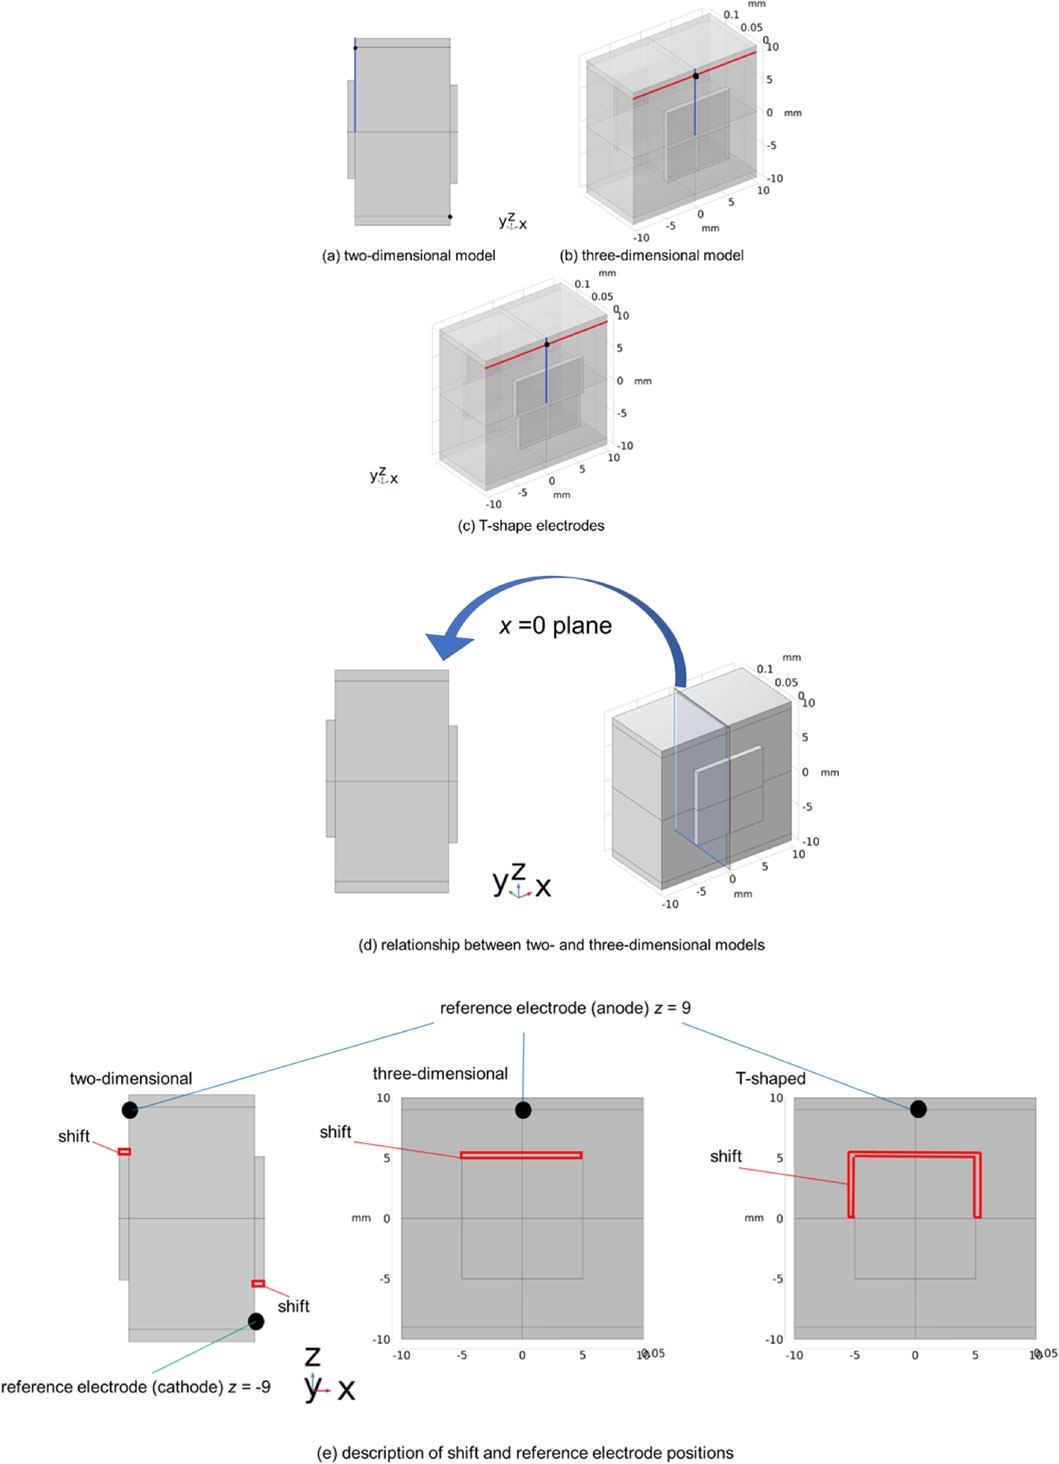
Figures 1a and 1b show the two- and three-dimensional models, respectively. The three-dimensional model was constructed by extending the two-dimensional model in the x-axis direction of the coordinate system, as shown in Fig. 1. Subsequently, a new shape (T-shape) was proposed to flatten the potential distribution and make it easier to measure experimentally. Figure 1c shows a three-dimensional model with a T-shaped electrode. This model applied electrode shifts along the x- and z-directions. The reference electrodes were located on the membrane surface at z = 9 for the anode and z = −9 for the cathode (black dots in Fig. 1). Figure 1d details the relationship between the two- and three-dimensional models. Figure 1e describes the shift and reference electrode positions in detail. The mesh type was a tetrahedron, and the minimum element size was 0.08 mm.
3. Results and Discussion
3.1 Model validation
Figure 2 shows the calculated overpotential from open circuit voltage characteristics for different mesh sizes in the three-dimensional model. The characteristics did not change when the minimum element size was changed to 0.03, 0.08, and 0.2 mm. The validity of the mesh size was confirmed as the characteristics do not change when the mesh size is larger or smaller than 0.08 mm, which was adopted in this study. The measured characteristic with a clamping pressure of 1.34 MPa22 is also plotted in Fig. 2, and these curves are consistent on the higher current side. However, smaller deviation was observed on the lower current side. The reason for the discrepancy between experimental and numerical results on the low current side can be attributed to the reactive overpotential based on the Butler-Volmer equation, which does not include the change in oxidation state of the electrode and reaction electron number on the low current density side. In this study, we focused on the high current density side to evaluate the potential distribution because the effects of contact resistance and other factors are large on the high current density side.
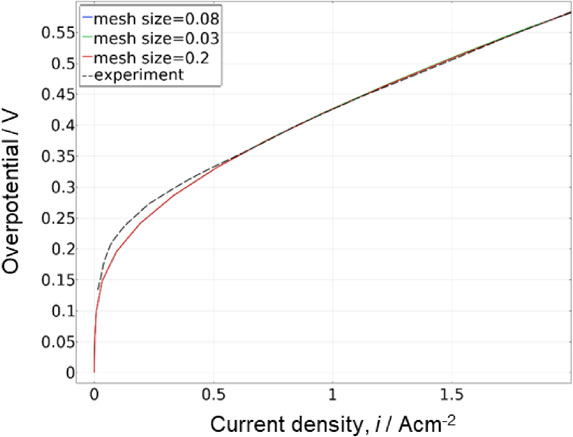
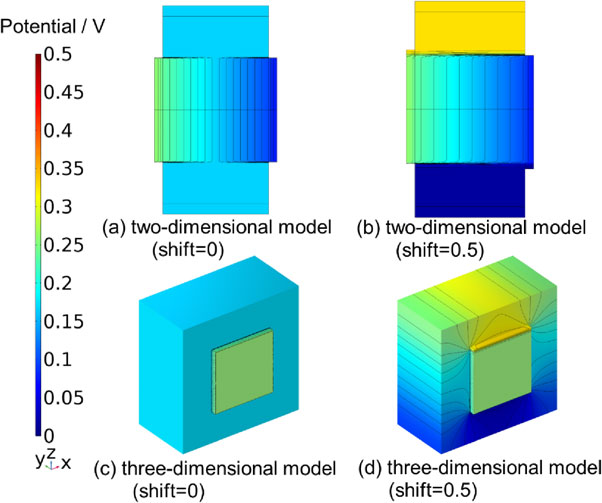
Figure 3 depicts the three-dimensional effects on the potential distribution when a voltage of 1.73 V was applied, represented by coloring and equipotential lines.
Figures 3a and 3b depict the two-dimensional models, Figs. 3c and 3d the three-dimensional models, and the overhang length (shift) from the square is 0 mm for (a) and (c), and 0.5 mm for (b) and (d). Comparing Figs. 3a and 3b, the potential distribution was changed by the shift, as demonstrated by Watanabe et al.23 For example, the reference electrode potential on the anode side is 0.166 V in (a) and 0.328 V in (b). Comparing (c) and (d), we confirmed that similar changes occur in the three-dimensional model. For example, the reference electrode potential on the anode side was 0.166 V in (c) and 0.307 V in (b).
Comparing the equipotential lines in Figs. 3b and 3d, it can be observed that the equipotential line in (b) does not change near the reference electrode, whereas in (d), the equipotential line wraps around near the reference electrode. This is the phenomenon of potential wraparound.
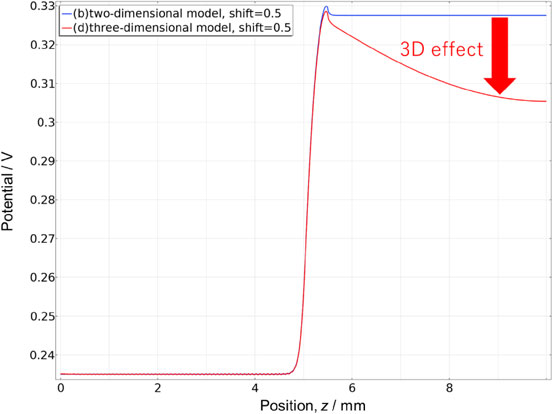
Figure 4 depicts the potential in the direction of the reference electrode (z-axis) from the center of the contact surface between the membrane and the electrode when a voltage of 1.73 V was applied when the shift = 0.5 (blue line in Fig. 1). In Fig. 4, the blue line represents the two-dimensional model, and the red line the three-dimensional model. In the two-dimensional model, the potential near the reference electrode was constant, whereas it decreased in the three-dimensional model. This was assumed to be a result of the effect caused by wraparound from sources other than the electrode contact surface because of the three-dimensional model. Moreover, this decrease was affected by the conductivity of the membrane and other factors, making it difficult to predict in a practical cell, and support by simulation is necessary.
3.3 Novel T-shaped electrodes for managed potential distribution
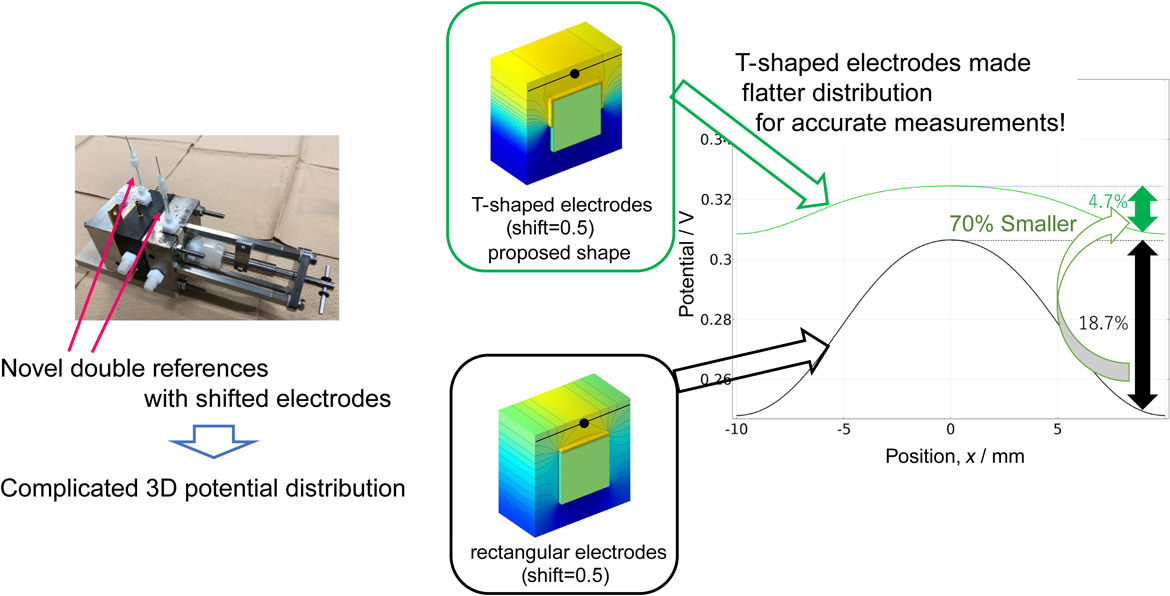
Figure 5 compares the results of the analysis of the potential distribution of the rectangular and T-shaped electrode models when a voltage of 1.73 V was applied, represented by coloring and equipotential lines. Figure 5a depicts the rectangular electrode model, and Figs. 5b, 5c, 5d, and 5e depict the T-shaped electrode models. Moreover, the shift was 0.5 mm for (a) and (c), 0.2 mm for (b), 1 mm for (d), and 2 mm for (e). Comparing Figs. 5a and 5c, the distribution of the electric potential was altered by changing the electrode to a T-shape. Comparing Figs. 5b, 5c, 5d, and 5e, the distribution of the electric potential was also found to change on changing the amount of shift of the T-shaped electrode. For example, the reference electrode potential on the anode side was 0.307 V for (a), 0.265 V for (b), 0.324 V for (c), 0.370 V for (d), and 0.415 V for (e).
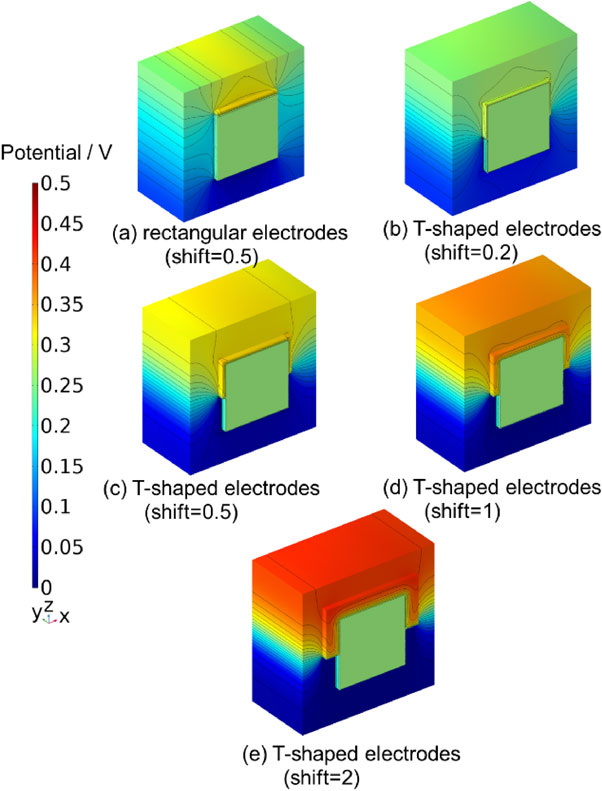
Comparing the equipotential lines in Figs. 5a and 5c, it can be observed that the equipotential line in (a) wraps around the reference electrode, whereas the equipotential line in (c) wraps around the reference electrode less. This is the effect of different electrode shapes on the potential wraparound.
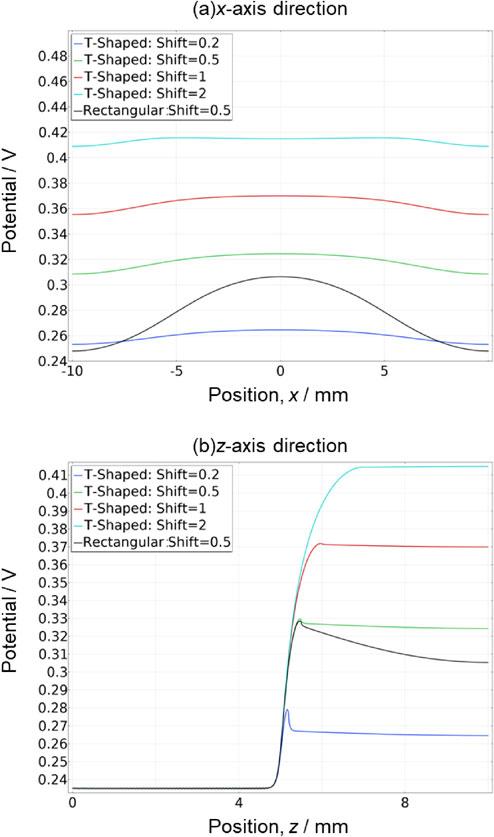
Figure 6 depicts the potential when a voltage of 1.73 V was applied to the rectangular and T-shaped electrodes in the x-axis direction at the position of the reference electrode (z = 9, red line in Fig. 1), as shown in Fig. 6a, and in the direction of the reference electrode (z-axis) from the center of the contact surface between the membrane and electrode (blue line in Fig. 1) in Fig. 6b. In both figures, the black line represents the rectangular electrode model with shift = 0.5, and the blue, green, red and light blue lines represent the T-shaped electrode models with shift = 0.2, 0.5, 1 and 2, respectively. In Fig. 6a, the rectangular electrode model exhibited a large decrease in electric potential as it moved away from the reference electrode in the x-axis direction, whereas the T-shaped model shows that the decrease is suppressed as the shift increased. For example, comparing the percentage decrease in potential at x = 9 with x = 0 as the basis, the rectangular and T-shaped electrodes exhibited decreases of 18.7 % and 4.7 %, respectively. Moreover, a similar comparison with the potential at x = 8.5 showed decreases of 18.1 % for the rectangular electrode and 4.5 % for the T-shaped electrode. Thus, a difference in position of only 0.5 mm changes the rate of decrease by 0.6 % for the rectangular electrode and 0.2 % for the T-shaped electrode. In Fig. 6b, the rectangular electrode model also showed a decrease in the potential near the reference electrode, while the T-shaped model showed a decrease in the slope as the shift increased. For example, the difference between the potentials at x = 8.5 and x = 9, expressed as a percentage with respect to the potential at x = 0, was 0.6 % for the rectangular electrode and 0.1 % for the T-shaped electrode. Thus, in both the x- and z-directions, the T-shaped electrode had less influence on the positional accuracy of the reference electrode. This shift in potential was assumed to be the result of a decrease in the effect of potential wraparound by adopting a T-shaped electrode. However, in both models, the resistance increased with the addition of the parts of the electrode, and the value of the potential increased. The larger the shift, the more stable the potential value, but a larger correction was required. For the T-shaped model, even though a shift of 0.2 is acceptable because the increase in potential is small and the wraparound is suppressed, fabrication of the electrode is extremely difficult. Therefore, a shift of 0.5 is the most practical for fabricating T-shaped electrodes.
By comparing the changes in the potential distribution with those of other shapes, we gained an in-depth understanding of the electrode shape and potential distribution, and determined the optimal structure to suppress the potential wraparound.
4. Conclusions
In this study, we developed a three-dimensional model with reference electrodes on both sides of a PEM water electrolysis system. The potential distribution with changing electrode structures was calculated, and the potential wraparound effect of the electrode near the reference electrode was revealed. Furthermore, by changing the shape of the electrodes, specifically to T-shaped, the effect of potential distribution became flatter and wraparound was suppressed. The findings can improve overpotential separation measurements for separating reaction resistances of the two electrodes and contact resistances, which will aid in validating these measurements. We will continue to closely compare the experimental and analytical results in future studies to improve our understanding of the phenomenon and the accuracy of the analytical model. An accurate understanding of the potential distribution in PEM water electrolysis, including the effects of wraparound, is expected to contribute to the research and development of new structures and materials to improve the performance of the electrode system.
Acknowledgments
We would like to express our appreciation to T. Ishida (Mitsushima Research Laboratory, Yokohama National University) for useful discussions from an experimental perspective. This study was based on results obtained from the Development of Fundamental Technology for Advancement of Water Electrolysis Hydrogen Production in Advancement of Hydrogen Technologies and Utilization Project (JPNP14021) commissioned by the New Energy and Industrial Technology Development Organization (NEDO).
CRediT Authorship Contribution Statement
Naruhisa Tsukase: Data curation (Lead), Methodology (Lead), Validation (Lead), Writing – original draft (Lead)
Konosuke Watanabe: Methodology (Supporting)
Takuto Araki: Supervision (Lead), Writing – review & editing (Lead)
Kensaku Nagasawa: Data curation (Supporting)
Shigenori Mitsushima: Conceptualization (Lead), Methodology (Lead)
Conflict of Interest
The authors declare no conflict of interest in the manuscript.
Funding
New Energy and Industrial Technology Development Organization: JPNP14021
Footnotes
T. Araki, K. Nagasawa, and S. Mitsushima: ECSJ Active Members
References
- 1) J. Liu, Y. Yin, J. Zhang, T. Zhang, X. Zhang, and H. Chen, J. Power Sources, 512, 230487 (2021).
- 2) Y. Xiao, Q. Ma, X. Shen, S. Wang, J. Xiang, L. Zhang, P. Cheng, X. Du, Z. Yin, and N. Tang, J. Power Sources, 528, 231218 (2022).
- 3) M. Carmo, D. L. Fritz, J. Mergel, and D. Stolten, Int. J. Hydrogen Energy, 38, 4901 (2013).
- 4) S. A. Grigoriev, P. Millet, S. A. Volobuev, and V. N. Fateev, Int. J. Hydrogen Energy, 34, 4968 (2009).
- 5) S. B. Walker, U. Mukherjee, M. Fowler, and A. Elkamel, Int. J. Hydrogen Energy, 41, 7717 (2016).
- 6) B. Bensmann, R. Hanke-Rauschenbach, G. Müller-Syring, M. Henel, and K. Sundmacher, Appl. Energy, 167, 107 (2016).
- 7) S. Kim, J. H. Han, J. Yuk, S. Kim, Y. Song, S. So, K. T. Lee, and T. H. Kim, J. Power Sources, 524, 231059 (2022).
- 8) A. Ebrahimi-Moghadam and M. Farzaneh-Gord, J. Power Sources, 512, 230490 (2021).
- 9) E. T. Ojong, J. T. H. Kwan, A. Nouri-Khorasani, A. Bonakdarpour, D. P. Wilkinson, and T. Smolinka, Int. J. Hydrogen Energy, 42, 25831 (2017).
- 10) Y. Lu, W. Wang, and F. Xie, J. Electroanal. Chem., 871, 114281 (2020).
- 11) M. Mandal, M. Moore, and M. Secanell, ACS Appl. Mater. Interfaces, 12, 49549 (2020).
- 12) T. Ioroi, K. Yasuda, Z. Siroma, N. Fujiwara, and Y. Miyazaki, J. Power Sources, 112, 583 (2002).
- 13) M. F. Kaya and N. Demir, Fuel Cells, 17, 37 (2017).
- 14) U. Babic, E. Nilsson, A. Pătru, T. J. Schmidt, and L. Gubler, J. Electrochem. Soc., 166, F214 (2019).
- 15) T. Schuler, J. M. Ciccone, B. Krentscher, F. Marone, C. Peter, T. J. Schmidt, and F. N. Büchi, Adv. Energy Mater., 10, 1903216 (2020).
- 16) M. Suermann, T. J. Schmidt, and F. N. Büchi, Electrochim. Acta, 211, 989 (2016).
- 17) Y. Sone, O. S. Hernandez-Mendoza, A. Shima, M. Sato, H. Nakajima, and H. Matsumoto, Electrochemistry, 89, 138 (2021).
- 18) H. Nakajima, V. Vediyappan, H. Matsumoto, M. Sato, O. S. Mendoza-Hernandez, A. Shima, and Y. Sone, Electrochemistry, 90, 017002 (2022).
- 19) C. Liu, M. Carmo, G. Bender, A. Everwand, T. Lickert, J. L. Young, T. Smolinka, D. Stolten, and W. Lehnert, Electrochem. Commun., 97, 96 (2018).
- 20) C. Liu, K. Wippermann, M. Rasinski, Y. Suo, M. Shviro, M. Carmo, and W. Lehnert, ACS Appl. Mater. Interfaces, 13, 16182 (2021).
- 21) S. Mitsushima, H. Kashiwagi, K. Nagasawa, and Y. Kuroda, ECS Meet. Abstr., MA2019-02, 1715 (2019).
- 22) K. Nagasawa, T. Ishida, H. Kashiwagi, Y. Sano, and S. Mitsushima, Int. J. Hydrogen Energy, 46, 36619 (2021).
- 23) K. Watanabe, T. Araki, K. Nagasawa, Y. Kuroda, and S. Mitsushima, ECS Meet. Abstr., MA2020-02, 2484 (2020).
- 24) M. Kiel, O. Bohlen, and D. U. Sauer, Electrochim. Acta, 53, 7367 (2008).
- 25) C. Batchelor-McAuley, K. Ngamchuea, and R. G. Compton, J. Electroanal. Chem., 830–831, 88 (2018).