Abstract
We aimed to clarify the pathophysiological significance of total bilirubin (TB) in gestational diabetes mellitus (GDM). This was a cross-sectional study that included 616 pregnant Japanese women (368 normal glucose tolerance [NGT] and 248 GDM). Serum TB concentration, homeostasis model assessment of insulin resistance (HOMA-IR), and other clinical parameters were compared in NGT and GDM women. TB concentration was also compared according to the number of abnormal OGTT values. Logistic regression analysis was used to evaluate the association between TB and GDM prevalence. A multiple linear regression model was used to evaluate the association between TB and HOMA-IR. TB concentrations were significantly lower in GDM women than in NGT women. This result did not change after adjustments for TB sampling timing were made. Out of 248 GDM women, the prevalences of 1- and 2/3- abnormal OGTT values (1- and 2/3-AV) GDM were 72.2% (n = 179) and 27.8% (n = 69), respectively. In the multiple comparisons, TB concentrations were significantly lower in women with 2/3-AV GDM than in women with NGT and 1-AV GDM. Multiple logistic regression analysis showed that TB was a significantly associated factor for 2/3-AV, but not for total GDM. HOMA-IR was significantly higher in GDM women than in NGT women. The univariate, but not multivariate, analysis showed that TB was a significantly associated factor for HOMA-IR. Our findings suggest that hypobilirubinemia may be involved in the pathogenesis of GDM.
GESTATIONAL DIABETES MELLITUS (GDM) is defined as a glucose-metabolism abnormality diagnosed during pregnancy. Women diagnosed with GDM have a high risk of developing type 2 diabetes mellitus after delivery [1, 2]. The incidence of GDM is increasing annually, both due to the increase in pregnancy in women of advanced age and the change to the new diagnostic criteria of GDM [3] by Internal Association of Diabetes and Pregnancy Study Group.
Compared to pregnant women without GDM, those with GDM often have a higher body mass index (BMI) before pregnancy [4, 5], increased oxidative stress [6], and elevated inflammatory mediators [7, 8], all of which are known to lead to insulin resistance. Conversely, it is known that maternal and placental hormones, such as prolactin, enhance insulin secretion and increase the size and number of β-cells in order to compensate for decreased insulin sensitivity, which is called β-cell adaptation [9]. Collectively, both increased insulin resistance and decreased insulin secretion can contribute to the development of GDM, which is the case with type 2 diabetes [10, 11].
Bilirubin possesses potent anti-oxidative [12, 13] and anti-inflammatory properties [14]. The possible mechanism of the former is the elimination of reactive oxygen species, while that of the latter is the inhibition of endothelial adhesion molecules such as E-selectin, intercellular adhesion molecule-1, and vascular cell-adhesion molecule-1, by tumor necrosis factor-alpha. We, as well as other investigators, have reported that bilirubin concentration is negatively associated with microvascular complications in type 1 [15, 16] and type 2 [17, 18] diabetes. Thus, bilirubin might have protective effects against vascular complications in patients with diabetes. Moreover, hypobilirubinemia might be associated with increased homeostasis model assessment of insulin resistance (HOMA-IR) [19], the high prevalence of metabolic syndrome [19], and development of type 2 diabetes [20]. However, the effect of hypobilirubinemia on GDM is controversial. Liu et al. reported that higher direct bilirubin concentration was associated with a lower risk of developing GDM [21]. In contrast, other investigators could not find such an association [22, 23]. Accordingly, we conducted this study in order to clarify the pathophysiological significance of bilirubin in GDM by comparing the serum total bilirubin (TB) concentrations in pregnant women with and without GDM. We also assessed the contribution of insulin resistance and β-cell dysfunction to the development of GDM using HOMA-IR and homeostasis model assessment for β-cell function (HOMA-β).
Materials and Methods
Patients
This cross-sectional study included 616 Japanese singleton pregnant women: 368 women with normal glucose tolerance (NGT) and 248 women with GDM, whose TB concentrations were measured during pregnancy between January 2013 and August 2016. Women with severe liver dysfunction were not included. At the department of obstetrics and gynecology of our hospital, serum TB concentration is primarily measured in pregnant women who are having a Caesarian section, induced delivery or taking ritodrine hydrochloride. The information system department of the Keio University Hospital retrieved data as far back as January 2013 and found 248 GDM women who were suitable for inclusion in this study. This study started in August 2016. Consequently, the study period was 3 years and 8 months. During this period, we identified 368 NGT women who gave birth at our hospital and whose medical records contained the necessary data required for this study. In women with GDM, serum TB concentration was measured at the time of diagnosis of GDM, while it was mostly measured during the perinatal period (last hospital visit for childbirth hospitalization) in women with NGT. Patients with the following conditions were excluded: multiple conception, type 1 and type 2 diabetes, hematologic diseases, renal dysfunction (i.e., serum creatinine [Cr] level >1.2 mg/dL), and abnormal liver function test results (i.e., serum aspartate aminotransferase [AST] or alanine aminotransferase [ALT] level >3 times the upper limit of the normal range). Our study was approved by the ethical committee of Keio University School of Medicine and performed in accordance with the Declaration of Helsinki. Informed consent was not obtained. Instead, the information of this study and patients’ right to opt-out was posted in our hospital.
Data collection
Baseline demographic and clinical data were collected from the medical records of all participants. Demographic data collected included gestational age (GA), height, pre-pregnancy body weight, blood pressure, parity, family history of diabetes, previous history of GDM, past history of macrosomia, blood sampling timing (GA), TB level, AST level, ALT level, and Cr level. The family history of diabetes was defined as the presence of diabetes in first-degree relatives [24]. GA was confirmed in the first trimester by crown-rump length measurements. Pre-pregnancy BMI was calculated as weight divided by height squared (kg/m2), from self-reported pre-pregnancy weight and height measured while wearing no shoes at the first prenatal visit.
Each woman underwent a two-step screening for GDM: universal early testing in early pregnancy and a standard 1-h, 50-g oral glucose challenge test (GCT) in late pregnancy [25]. The universal early testing included the clinical risk factors as follows: 1) pre-pregnancy obesity (BMI ≥25 kg/m2), 2) past history of gestational diabetes, 3) past history of macrosomia (birth weight ≥4,000 g), 4) family history of diabetes and 5) random plasma glucose concentration ≥95 mg/dL. If women were positive for any of these clinical risk factors at the first visit, the diagnostic 75-g OGTT (i.e., early OGTT) was performed. All women with the negative results in early pregnancy underwent a GCT between 24 and 27 weeks of gestation. If the result of this GCT exceeded 140 mg/dL, the diagnostic 75-g OGTT was then performed (i.e., late OGTT). While the fasting state was not required for the GCT [26, 27], 75-g OGTT was performed after a 12-h overnight fast. In the 75-g OGTT, blood glucose and immunoreactive insulin (IRI) levels were measured three times (before loading, 1-h, and 2-h after loading). The diagnosis of GDM was made when the glucose value during 75-g OGTT was elevated in at least one of the following time points as follows: fasting ≥92 mg/dL, 1-h ≥180 mg/dL, and 2-h ≥153 mg/dL [3]. Furthermore, a single and two or three of elevated values in 75-g OGTT were defined as 1- and 2/3- abnormal OGTT values (AV). The women with GDM in this study included those diagnosed with GDM via either early (n = 112) or late (n = 136) OGTT. The 368 women with NGT was defined as those with normal GCT (n = 235) or normal 75-g OGTT (n = 133) results.
Both HOMA-IR and HOMA-β were calculated using the approximated equation of Matthews et al. [28, 29].
Statistical analyses
Demographic and laboratory data between women with NGT and those with GDM were compared by using an unpaired t-test or Fisher’s exact test. We compared total bilirubin concentration in women with GDM diagnosed via early OGTT and those diagnosed via late OGTT, and between NGT women and GDM women tested during the 30–41 gestational week period, using an unpaired t-test. The Bonferroni method was used to compare serum TB concentration according to the number of abnormal value (a single and two or three abnormal OGTT values [1- and 2/3-AV]) of GDM. Correlation of TB concentration with GA and HOMA-IR was examined by Spearman’s correlation analysis. All the participants (n = 616) were divided into quintiles according to TB concentration (Q1 (n = 70): 0.3–0.4 mg/dL, Q2 (n = 139): 0.5 mg/dL, Q3 (n = 164): 0.6 mg/dL, Q4 (n = 108): 0.7 mg/dL and Q5 (n = 135): ≥0.8 mg/dL), and the Cochran-Armitage trend test was used to determine any associations between GDM prevalence and quintiles of TB concentration. ANOVA was used to determine any associations between quintiles of TB concentration and continuous clinical variables (age, systolic blood pressure, pre-pregnancy BMI, blood sampling timing, HOMA-IR, and HOMA-β). Multiple logistic regression analysis was performed to evaluate the association of GDM with TB concentration, blood sampling timing, age, pre-pregnancy BMI, and family history of diabetes. A similar analysis was performed with 2/3-AV GDM prevalence set as a dependent variable. A multiple linear regression model was used to identify associated factors for HOMA-IR. HOMA-IR and blood sampling timing were logarithmically transformed because they were not normally distributed.
All continuous variables are presented as a mean ± standard deviation. A p-value <0.05 was considered statistically significant. Statistical analyses were performed using the Statistical Package for the Social Sciences (SPSS v. 21.0, Chicago, IL, USA) and Bell Curve for Excel 2.15 (Social Survey Research Information Co., Ltd., Tokyo, Japan).
Results
Patient demographic and laboratory data
The patient demographic and laboratory data are presented in Table 1. TB concentration was significantly lower in GDM women than in NGT women (0.61 ± 0.18 vs. 0.66 ± 0.20 mg/dL; p = 0.004). Significant differences were also demonstrated between NGT women and GDM women for pre-pregnancy BMI (p < 0.001), prior GDM (p = 0.001), family history of diabetes (p < 0.001), and blood sampling timing (p < 0.001). TB did not differ significantly between GDM women diagnosed early and those diagnosed late (p = 0.446).
Table 1Patient demographic and laboratory data
|
Total
(n = 612) |
GDM
(n = 248) |
|
NGT
(n = 368) |
p-value
(GDM vs. NGT) |
early GDM
(n = 112) |
late GDM
(n = 136) |
p-value
(early vs. late) |
| Age (years) | 36.9 ± 4.9 | 36.9 ± 5.1 | 37.1 ± 4.8 | 36.8 ± 5.3 | 0.637 | 36.8 ± 4.7 | 0.858 |
| Pre-pregnancy BMI (kg/m2) | 21.2 ± 3.1 | 21.7 ± 3.4 | 22.1 ± 3.1 | 21.4 ± 3.5 | 0.083 | 20.8 ± 2.9 | <0.001 |
Parity, n (%)
(0/1/2/3 times) | 407 (66.5)/
171 (27.9)/
35 (5.7)/
3 (0.5) | 167 (67.3)/
66 (26.6)/
14 (5.6)/
1 (0.4) | 67 (59.8)/
38 (33.9)/
7 (6.3)/
0 (0.0) | 100 (73.5)/
28 (20.6)/
7 (5.2)/
1 (0.7) | 0.079 | 240 (65.2)/
105 (28.5)/
21 (5.7)/
2 (0.5) | 0.946 |
| Prior GDM, n (%) | 24 (3.9) | 18 (7.3) | 11 (9.8) | 7 (5.1) | 0.158 | 6 (1.6) | 0.001 |
| Family history of diabetes, n (%) | 66 (10.8) | 41 (16.5) | 21 (18.7) | 20 (14.7) | 0.394 | 25 (6.8) | <0.001 |
History of macrosomia,
n (%) | 2 (0.3) | 1 (0.4) | 0 (0.0) | 1 (0.7) | 0.363 | 1 (0.3) | 1 |
| SBP (mmHg) | 112.3 ± 13.4 | 112.1 ± 14.7 | 112.2 ± 14.4 | 111.9 ± 15.0 | 0.864 | 112.4 ± 12.6 | 0.777 |
| Blood sampling timing (GW) | 34.6 ± 5.3 | 32.8 ± 7.4 | 31.5 ± 9.0 | 33.9 ± 5.7 | 0.011 | 35.9 ± 2.5 | <0.001 |
| TB (mg/dL) | 0.64 ± 0.19 | 0.61 ± 0.18 | 0.60 ± 0.17 | 0.62 ± 0.19 | 0.446 | 0.66 ± 0.20 | 0.004 |
| AST (U/L) | 18.1 ± 6.9 | 18.1 ± 7.9 | 17.6 ± 4.8 | 18.6 ± 9.8 | 0.349 | 18.0 ± 6.1 | 0.809 |
| ALT (U/L) | 11.9 ± 9.1 | 12.6 ± 11.8 | 11.9 ± 6.3 | 13.1 ± 14.9 | 0.451 | 11.4 ± 6.8 | 0.126 |
| Cr (mg/dL) | 0.52 ± 0.09 | 0.52 ± 0.09 | 0.52 ± 0.08 | 0.52 ± 0.09 | 0.659 | 0.52 ± 0.09 | 0.932 |
| Data from 75-g OGTT |
Total
(n = 381) |
GDM
(n = 248) |
|
NGT
(n = 133) |
p-value
(GDM vs. NGT) |
|---|
early GDM
(n = 112) |
late GDM
(n = 136) |
p-value
(early vs. late) |
| Fasting glucose (mg/dL) | 87.8 ± 7.9 | 90.2 ± 8.3 | 93.1 ± 6.3 | 87.7 ± 9.0 | <0.001 | 83.4 ± 4.8 | <0.001 |
| 1-h glucose (mg/dL) | 154.8 ± 33.0 | 164.7 ± 33.8 | 155.5 ± 37.3 | 172.3 ± 28.6 | <0.001 | 136.4 ± 21.7 | <0.001 |
| 2-h glucose (mg/dL) | 136.3 ± 28.8 | 145.7 ± 29.5 | 139.4 ± 31.4 | 150.8 ± 26.8 | 0.002 | 119.0 ± 17.2 | <0.001 |
| Fasting IRI (μU/mL) | 6.2 ± 3.4 | 6.8 ± 3.6 | 6.6 ± 3.5 | 7.0 ± 3.8 | 0.357 | 5.1 ± 2.7 | <0.001 |
| 1-h IRI (μU/mL) | 61.2 ± 32.8 | 63.2 ± 32.4 | 60.2 ± 28.8 | 65.7 ± 35.0 | 0.186 | 57.4 ± 33.4 | 0.096 |
| 2-h IRI (μU/mL) | 59.0 ± 34.7 | 65.3 ± 37.5 | 60.5 ± 34.0 | 69.3 ± 39.8 | 0.063 | 47.3 ± 25.2 | <0.001 |
| HOMA-β | 92.2 ± 48.2 | 91.5 ± 46.2 | 78.2 ± 35.5 | 102.4 ± 51.0 | <0.001 | 93.6 ± 51.8 | 0.678 |
| HOMA-IR | 1.38 ± 0.84 | 1.55 ± 0.90 | 1.54 ± 0.87 | 1.56 ± 0.93 | 0.849 | 1.07 ± 0.58 | <0.001 |
Values are expressed as number (%) or mean ± standard deviation.
Abbreviations: Total, Total study patients; GDM, gestational diabetes; OGTT, oral glucose tolerance test; early GDM, GDM diagnosed via 75-g OGTT conducted in early pregnancy; late GDM, GDM diagnosed via 75-g OGTT conducted in second trimester or later; NGT, normal glucose tolerance; BMI, body mass index; SBP, systolic blood pressure; GW, gestational week; AST, aspartate aminotransferase; ALT, alanine aminotransferase; Cr, creatinine; IRI, insulin; HOMA-β, homeostasis model assessment for β-cell function; HOMA-IR, homeostasis model assessment of insulin resistance
Further focused analyses were conducted on 381 pregnant women consisting of 133 NGT women and 248 GDM (112 early and 136 late) women who underwent 75-g OGTT. The GA for early and late OGTT results were 12.9 ± 1.6 weeks and 25.1 ± 4.6 weeks, respectively. Significant differences were demonstrated between NGT and GDM women in terms of fasting (p < 0.001), 1-h (p < 0.001) and 2-h (p < 0.001) glucose level, fasting (p < 0.001) and 2-h (p < 0.001) IRI, and HOMA-IR (p < 0.001). However no significant differences were found in 1-h IRI (p = 0.096) and HOMA-β (p = 0.678). Fasting (p < 0.001), 1-h (p < 0.001), and 2-h (p = 0.002) glucose levels and HOMA-β (p < 0.001) levels did differ significantly between early and late onset of GDM. However, no significant differences were found for 1-h IRI at fasting (p = 0.357), 1-h (p = 0.186), 2-h (p = 0.063), and HOMA-IR (p = 0.849).
Comparison of TB concentration adjusted for blood sampling timing
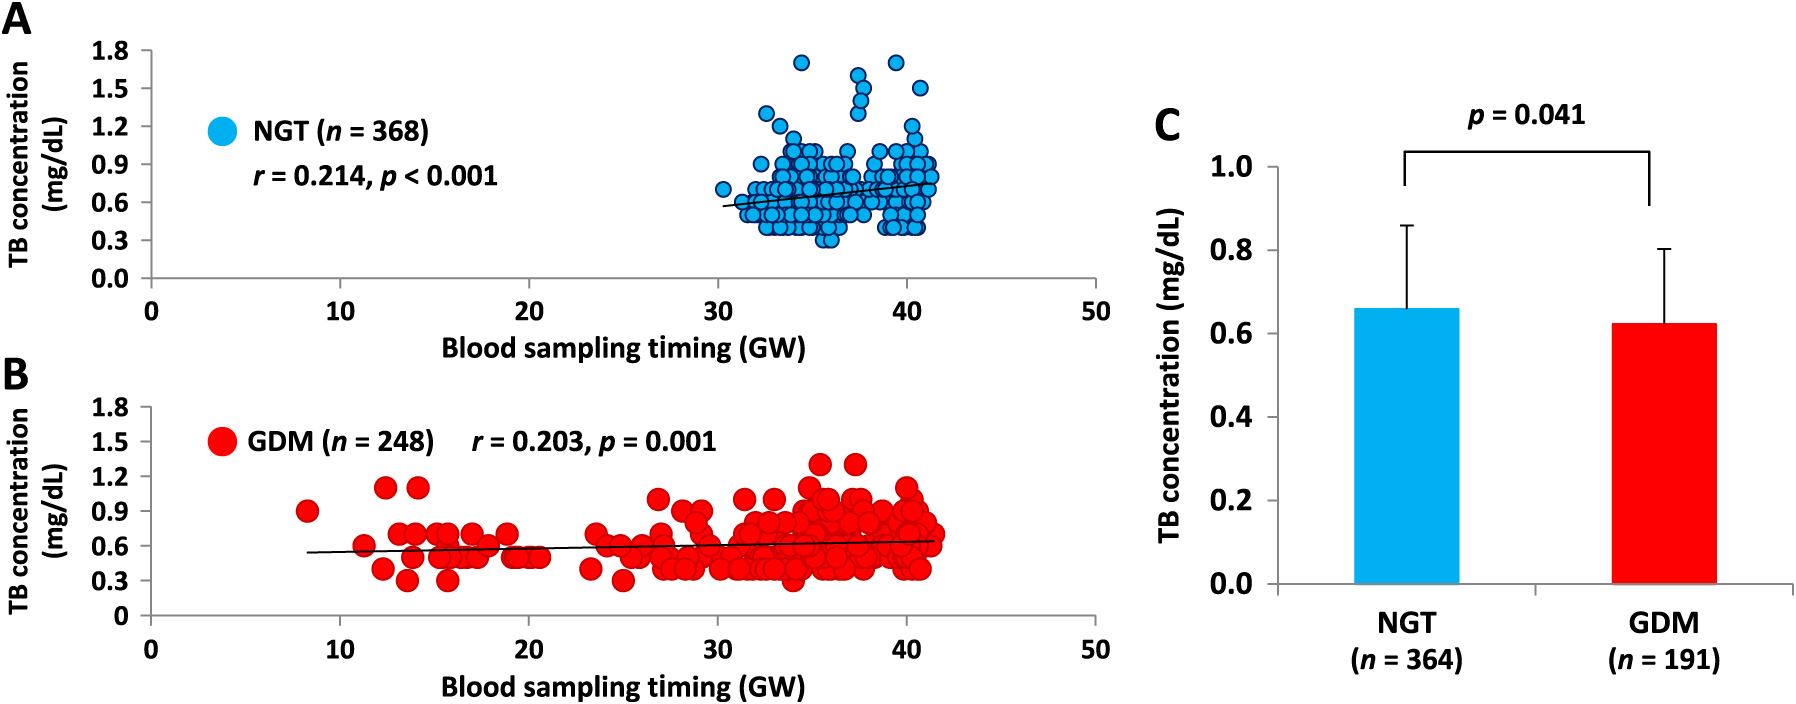
As shown in Fig. 1A and 1B, TB concentration and blood sampling timing (gestational week) were positively correlated in both NGT women (r = 0.214, p < 0.001) and GDM women (r = 0.203, p = 0.001). Because blood sampling timings were significantly different (p < 0.001) between NGT and GDM women, as shown in Table 1, we compared TB concentrations measured between 30–41 gestational weeks only in order to adjust for blood sampling timing differences. As a result, TB concentrations were still significantly lower in GDM women than in NGT women (0.62 ± 0.18 vs. 0.66 ± 0.20 mg/dL; p = 0.041), as shown in Fig. 1C.
Relationship between quintiles of TB concentration and GDM
Among the women belonging to Q1, Q2, Q3, Q4, and Q5, 38, 67, 62, 33, and 48 women were diagnosed with GDM, respectively. Fig. 2 shows the prevalence of GDM according to the quintiles of TB concentration. There was a significant (p < 0.001) tendency for women with lower TB concentrations to have GDM. As shown in Table 2, lower TB concentration was associated with higher pre-pregnancy BMI (p < 0.001), earlier sampling timing (p < 0.001), higher HOMA-β (p = 0.046), and higher HOMA-IR (p < 0.001).
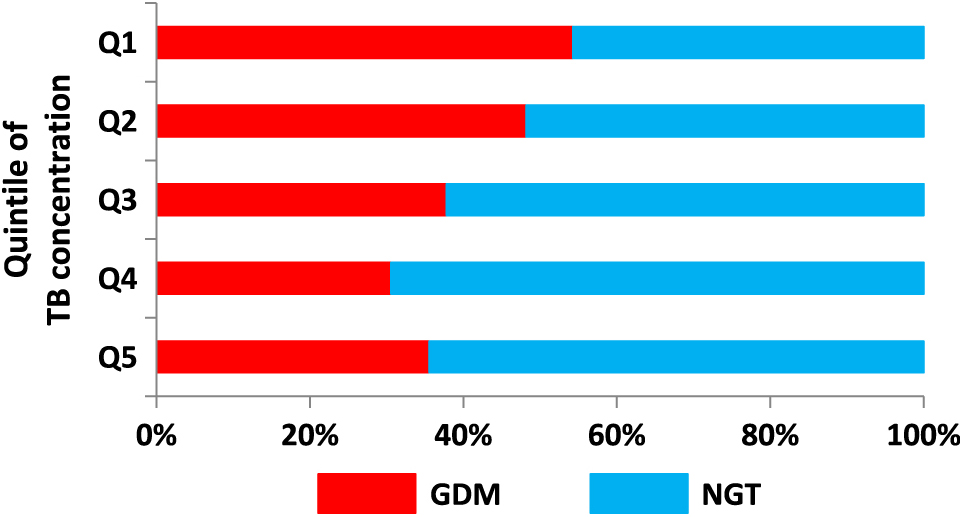
Table 2
Relationship between quintiles of total bilirubin concentration and basic characteristics
|
Q1 |
Q2 |
Q3 |
Q4 |
Q5 |
p for trend |
| Age (year) |
35.7 ± 4.7 |
36.8 ± 4.5 |
37.2 ± 4.7 |
36.7 ± 5.2 |
37.2 ± 5.2 |
0.205 |
| SBP (mmHg) |
114.0 ± 13.7 |
110.3 ± 13.5 |
113.0 ± 15.1 |
111.8 ± 12.8 |
112.8 ± 11.4 |
0.277 |
| HOMA-β |
110.9 ± 56.0 |
90.9 ± 50.0 |
86.8 ± 51.7 |
90.8 ± 37.4 |
89.3 ± 40.3 |
0.046 |
| HOMA-IR |
1.89 ± 1.26 |
1.38 ± 0.72 |
1.26 ± 0.81 |
1.29 ± 0.64 |
1.26 ± 0.64 |
<0.001 |
| TB sampling timing (GW) |
33.7 ± 5.8 |
33.0 ± 6.2 |
35.1 ± 4.0 |
34.9 ± 5.6 |
36.0 ± 4.7 |
<0.001 |
| Pre-pregnancy BMI (kg/m2) |
22.8 ± 4.6 |
21.2 ± 2.6 |
21.0 ± 3.3 |
20.9 ± 2.3 |
20.7 ± 2.7 |
<0.001 |
Values are expressed as number (%) or mean ± standard deviation.
Abbreviations: BMI, body mass index; SBP, systolic blood pressure; GW, gestational week; HOMA-β, homeostasis model assessment for β-cell function; HOMA-IR, homeostasis model assessment of insulin resistance
Multiple logistic regression analysis showed that TB (p = 0.255) was not a significantly associated factor for GDM, but blood sampling timing (odds ratio [OR] = 0.882; 95% confidence interval [CI], 0.846–0.919; p < 0.001), pre-pregnancy BMI (OR = 1.096; 95% CI, 1.036–1.160; p = 0.001), and family history of diabetes (OR = 2.734; 95% CI, 1.563–4.782; p < 0.001) were (Table 3).
Table 3
Clinical factors associated with GDM prevalence
|
OR |
95% CI |
p-value |
| TB (mg/dL) |
0.575 |
0.222–1.490 |
0.255 |
| Blood sampling timing (GW) |
0.882 |
0.846–0.919 |
<0.001 |
| Age (years) |
1.006 |
0.971–1.042 |
0.728 |
| Pre-pregnancy BMI (kg/m2) |
1.096 |
1.036–1.160 |
0.001 |
Family history of diabetes
(yes = 1, no = 0) |
2.734 |
1.563–4.782 |
<0.001 |
Abbreviations: GDM, gestational diabetes; TB, total bilirubin; GW, gestational week; BMI, body mass index; OR, odds ratio; CI, confidence interval
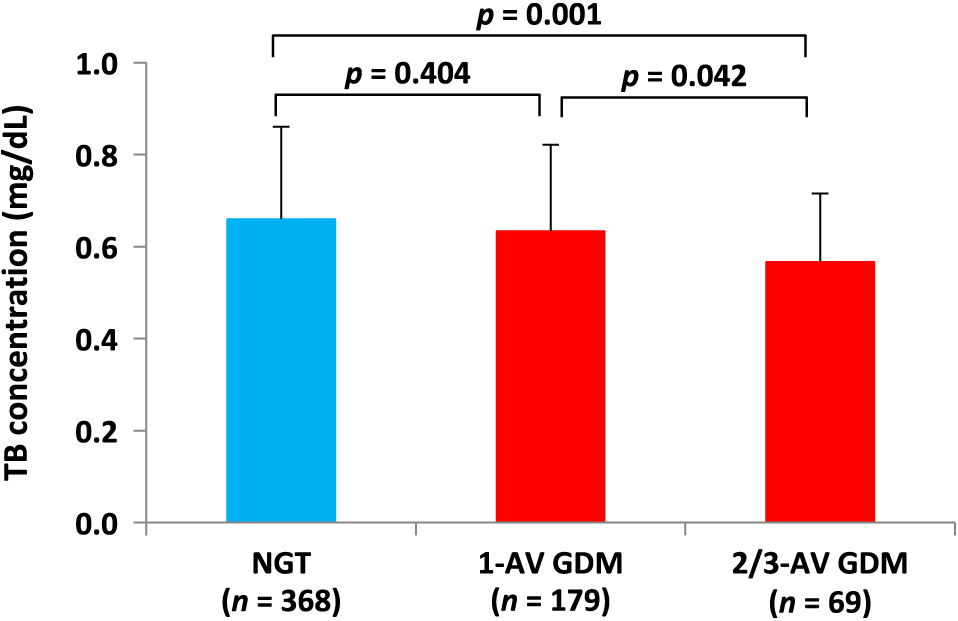
Out of 248 women with GDM, the prevalence of 1- and 2/3-AV GDM were 72.2% (n = 179) and 27.8% (n = 69), respectively. As shown in Fig. 3, serum TB concentration showed a decreasing trend as the number of AV increased. In the multiple comparison Bonferroni test, TB concentration in women with 2/3-AV GDM (0.57 ± 0.15 mg/dL) was significantly lower than that in women with NGT (0.66 ± 0.20 mg/dL, p = 0.001) and 1-AV GDM (0.63 ± 0.19 mg/dL, p = 0.042).
Clinical factors associated with 2/3-AV GDM prevalence
As shown in Table 4, multiple logistic regression analysis showed that TB concentration (OR = 0.096; 95% CI, 0.014–0.661; p = 0.017) and pre-pregnancy BMI (OR = 1.089; 95% CI, 1.001–1.185; p = 0.048) were significantly associated factors for 2/3-AV GDM.
Table 4
Clinical factors associated with 2/3-AV GDM prevalence in total GDM women
|
OR |
95% CI |
p-value |
| TB (mg/dL) |
0.096 |
0.014–0.661 |
0.017 |
| Blood sampling timing (GW) |
1.031 |
0.988–1.077 |
0.163 |
| Age (years) |
1.031 |
0.973–1.092 |
0.306 |
| Pre-pregnancy BMI (kg/m2) |
1.089 |
1.001–1.185 |
0.048 |
Family history of diabetes
(yes = 1, no = 0) |
1.439 |
0.690–3.004 |
0.332 |
Abbreviations: GDM, gestational diabetes; TB, total bilirubin; GW, gestational week; BMI, body mass index; OR, odds ratio; CI, confidence interval
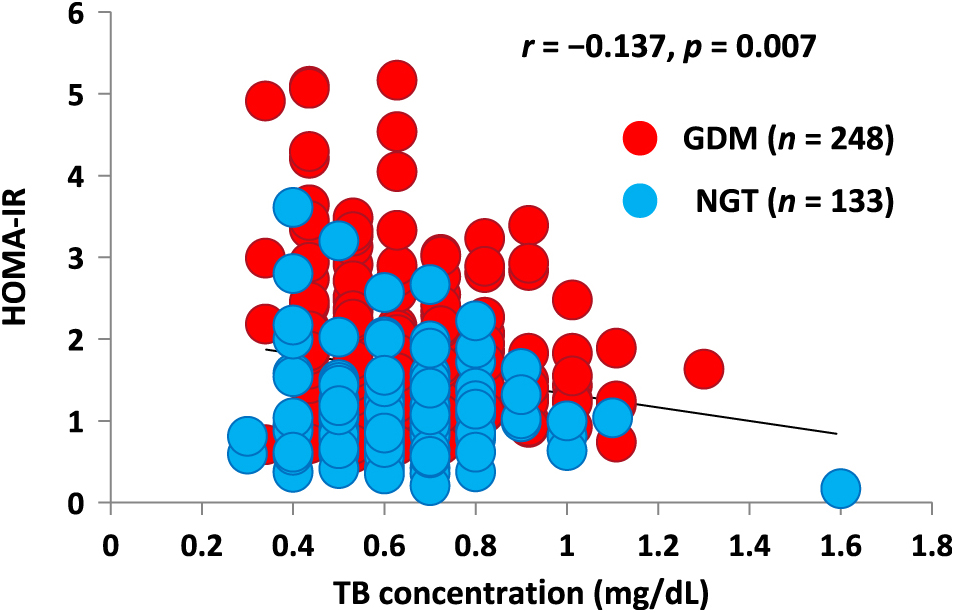
For further investigation of HOMA-IR, we focused on the above-mentioned 381 pregnant women (133 NGT and 248 GDM) who underwent 75-g OGTT. In these pregnant women, an inverse correlation was observed between TB concentration and HOMA-IR (r = –0.137, p = 0.007), as shown in Fig. 4.
In order to find associated factors for HOMA-IR, multiple linear regression analysis including these 381 pregnant women was performed. As shown in Table 5, in the univariate analysis, systolic blood pressure (p < 0.001), pre-pregnancy BMI (p < 0.001), and TB concentration (p = 0.002) were demonstrated to be significantly associated factors to the HOMA-IR logarithm. In the multivariate analysis, systolic blood pressure (p = 0.033) and pre-pregnancy BMI (p < 0.001) remained significant, but TB concentration did not (p = 0.105).
Table 5
Associated factors for log(HOMA-IR)
|
|
Standardized β |
p-value |
| Univariate |
Age (years) |
–0.066 |
0.199 |
| Systolic blood pressure (mmHg) |
0.205 |
<0.001 |
| Pre-pregnancy BMI (kg/m2) |
0.441 |
<0.001 |
| log[blood sampling timing (GW)] |
–0.014 |
0.782 |
| TB (mg/dL) |
–0.16 |
0.002 |
| Cr (mg/dL) |
0.079 |
0.123 |
| AST (U/L) |
0.008 |
0.883 |
| ALT (U/L) |
0.08 |
0.122 |
| Multivariate |
Systolic blood pressure (mmHg) |
0.102 |
0.033 |
| Pre-pregnancy BMI (kg/m2) |
0.403 |
<0.001 |
| log[blood sampling timing (GW)] |
–0.036 |
0.438 |
| TB (mg/dL) |
–0.076 |
0.105 |
Abbreviations: HOMA-IR, homeostasis model assessment of insulin resistance; BMI, body mass index; GW, gestational week; TB, total bilirubin; Cr, creatinine; AST, aspartate aminotransferase; ALT, alanine aminotransferase
Discussion
The present study demonstrated that serum TB concentrations were lower in GDM women than in NGT women, and that pregnant women with lower TB concentrations showed higher GDM prevalence. In addition, it was shown that TB concentrations were lower in 2/3-AV GDM women than in 1-AV GDM women and that a low TB concentration was a significantly associated factor for 2/3-AV GDM prevalence.
Since oxidative stress plays an important role in the pathogenesis of type 2 diabetes [30], increased bilirubin might prevent the development of GDM by eliminating oxidative stress [31, 32]. Another explanation is that serum bilirubin plays a protective role against inflammation [14], which is an important mediator of type 2 diabetes. Several studies in animal models [33] and humans [20, 34-36] have pointed out that bilirubin levels are negatively associated with the incidence of type 2 diabetes.
Because we do not have any data on urinary bilirubin metabolites, we cannot elaborate on the cause of lower bilirubin levels in GDM. Heme-oxygenase (HO) is an enzyme that resolves heme into biliverdin and carbon monoxide, and then biliverdin is reduced to bilirubin by biliverdin reductase. It is reported that HO-1, one of the isozymes of HO, is decreased in GDM women compared with NGT women [37]. Therefore, the low TB concentrations in the GDM women in our study might be explained by the decreased production of bilirubin.
In this study, TB concentrations in 2/3-AV GDM women were lower than those in 1-AV GDM women. In addition, TB concentration was an independently associated factor for 2/3-AV GDM, but not for total GDM. It was reported that 2/3-AV GDM women needed insulin therapy more frequently than 1-AV GDM women during pregnancy, which meant that hyperglycemia was more prominent in 2/3-AV than in 1-AV GDM [38]. It was reported that chronic hyperglycemia in a rat model resulted in decreased HO-1 gene expression in islet cells [39]. Decreased HO-1 production might explain the difference in TB concentration between 1- and 2/3- AV GDM.
In this study, although there was no difference in HOMA-β between women with GDM and those with NGT, the HOMA-IR was significantly higher in women with GDM than in those with NGT. Therefore, the increase in insulin resistance, rather than the decrease in insulin secretion ability, might play a greater role in the onset of GDM. We also found that TB concentration was inversely correlated with HOMA-IR. However, TB concentration was not selected as an independently associated factor for HOMA-IR in the multivariate analysis in our study. Instead, high blood pressure and high BMI were selected. These factors might have a stronger effect on insulin sensitivity than bilirubin.
There are several reports using animal models that suggest the possibility that bilirubin alleviates insulin resistance. Liu et al. reported that body weight decreased, and insulin sensitivity and glucose tolerance increased when bilirubin was administered to diet-induced obesity mice [40]. In this study, bilirubin administration decreased leptin and increased adiponectin levels, and mRNA expression of PPARγ and SREBP-1. Dong et al. reported that insulin resistance was improved when bilirubin was administered to leptin-receptor-deficient (db/db) mice without changing body weight [41]. Although such agents that increase serum bilirubin concentration safely may be beneficial to not only pregnant women but also type 2 diabetes patients, agents which aim to elevate bilirubin concentration are not currently available on the market. It is reported that the administration of Atazanavir, which is an HIV-1 protease inhibitor and licensed for the treatment of HIV infection, increased TB concentration and improved endothelial function of type 2 diabetics [42].
There are some limitations to this study. First, we used only a single blood sample for measurement of the TB concentration, and plasma bilirubin concentrations are known to exhibit substantial variability within subjects [43]. Second, the bilirubin level may fluctuate during pregnancy, although there is no consensus about this fluctuation [21-23]. The correlation coefficients between a gestational week and TB level in NGT and GDM women were 0.214 and 0.203, respectively (Fig. 1), and these coefficients were not high enough to draw any biological meaning in the pathophysiology of GDM. This may be due to the wide distribution of serum TB levels. Third, total bilirubin concentration was measured primarily in case of Caesarian section, induced delivery, or ritodrine use in both NGT and GDM women, which might affect our findings. However, because our control was at least normal in the perspective of glucose tolerance and women with liver failure had been excluded from the study, we believe that this did not change our results dramatically. Finally, the cross-sectional study design, with a relatively small number of subjects, cannot establish causality between bilirubin levels and GDM. Because of this small sample size, we could not analyze our data according to the number of deliveries (parity). We had to exclude prior GDM and history of macrosomia, both of which are known risk factors for GDM, from the explanatory variables of the multivariate analysis.
In conclusion, it was shown that low TB concentration might be associated with high prevalence of GDM in Japanese pregnant women. Although high BMI is an established risk factor for GDM through insulin resistance, hypobilirubinemia may also be involved in the pathogenesis of GDM.
Disclosures
All the authors have nothing to declare.
References
- 1 O’Sullivan JB (1991) Diabetes mellitus after GDM. Diabetes 40 Suppl 2: 131–135.
- 2 Bellamy L, Casas JP, Hingorani AD, Williams D (2009) Type 2 diabetes mellitus after gestational diabetes: a systematic review and meta-analysis. Lancet 373: 1773–1779.
- 3 Holt RI, Coleman MA, McCance DR (2011) The implications of the new International Association of Diabetes and Pregnancy Study Groups (IADPSG) diagnostic criteria for gestational diabetes. Diabet Med 28: 382–385.
- 4 Pirjani R, Shirzad N, Qorbani M, Phelpheli M, Nasli-Esfahani E, et al. (2017) Gestational diabetes mellitus its association with obesity: a prospective cohort study. Eat Weight Disord 22: 445–450.
- 5 Chu SY, Callaghan WM, Kim SY, Schmid CH, Lau J, et al. (2007) Maternal obesity and risk of gestational diabetes mellitus. Diabetes Care 30: 2070–2076.
- 6 Abdel Gader AG, Khashoggi TY, Habib F, Awadallah SB (2011) Haemostatic and cytokine changes in gestational diabetes mellitus. Gynecol Endocrinol 27: 356–360.
- 7 Ma SG, Yu WN, Jin Y, Hong B, Hu W (2012) Evaluation of serum ischemia-modified albumin levels in pregnant women with and without gestational diabetes mellitus. Gynecol Endocrinol 28: 837–840.
- 8 Zhu C, Yang H, Geng Q, Ma Q, Long Y, et al. (2015) Association of oxidative stress biomarkers with gestational diabetes mellitus in pregnant women: a case-control study. PLoS One 10: e0126490.
- 9 Angueira AR, Ludvik AE, Reddy TE, Wicksteed B, Lowe WL Jr, et al. (2015) New insights into gestational glucose metabolism: lessons learned from 21st century approaches. Diabetes 64: 327–334.
- 10 Saisho Y, Miyakoshi K, Tanaka M, Shimada A, Ikenoue S, et al. (2010) Beta cell dysfunction and its clinical significance in gestational diabetes. Endocr J 57: 973–980.
- 11 Saisho Y, Miyakoshi K, Ikenoue S, Kasuga Y, Matsumoto T, et al. (2013) Marked decline in beta cell function during pregnancy leads to the development of glucose intolerance in Japanese women. Endocr J 60: 533–539.
- 12 Sedlak TW, Saleh M, Higginson DS, Paul BD, Juluri KR, et al. (2009) Bilirubin and glutathione have complementary antioxidant and cytoprotective roles. Proc Natl Acad Sci U S A 106: 5171–5176.
- 13 McArdle PF, Whitcomb BW, Tanner K, Mitchell BD, Shuldiner AR, et al. (2012) Association between bilirubin and cardiovascular disease risk factors: using Mendelian randomization to assess causal inference. BMC Cardiovasc Disord 12: 16.
- 14 Mazzone GL, Rigato I, Ostrow JD, Bossi F, Bortoluzzi A, et al. (2009) Bilirubin inhibits the TNF alpha-related induction of three endothelial adhesion molecules. Biochem Biophys Res Commun 386: 338–344.
- 15 Nishimura T, Tanaka M, Sekioka R, Itoh H (2015) Serum bilirubin concentration is associated with eGFR and urinary albumin excretion in patients with type 1 diabetes mellitus. J Diabetes Complications 29: 1223–1227.
- 16 Sekioka R, Tanaka M, Nishimura T, Itoh H (2015) Low serum total bilirubin concentration in patients with type 1 diabetes mellitus complicated by retinopathy and nephropathy. Diabetol Int 6: 300–305.
- 17 Inoguchi T, Sasaki S, Kobayashi K, Takayanagi R, Yamada T (2007) Relationship between Gilbert syndrome and prevalence of vascular complications in patients with diabetes. JAMA 298: 1398–1400.
- 18 Sekioka R, Tanaka M, Nishimura T, Itoh H (2015) Serum total bilirubin concentration is negatively associated with increasing severity of retinopathy in patients with type 2 diabetes mellitus. J Diabetes Complications 29: 218–221.
- 19 Lin LY, Kuo HK, Hwang JJ, Lai LP, Chiang FT, et al. (2009) Serum bilirubin is inversely associated with insulin resistance and metabolic syndrome among children and adolescents. Atherosclerosis 203: 563–568.
- 20 Abbasi A, Deetman PE, Corpeleijn E, Gansevoort RT, Gans RO, et al. (2015) Bilirubin as a potential causal factor in type 2 diabetes risk: a Mendelian randomization study. Diabetes 64: 1459–1469.
- 21 Liu C, Zhong C, Zhou X, Chen R, Wu J, et al. (2017) Higher direct bilirubin levels during mid-pregnancy are associated with lower risk of gestational diabetes mellitus. Endocrine 55: 165–172.
- 22 Liu H, Shao-Gang M, Liang C, Feng B, Wei X (2015) Surrogate markers of the kidney and liver in the assessment of gestational diabetes mellitus and fetal outcome. J Clin Diagn Res 9: OC14–OC17.
- 23 Khosrowbeygi A, Shiamizadeh N, Taghizadeh N (2016) Maternal circulating levels of some metabolic syndrome biomarkers in gestational diabetes mellitus. Endocrine 51: 245–255.
- 24 Kjos SL, Buchanan TA (1999) Gestational diabetes mellitus. N Engl J Med 341: 1749–1756.
- 25 Minakami H, Hiramatsu Y, Koresawa M, Fujii T, Hamada H, et al. (2011) Guidelines for obstetrical practice in Japan: Japan Society of Obstetrics and Gynecology (JSOG) and Japan Association of Obstetricians and Gynecologists (JAOG) 2011 edition. J Obstet Gynaecol Res 37: 1174–1197.
- 26 Metzger BE, Coustan DR (1998) Summary and recommendations of the Fourth International Workshop-Conference on Gestational Diabetes Mellitus. The Organizing Committee. Diabetes Care 21 (Suppl 2): B161–B167.
- 27 van Leeuwen M, Louwerse MD, Opmeer BC, Limpens J, Serlie MJ, et al. (2012) Glucose challenge test for detecting gestational diabetes mellitus; a systematic review. BJOG 119: 393–401.
- 28 Matthews DR, Hosker JP, Rudenski AS, Naylor BA, Treacher DF, et al. (1985) Homeostasis model assessment: insulin resistance and beta-cell function from fasting plasma glucose and insulin concentrations in man. Diabetologia 28: 412–419.
- 29 Haffner SM, Miettinen H, Stern MP (1997) The homeostasis model in the San Antonio Heart Study. Diabetes Care 20: 1087–1092.
- 30 Ceriello A, Motz E (2004) Is oxidative stress the pathogenic mechanism underlying insulin resistance, diabetes, and cardiovascular disease? The common soil hypothesis revisited. Arterioscler Thromb Vasc Biol 24: 816–823.
- 31 Stocker R, Yamamoto Y, McDonagh AF, Glazer AN, Ames BN (1987) Bilirubin is an antioxidant of possible physiological importance. Science 235: 1043–1046.
- 32 Baranano DE, Rao M, Ferris CD, Snyder SH (2002) Biliverdin reductase: a major physiologic cytoprotectant. Proc Natl Acad Sci U S A 99: 16093–16098.
- 33 Ikeda N, Inoguchi T, Sonoda N, Fujii M, Takei R, et al. (2011) Biliverdin protects against the deterioration of glucose tolerance in db/db mice. Diabetologia 54: 2183–2191.
- 34 Wu Y, Li M, Xu M, Bi Y, Li X, et al. (2011) Low serum total bilirubin concentrations are associated with increased prevalence of metabolic syndrome in Chinese. J Diabetes 3: 217–224.
- 35 Jung CH, Lee MJ, Kang YM, Hwang JY, Jang JE, et al. (2014) Higher serum bilirubin level as a protective factor for the development of diabetes in healthy Korean men: a 4 year retrospective longitudinal study. Metabolism 63: 87–93.
- 36 Cheriyath P, Gorrepati VS, Peters I, Nookala V, Murphy ME, et al. (2010) High total bilirubin as a protective factor for diabetes mellitus: an analysis of NHANES data from 1999–2006. J Clin Med Res 2: 201–206.
- 37 Qiu C, Hevner K, Enquobahrie DA, Williams MA (2012) Maternal serum heme-oxygenase-1 (HO-1) concentrations in early pregnancy and subsequent risk of gestational diabetes mellitus. PLoS One 7: e48060.
- 38 Ikenoue S, Miyakoshi K, Saisho Y, Sakai K, Kasuga Y, et al. (2014) Clinical impact of women with gestational diabetes mellitus by the new consensus criteria: two year experience in a single institution in Japan. Endocr J 61: 353–358.
- 39 Laybutt DR, Glandt M, Xu G, Ahn YB, Trivedi N, et al. (2003) Critical reduction in β-cell mass results in two distinct outcomes over time. Adaptation with impaired glucose tolerance or decompensated diabetes. J Biol Chem 278: 2997–3005.
- 40 Liu J, Dong H, Zhang Y, Cao M, Song L, et al. (2015) Bilirubin increases insulin sensitivity by regulating cholesterol metabolism, adipokines and PPARγ levels. Sci Rep 5: 9886.
- 41 Dong H, Huang H, Yun X, Kim DS, Yue Y, et al. (2014) Bilirubin increases insulin sensitivity in leptin-receptor deficient and diet-induced obese mice through suppression of ER stress and chronic inflammation. Endocrinology 155: 818–828.
- 42 Dekker D, Dorresteijn MJ, Pijnenburg M, Heemskerk S, Rasing-Hoogveld A, et al. (2011) The bilirubin-increasing drug atazanavir improves endothelial function in patients with type 2 diabetes mellitus. Arterioscler Thromb Vasc Biol 31: 458–463.
- 43 Van Hoydonck PG, Schouten EG, Temme EH (2003) Reproducibility of blood markers of oxidative status and endothelial function in healthy individuals. Clin Chem 49: 963–965.