Abstract
Copy number variation (CNV) has emerged as another important genetic marker in addition to SNP for understanding etiology of complex disease. Kv channel interacting protein 1 (KCNIP1) is a Ca2+-dependent transcriptional modulator that contributes to the regulation of insulin secretion. Previous genome-wide CNV assay identified the KCNIP1 gene encompassing a CNV region, however, its further effect and risk rate on type 2 diabetes (T2D) have rarely been addressed, especially in Chinese population. The current study aims to detect and excavate genetic distribution profile of KCNIP1 CNV in Chinese T2D and control populations, and further to investigate the associations with clinical characteristics. Divergent patterns of the KCNIP1 CNV were identified (p < 0.01), in which the copy number gain was predominant in T2D, while the copy number normal accounted for the most in control group. Consistently, the individuals with copy number gain showed significant risk on T2D (OR = 4.550, p < 0.01). The KCNIP1 copy numbers presented significantly positive correlations with fasting plasma glucose and glycated hemoglobin in T2D. For OGTT test, the T2D patients with copy number gain had remarkably elevated glucose contents (60, 120, 180-min, p < 0.05 or p < 0.01) and diminished insulin levels (60, 120-min, p < 0.05) than those with copy number loss and normal, which suggested that the KCNIP1 CNV was correlated with the glucose and insulin action. This is the first CNV association study of the KCNIP1 gene in Chinese population, and these data indicated that KCNIP1 might function as a T2D-susceptibility gene whose dysregulation alters insulin production.
THE METABOLIC DIABETES has presented an increasing morbidity worldwide [1]. Among diabetic cases, 90% are classified as type 2 diabetes mellitus (T2D), which is characterized by chronic hyperglycemia and impaired insulin secretion [2]. T2D is a multifactorial disease caused by interaction between genetic and environmental factors. Several studies have attempted to identify the monogenic or polygenic polymorphisms to obtain more insight into T2D pathogenesis. It is expected that the discovery of the promising genetic variations can provide new therapeutic prevention and intervention for the T2D.
Genetic variations in human genome comprise of multiple types such as single nucleotide polymorphism (SNP), insertion/deletion (Indel) and structural alteration [3]. In recent years, single gene panels and genome-wide association studies (GWAS) have identified numerous monogenic and multiple genetic mutations, at least in part, responsible for abnormal gene function resulting in human disease [4, 5]. Previous studies revealed that the coding and regulatory SNPs or indels of many functional genes (KCNQ1, calpain-10, NEUROD1, MUTYH et al.) were significantly associated with T2D [6-9]. However, these variations, acrossing small segmental genome, can only explain a portion of the heritability for diabetes. Copy number variation (CNV) ranging from 1 kb to 5 Mb has been recognized as another important structural variant that may help to unravel the missing heritability of human genetic architecture [10]. In CNV region, gene dosage effect is the major regulatory mechanism to phenotype by changing gene structure, alternating gene expression and exposing recessive alleles [11]. Several studies have promulgated that some CNVs overlapping with functional genes, such as exon-deletion in the AKNA domain containing 1 gene (AKNAD1) and the copy variants in the T-cell receptor beta gene (TCRVB), as well as the variable E2 region of the leptin receptor gene (LEPR), were associated with diabetic insulin and cholesterol dysregulation [12-14].
Dysfunction of insulin secretion is generally characterized in T2D patients, and that is induced by regulatory disorders of intricate networks. Kv channel interacting protein 1 gene (KCNIP1), a member of KCNIP family, plays crucial roles in modulating insulin secretion of pancreatic β cells at a Ca2+-dependent manner by binding to a specific downstream regulatory element site [15]. Lee et al. investigated that KCNIP1 knockdown antagonized β-cell repolarization and facilitated insulin secretion in a glucose-dependent pattern [16]. In addition, genome-wide CNV screening in human genome has identified KCNIP1 encompassing a CNV region [16], which was also found in the database of genomic variants. Considering the insulin regulatory functions, we hypothesized that KCNIP1 CNV may be a promising marker for assessing the susceptibility to T2D, and further could be used for T2D diagnosis and therapy.
In this study, we performed a case-control model to detect the genotypic distribution of KCNIP1 CNV and to investigate the associations of KCNIP1 CNV with clinical traits in the Chinese T2D and healthy individuals. Our study based on the perspective of clinical data could be an important supplement to the previous genome-wide CNV assay, and provide more insight into the clinical application of causative CNV locus.
Material and Methods
Ethics statement
This study was approved by the Tianyou Hospital ethical committee of Wuhan University of Science and Technology; and the methods were carried out in accordance with the approved guidelines. We obtained written informed consent from all the study participants.
Study subjects
A total number of 126 unrelated individuals with T2D (79 males and 47 females; age: 59.75 ± 12.87) as cases from the affiliated Tianyou Hospital of Wuhan University of Science and Technology, and 100 controls (54 males and 46 females; age: 51.95 ± 7.87) from the Hospital of Wuhan University were enrolled in this study from May 2015 to December 2015. All subjects were recruited on a rigorous set of criteria. For cases clinically diagnosed T2D patients as defined by world health organization (WHO) criteria when the venous plasma glucose concentration was ≥200 mg/dL 2 h after a 75 g oral glucose load, the fasting plasma glucose was ≥126 mg/dL [17]. Patients with other morbidities such as malnutrition, pancreatitis, anemia and malignant cancer were excluded from the study. For controls (i) fasting glucose <126 mg/dL and glycated hemoglobin <6.0% (ii) no history of diabetes or other autoimmune disease in the degree relatives, (iii) no hypertension. All cases and controls were belonging to Chinese ethnicity. There was no bias in geographic distribution of cases and controls. Blood samples of all subjects were collected and genomic DNA was extracted by phenol-chloroform extraction.
Phenotype confirmation
The clinical parameters of all subjects were collected and shown in Supplementary Table 1. Anthropometric variables including height and weight were measured. Biochemical indexes including fasting plasma glucose, levels of glycated hemoglobin, total cholesterol, triglycerides, low density lipoprotein cholesterol and high density lipoprotein cholesterol were detected using Hitachi 912 auto-analyzer (Roche, Basel, Switzerland) according to manufacturer’s instructions. In addition, the aforementioned T2D patients were adjusted diet for maintaining weight about 3 days before an oral glucose tolerance test (OGTT). For the OGTT, the patients underwent an overnight fast and then ingested 75 g glucose; blood was drawn before ingesting the glucose and at 60, 120, and 180 min, respectively. Plasma glucose concentrations were measured by the glucose oxidase-peroxidase method using commercial kits (Shanghai Biological Products Institution, Shanghai, China). Insulin levels were measured by radioimmunoassay (Linco Research, St Charles, MO, USA).
Copy numbers of the KCNIP1 gene analysis
Copy number variations of the KCNIP1 gene have been detected in a previous genome-wide association study [16]. In this study, the KCNIP1 CNV distributions were confirmed and detected between T2D patients and healthy individuals using genomic quantitative PCR (qPCR). The qPCR primer pairs were designed to target the KCNIP1 CNV regions by Primer v5.0 software (PREMIER Biosoft International, California, USA). The CNV location and primer information were shown in Fig. 1 and Table 1, respectively. The primers designed in silico were validated by melting curve analysis and no-template control reactions. Efficiency of amplification for each primer set was measured with different dilutions of genomic DNA (0.005 ng, 0.05 ng, 0.5 ng, 5 ng, 50 ng, 500 ng). The values of correlation coefficient (r2) of the primers KCNIP1-CNV1, CNV2, CNV3, CNV4, and RNaseP were 0.991, 0.959, 0.997, 0.988, 0.967, respectively, whereas the slopes were –3.367, –3.205, –3.674, –3.863, –3.308, respectively, indicating high PCR amplification efficiencies. Genomic qPCR experiments were conducted using SYBR green chemistry in triplicate reactions, each with a reaction volume of 20 μL containing 100 ng of genomic DNA, 10 μL SYBR® Premix Ex Taq TM II (TaKaRa, Japan), and 10 pmol of primers. Thermal-cycling conditions were as follows: 95°C for 30 s followed by 40 cycles at 95°C for 10 s, 60°C for 10 s and 68°C for 20 s.

Table 1
Primer pairs designed for the genes used in this study
| Locus |
Chromosome |
Primer name |
Primer sequences (5' to 3') |
Amplification length (bp) |
| KCNIP1-CNV1 |
5q35.1 |
KCNIP1-CNV1-F |
GACTAGGCTGCACAGAAGGA |
105 |
| KCNIP1-CNV1-R |
ATCTGAAGGCATGGGCTGAT |
| KCNIP1-CNV2 |
5q35.1 |
KCNIP1-CNV2-F |
TCCCACCCCGAGATTCCAT |
101 |
| KCNIP1-CNV2-R |
GGTCCATTGCACGGGAACTT |
| KCNIP1-CNV3 |
5q35.1 |
KCNIP1-CNV3-F |
AATATGACACGGCCACGCTT |
101 |
| KCNIP1-CNV3-R |
TGTCTCTTGGGTCCATCCCT |
| KCNIP1-CNV4 |
5q35.1 |
KCNIP1-CNV4-F |
CACATGGAATGAGACTGTCC |
100 |
| KCNIP1-CNV4-R |
TTCTGACCATTCTGGCCCAA |
| RNaseP |
10q23.31 |
RNaseP-F |
TCTCTCGTGTACCCTCCCAG |
122 |
| RNaseP-R |
TTGCCAGTGCTGATGTCTCA |
For qPCR analysis, the human RNase P was chosen as the diploid internal control gene, and the copy number was calculated as the ratio of the template quantity for KCNIP1 to the template quantity for RNase P, rounded to the integer and multiplied by two. Because we assumed that there were two copies of the target segment in the calibrator individual. Similar to the CNV identifying in genome sequencing assay, the copy number types (gain, loss, normal) of the KCNIP1 in the present study were calculated based on the log2 2–ΔΔCt relative to the control sample. Differences in genotypic frequencies of KCNIP1 CNV between T2D patients and controls were analyzed by SPSS software (version 20.0, Illinois, USA). The correlation of KCNIP1 copy numbers and fasting plasma glucose or levels of glycated hemoglobin levels were analyzed using the R 2.15.0 software.
Association pattern of the KCNIP1 copy number variation
The relative copy number of KCNIP1 was fitted as a continuous variable. SPSS software (version 20.0, Illinois, USA) was used to analyze the associations of KCNIP1 CNV with clinical traits in T2D patients and non-diabetic individuals by the linear regression model, and the continuous variables were adjusted for covariate variables of age and gender where appropriate.
Statistical analysis
All data were expressed as mean value ± standard error of duplicates. Statistical significance of the copy number differences of the KCNIP1 gene between the T2D patients and the control subjects were tested by the two-sided Student’s t-test. Calculations were performed with STATA Statistical Software (version 10.0; StataCorp, College Station, TX, USA) or SPSS software (version 20.0, Illinois, USA). A p-value of <0.05 was considered statistically significant.
Results
KCNIP1 CNV detection and evaluation in the Chinese population
According to the whole genome CNV assay, a significant CNV locus was detected at chr5q35.1: 170062275-170064128 in human genome, and this CNV was annotated overlapping with the functional KCNIP1 gene [16]. In addition, another three CNV regions (chr5q35.1: 169944296-169945408, 170026297-170026980, 170158411-170159380) spanning on the KCNIP1 gene sequence were identified in the database of genomic variations (Fig. 1), and the CNV genotypes were classified as deletion, normal and duplication depends on the reference sample. In this study, the KCNIP1 CNV was firstly detected and evaluated in the Chinese population (T2D and control cases). In general chip and whole genome sequencing assay, log2 ratio of the test sample versus reference sample was used to determine a CNV when the value is greater than | ±0.5 | [18]. Similarly, log2 2–ΔΔCt value in qPCR analysis was performed to identify CNV types of the KCNIP1 gene, and three individuals from respective T2D (T1, T2, T3) and control (C1, C2, C3) groups were used for CNV validation. Primer pairs designed from four CNV regions and reference gene were shown in Table 1. As shown in Supplementary Fig. 1, the KCNIP1 gene was genotyped as CNV gain (log2 ratio > 0.5) in four CNV regions for all three T2D individuals, and the log2 ratio of the CNV3 showed higher values than the other three CNV regions in T2D group. In addition, the CNV3 (1,854 bp) spanned more DNA sequences than CNV1 (1,113 bp), CNV2 (684 bp), and CNV4 (970 bp), suggesting that CNV3 of the KCNIP1 gene may play more functional roles in the T2D susceptibility. Thus, the KCNIP1-CNV3 was used to evaluate the association with T2D in our subsequent study.
Copy number distributions of the KCNIP1 gene in T2D and control individuals
Genotypic distribution of copy number variation in different populations can reflect the evolutionary selection and varietal characteristics. Thus, we tested the copy number differences of the KCNIP1 gene between T2D patients and non-diabetic control subjects. In our study, the CNV genotypes were classified as gain (>0.5), loss (<–0.5) and normal (< | ±0.5 |) based on the log2 2–ΔΔCt values. As shown in Fig. 2A and 2B, the KCNIP1 copy number presented nonuniform distribution patterns that the copy number gain was predominant than loss and normal in T2D cases, while the copy number normal accounted for most in the control group. Further Chi-square test revealed that the copy number distribution has remarkably reached a significant level between the two genotypic sets (p < 0.01) (Table 2). Fig. 2C displayed the copy number differences of KCNIP1 gene that ranged from 0 to 16 per diploid genome in T2D, however, the copy number was less than 4 in the control individuals. Additionally, the copy number gain (>2) possessed a percentage of 33% among all healthy controls, while the value climbed up to 82.6% in T2D patients than copy number loss and normal (Fig. 2D). These suggested that the biological effect of KCNIP1 CNV may be highly variable between the two populations.

Table 2
Association of the
KCNIP1 CNV with the risk of type 2 diabetes
| CNV type |
T2D (n) |
Control (n) |
p-valueb |
Odds ratio |
95% CI |
| Loss (CN < 2 copies) |
10 |
12 |
|
1 |
|
| Gain (CN > 2 copies) |
91 |
24 |
<0.01 |
4.550 |
2.194–6.987 |
| Normal (CN = 2 copies) |
25 |
64 |
0.922 |
0.469 |
0.299–2.981 |
| p-valuea |
**p < 0.01 |
|
|
|
CN represented copy number of the KCNIP1 gene.
a p value was assessed by Yates’ correction of Chi-square test.
b p value reflected the risk of T2D, and the value was assessed by Chi-square test or Fisher’s exact test.
To expand our understanding of the biological function of the KCNIP1 CNV, we further conducted the phenotypic association network analysis. Fasting plasma glucose and glycated hemoglobin, in general used directly, are direct indicators of clinical diabetes diagnosis. Here we established the correlation analysis between KCNIP1 copy numbers and the characteristic data in T2D and control individuals (Fig. 3). For T2D cases, the copy number ranged from 2 to 13 copies, and showed significantly positive relations with the fasting plasma glucose (r2 = 0.3872, p < 0.01) and glycated hemoglobin (r2 = 0.0511, p = 0.01). However, the correlation of the fasting plasma glucose data with the KCNIP1 CNV has not reached a significant level in non-diabetic control subjects (p > 0.05, Supplementary Fig. 2).

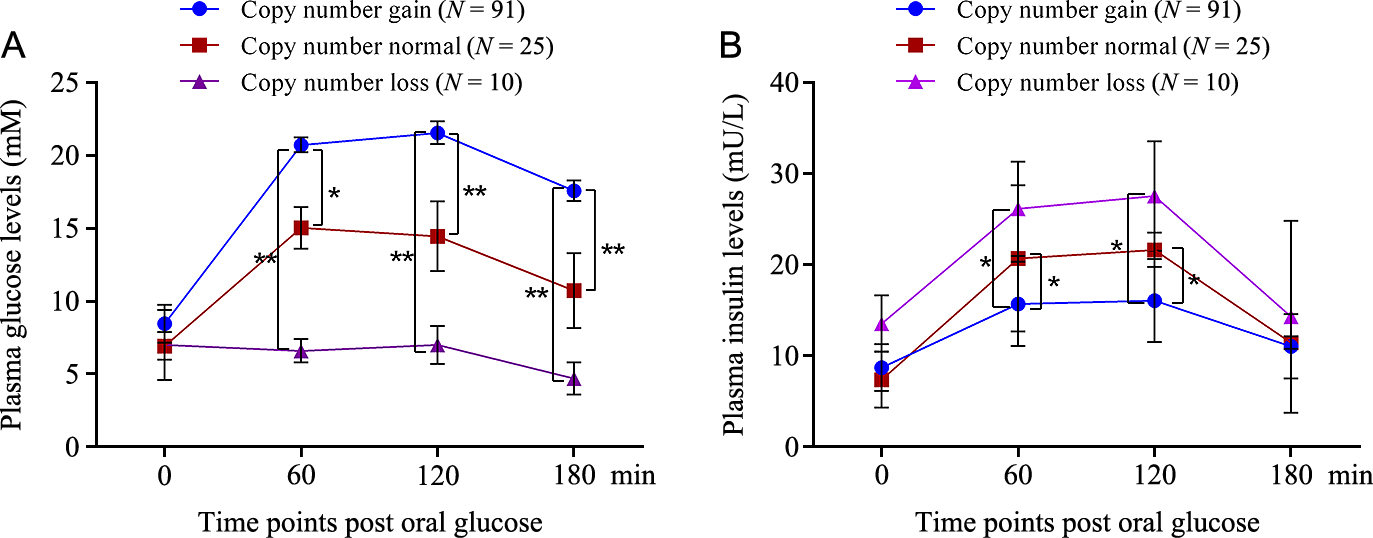
The plasma glucose content was affected by the genetic variability, thus we assumed that the insulin secretion may be also associated with the KCNIP1 copy number differences. To test the hypothesis, we performed the association analysis in all T2D and healthy control individuals by One-way ANOVA method. In the statistical model, the copy number of the three types (gain, loss, normal) was respectively designated as ≥3, <2 and 2 copies. Overall, the KCNIP1 CNV yielded modestly associated with insulin and glucose level during an OGTT test (Fig. 4). Among all T2D patients with glucose tolerance assay, the ones with copy number gain had significantly higher plasma glucose levels than copy number loss at 60-min (p < 0.01), 120-min (p < 0.01), and 180-min (p < 0.01) and copy number normal at 60-min (p < 0.05) 120-min (p < 0.01), and 180-min (p < 0.01) time points, while the reduced plasma insulin of the individuals with copy number gain resulted response of elevated plasma glucose levels, and reached remarkable significance at 60-min (p < 0.05) and 120-min (p < 0.05) as compared to another two genotypes. In addition, no significant associations were observed between the KCNIP1 CNV and other clinical characteristics (total cholesterol, triglycerides, low density lipoprotein cholesterol and high density lipoprotein cholesterol) in T2D patients and healthy controls (p > 0.05, Supplementary Table 2 and Supplementary Table 3), however, we found a tendency that the individuals with copy number gain had higher values than loss and normal in T2D cases.
Discussion
The diabetes mellitus is thought to be polygenic endocrine disease. Compelling evidence has revealed that genetic variability contributes to the pathogenesis of disease progression and shares hereditary properties among the same ethnic populations [19, 20]. The genomic structural CNV has been proposed as a critical source of missing heritability complementary to SNP [3, 21, 22]. In human, the CNV loci affect gene sequence leading to pathological variability by altering the dosage of susceptible genes located in CNV region [23]. In recent years, CNV libraries have been systematically excavated at a genomic level in human [24-26], in which the KCNIP1 gene, involved in insulin function, was detected in CNV region by genome-wide alteration detection analysis [16]. However, previous studies have not elucidated whether the KCNIP1 CNV possesses a causative allele that potentially affects the susceptibility to T2D. In this study, we firstly conducted the CNV association analysis of the KCNIP1 gene with clinical T2D indicators in Chinese population.
Determination of the causative risk loci for human disease, at least in part, is dependent on the genotypic distribution specificity between patients and healthy populations [27, 28]. Yim et al. [29] revealed that the proportion of the individuals with <2 copies of the VPREB1 gene was significantly higher in patient group than controls, leading to different susceptibility to rheumatoid arthritis. On the contrary, non-significant difference of the CAPN10 CNV distribution has been found in Thais T2D and non-diabetic subjects [30]. Moreover, CNV loci of some functional genes were considered to be promising markers for diagnosing disease [31, 32]. In the current study, we investigated the copy number gain of the KCNIP1 gene account for the most in Chinese T2D comparing to healthy controls, in which the log ratio model and the reference gene RNase P were used to confirm the copy number as described by Lee et al. [33]. This result may be generalizable and could suggest that, for T2D risk, the individuals with additional copies could result in increased or modified the disease incidence.
Copy number variation has important effects on gene transcription and translation, which usually results in dysfunction of protein products, even though coding sequence skipping can occur, ultimately leading to phenotypic variability [34, 35]. CNV in the first two exons of LEPR gene had a significantly negative correlation with T2D susceptibility [12]. In this study, the CNV locus was located in the first intron of the KCNIP1 gene. Previous studies reported that the first intron may affect the mRNA stability and RNA splicing, which could significantly alter the gene function, and change cellular response to specific targets [36, 37]. The further analyses did show marked positive associations of risk copy numbers in the KCNIP1 gene with attenuated insulin and accelerated glucose level, which is consistent with the physiological role of the KCNIP1 gene in adjusting insulin secretion [38]. KCNIP1 is highly expressed in pancreatic cells, and KCNIP1 knockdown have a detrimental loss of insulin action [39]. However, the exact functional mechanism of the KCNIP1 CNV on gene expression and the regulatory mechanism of the KCNIP1 CNV on T2D pathogenesis require further research in the future. In addition, the three loci did not affect other characteristics, such as total cholesterol, triglycerides, low density lipoprotein cholesterol and high density lipoprotein cholesterol, which corresponded with the effect analysis of the CAPN10 gene on T2D [30, 40]. This finding has a possible interpretation that KCNIP1 may not be the major regulator among the key gene networks in signaling pathway (e.g. ERK1/2) for steroidal synthesis [41].
In conclusion, this study was the first time to detect the KCNIP1 CNV in Chinese population, and investigate the association of the KCNIP1 CNV with T2D susceptibility. Copy number distribution of the KCNIP1 gene displayed significant deviation between the T2D and healthy individuals. Positive correlations of the KCNIP1 CNV with fasting plasma glucose and glycated hemoglobin were identified in T2D due to its fundamental role in insulin secretion. Consistently, copy number gain was associated with higher glucose content and lower plasma insulin level than copy number loss and normal in an OGTT assay. These experimental evidences suggested that the copy number gain of the KCNIP1 gene may be the risk allele for susceptibility to T2D, and the locus may be considered as a new promising molecular marker for T2D therapy. The statistical power of this research may be validated using larger sample size, and biological functional analysis are also needed to further examine the role of the KCNIP1 CNV in pathogenetic mechanism of T2D.
Acknowledgements
This study was supported by the National Natural Science Foundation of China (Grant No. 31600617, 31570764), Natural Science Foundation of Hubei Province (2016CFB171), Foundation of Wuhan University of Science and Technology (2016xz036).
Disclosure
None of the authors have any potential conflicts of interest associated with this research.
Reference
- 1 Shaw JE, Sicree RA, Zimmet PZ (2010) Global estimates of the prevalence of diabetes for 2010 and 2030. Diabetes Res Clin Pract 87: 4–14.
- 2 Yoon JW, Jun HS (2005) Autoimmune destruction of pancreatic beta cells. Am J Ther 12: 580–591.
- 3 Redon R, Ishikawa S, Fitch KR, Feuk L, Perry GH, et al. (2006) Global variation in copy number in the human genome. Nature 444: 444–454.
- 4 Abecasis GR, Altshuler D, Auton A, Brooks LD, Durbin RM, et al. (2010) A map of human genome variation from population-scale sequencing. Nature 467: 1061–1073.
- 5 Teng DH, Chen Y, Lian L, Ha PC, Tavtigian SV, et al. (2001) Mutation analyses of 268 candidate genes in human tumor cell lines. Genomics 74: 352–364.
- 6 Malecki MT, Jhala US, Antonellis A, Fields L, Doria A, et al. (1999) Mutations in NEUROD1 are associated with the development of type 2 diabetes mellitus. Nat Genet 23: 323–328.
- 7 Hanson RL, Guo T, Muller YL, Fleming J, Knowler WC, et al. (2013) Strong parent-of-origin effects in the association of KCNQ1 variants with type 2 diabetes in American Indians. Diabetes 62: 2984–2991.
- 8 Horikawa Y, Oda N, Cox NJ, Li X, Orho-Melander M, et al. (2000) Genetic variation in the gene encoding calpain-10 is associated with type 2 diabetes mellitus. Nat Genet 26: 163–175.
- 9 Guo W, Zheng B, Guo D, Cai Z, Wang Y (2015) Association of AluYb8 insertion/deletion polymorphism in the MUTYH gene with mtDNA maintain in the type 2 diabetes mellitus patients. Mol Cell Endocrinol 409: 33–40.
- 10 Eichler EE, Flint J, Gibson G, Kong A, Leal SM, et al. (2010) Missing heritability and strategies for finding the underlying causes of complex disease. Nat Rev Genet 11: 446–450.
- 11 Henrichsen CN, Chaignat E, Reymond A (2009) Copy number variants, diseases and gene expression. Hum Mol Genet 18: R1–R8.
- 12 Jeon JP, Shim SM, Nam HY, Ryu GM, Hong EJ, et al. (2010) Copy number variation at leptin receptor gene locus associated with metabolic traits and the risk of type 2 diabetes mellitus. BMC Genomics 11: 426.
- 13 Irvin MR, Wineinger NE, Rice TK, Pajewski NM, Kabagambe EK, et al. (2011) Genome-wide detection of allele specific copy number variation associated with insulin resistance in African Americans from the HyperGEN study. PLoS One 6: e24052.
- 14 Dajani R, Li J, Wei Z, Glessner JT, Chang X, et al. (2015) CNV analysis associates AKNAD1 with type-2 diabetes in Jordan subpopulations. Sci Rep 5: 13391.
- 15 Neant I, Mellstrom B, Gonzalez P, Naranjo JR, Moreau M, et al. (2015) Kcnip1 a Ca(2)(+)-dependent transcriptional repressor regulates the size of the neural plate in Xenopus. Biochim Biophys Acta 1853: 2077–2085.
- 16 Lee HS, Moon S, Yun JH, Lee M, Hwang MY, et al. (2014) Genome-wide copy number variation study reveals KCNIP1 as a modulator of insulin secretion. Genomics 104: 113–120.
- 17 American Diabetes Association (2009) Diagnosis and classification of diabetes mellitus. Diabetes Care 32: S62–S67.
- 18 Conrad DF, Pinto D, Redon R, Feuk L, Gokcumen O, et al. (2010) Origins and functional impact of copy number variation in the human genome. Nature 464: 704–712.
- 19 Babey M, Kopp P, Robertson GL (2011) Familial forms of diabetes insipidus: clinical and molecular characteristics. Nat Rev Endocrinol 7: 701–714.
- 20 Garcia Castano A, Perez de Nanclares G, Madariaga L, Aguirre M, Chocron S, et al. (2015) Novel mutations associated with nephrogenic diabetes insipidus. A clinical-genetic study. Eur J Pediatr 174: 1373–1385.
- 21 McCarroll SA, Kuruvilla FG, Korn JM, Cawley S, Nemesh J, et al. (2008) Integrated detection and population-genetic analysis of SNPs and copy number variation. Nat Genet 40: 1166–1174.
- 22 Cooper NJ, Shtir CJ, Smyth DJ, Guo H, Swafford AD, et al. (2015) Detection and correction of artefacts in estimation of rare copy number variants and analysis of rare deletions in type 1 diabetes. Hum Mol Genet 24: 1774–1790.
- 23 Henrichsen CN, Vinckenbosch N, Zollner S, Chaignat E, Pradervand S, et al. (2009) Segmental copy number variation shapes tissue transcriptomes. Nat Genet 41: 424–429.
- 24 Makino T, McLysaght A, Kawata M (2013) Genome-wide deserts for copy number variation in vertebrates. Nat Commun 4: 2283.
- 25 Cleynen I, Konings P, Robberecht C, Laukens D, Amininejad L, et al. (2016) Genome-wide copy number variation scan identifies complement component C4 as novel susceptibility gene for Crohn’s disease. Inflamm Bowel Dis 22: 505–515.
- 26 Saadati HR, Wittig M, Helbig I, Hasler R, Anderson CA, et al. (2016) Genome-wide rare copy number variation screening in ulcerative colitis identifies potential susceptibility loci. BMC Med Genet 17: 26.
- 27 Cantsilieris S, Western PS, Baird PN, White SJ (2014) Technical considerations for genotyping multi-allelic copy number variation (CNV), in regions of segmental duplication. BMC Genomics 15: 329.
- 28 Usher CL, McCarroll SA (2015) Complex and multi-allelic copy number variation in human disease. Brief Funct Genomics 14: 329–338.
- 29 Yim SH, Chung YJ, Jin EH, Shim SC, Kim JY, et al. (2011) The potential role of VPREB1 gene copy number variation in susceptibility to rheumatoid arthritis. Mol Immunol 48: 1338–1343.
- 30 Plengvidhya N, Chanprasert K, Tangjittipokin W, Thongnoppakhun W, Yenchitsomanus PT (2012) Identification of copy number variation of CAPN10 in Thais with type 2 diabetes by multiplex PCR and denaturing high performance liquid chromatography (DHPLC). Gene 506: 383–386.
- 31 Laitinen VH, Akinrinade O, Rantapero T, Tammela TL, Wahlfors T, et al. (2016) Germline copy number variation analysis in Finnish families with hereditary prostate cancer. Prostate 76: 316–324.
- 32 Ruchi R, Genovese G, Lee J, Charoonratana VT, Bernhardy AJ, et al. (2015) Copy number variation at the APOL1 locus. PLoS One 10: e0125410.
- 33 Lee H, Bae S, Choi BW, Choi JC, Yoon Y (2011) Copy number variation of CCL3L1 influences asthma risk by modulating IL-10 expression. Clin Chim Acta 412: 2100–2104.
- 34 Perry GH, Dominy NJ, Claw KG, Lee AS, Fiegler H, et al. (2007) Diet and the evolution of human amylase gene copy number variation. Nat Genet 39: 1256–1260.
- 35 Geets E, Zegers D, Beckers S, Verrijken A, Massa G, et al. (2016) Copy number variation (CNV) analysis and mutation analysis of the 6q14.1-6q16.3 genes SIM1 and MRAP2 in Prader Willi like patients. Mol Genet Metab 117: 383–388.
- 36 Li J, Fung I, Glessner JT, Pandey R, Wei Z, et al. (2015) Copy number variations in CTNNA3 and RBFOX1 associate with pediatric food allergy. J Immunol 195: 1599–1607.
- 37 Noureen A, Fresser F, Utermann G, Schmidt K (2015) Sequence variation within the KIV-2 copy number polymorphism of the human LPA gene in African, Asian, and European populations. PLoS One 10: e0121582.
- 38 Dukes ID, Philipson LH (1996) K+ channels: generating excitement in pancreatic beta-cells. Diabetes 45: 845–853.
- 39 MacDonald PE, Sewing S, Wang J, Joseph JW, Smukler SR, et al. (2002) Inhibition of Kv2.1 voltage-dependent K+ channels in pancreatic beta-cells enhances glucose-dependent insulin secretion. J Biol Chem 277: 44938–44945.
- 40 Plengvidhya N, Chanprasert K, Tangjittipokin W, Thongnoppakhun W, Yenchitsomanus PT (2015) Detection of CAPN10 copy number variation in Thai patients with type 2 diabetes by denaturing high performance liquid chromatography and real-time quantitative polymerase chain reaction. J Diabetes Investig 6: 632–639.
- 41 Michelini FM, Bueno CA, Molinari AM, Galigniana MD, Galagovsky LR, et al. (2016) Synthetic stigmastanes with dual antiherpetic and immunomodulating activities inhibit ERK and Akt signaling pathways without binding to glucocorticoid receptors. Biochim Biophys Acta 1860: 129–139.
