Abstract
This study assessed the association of muscle mass with insulin resistance, evaluated from the insulin sensitivity index (ISI), in Japanese patients with gestational diabetes mellitus (GDM). Consecutive patients with GDM (n = 96) admitted to St. Marianna University Hospital between October 2015 and March 2018 for initial education and glycemic control were enrolled in a prospective observational study. Insulin resistance was evaluated by measuring the ISI and body composition was assessed by bioelectrical impedance analysis. The subjects were aged 34.4 ± 4.8 years (mean ± SD) and their body mass index (BMI) before pregnancy was 22.3 ± 4.0 kg/m2. Fifty-three patients (55.2%) had a history of diabetes in first-degree relatives. The ISI was 7.2 ± 3.3, appendicular skeletal muscle mass (ASM) was 17.0 ± 2.1 kg, and fat mass (FM) was 18.8 ± 8.2 kg. The ASM/FM ratio was 1.02 ± 0.34. There was a positive correlation between FM and ASM (r = 0.734, p < 0.001). To adjust for confounders when evaluating the association of ASM with ISI, multivariate analysis was conducted using age, family history of diabetes, and BMI as variables. In this analysis, the ASM/FM ratio showed a significant positive correlation with ISI (β = 0.303, p = 0.020). These findings suggest that inadequate ASM/FM ratio is important for the development of insulin resistance in Japanese patients with GDM. Excessive emphasis on dieting rather than health might increase the risk of GDM by reducing the muscle mass below the level that maintains normal glucose metabolism.
THE DESIRE to lose weight is widespread among women. In Japan, obesity among women has shown a tendency to decrease during the past ten years. According to the 2016 Japan National Health and Nutrition Survey [1], 11.9% of Japanese women are underweight (body mass index [BMI] <18.5 kg/m2). In particular, a much higher proportion of women are underweight in their childbearing years than at other ages, with 20.7% being underweight in their twenties and 16.8% in their thirties.
The International Association of the Diabetes and Pregnancy Study Groups (IADPSG) proposed new criteria for diagnosis of gestational diabetes mellitus (GDM) [2] based on the findings of the Hyperglycemia and Adverse Pregnancy Outcomes study [3]. In Japan, the IADPSG criteria were adopted in July 2010 [4]. The prevalence of GDM has been increased by changing the diagnostic criteria, and it is estimated that 12% of pregnant Japanese women have GDM according to the IADPSG criteria [5].
Pregnancy is characterized by peripheral insulin resistance, which develops in parallel with the increase of circulating maternal hormones [6]. Normal pregnant women increase insulin secretion to compensate for the elevation of insulin resistance and consequently maintain a normal blood glucose level [7, 8], whereas some women with impaired insulin secretion or pre-existing insulin resistance due to obesity develop GDM.
Interestingly, we have managed more than 200 patients with GDM according to the new criteria and we have found that many of them have neither impaired insulin secretion nor obesity. Thus, these conventional factors do not explain the occurrence of GDM in a large group of patients.
Accordingly, we focused on inadequate muscle mass as a potential cause of GDM in non-obese pregnant women without impaired insulin secretion. Glucose uptake into skeletal muscle is increased by stimuli such as insulin and exercise [9]. Several recent studies have shown an influence of reduced muscle mass (sarcopenia) on insulin resistance [10-12]. We hypothesized that sarcopenia might be one of the risk factors for development of GDM, with too much emphasis on dieting rather than health resulting in an inadequate muscle mass to support normal glucose metabolism in lean women of childbearing age.
Therefore, we studied Japanese patients with GDM to determine the association between muscle mass (measured by bioelectrical impedance analysis) and insulin resistance, which was evaluated by calculating the insulin sensitivity index from oral glucose tolerance test data.
Materials and Methods
Study design
This prospective observational study enrolled consecutive GDM patients admitted to St. Marianna University Hospital (Kawasaki, Japan) between March 2016 and March 2018.
Participants
In Japan, all pregnant women undergo a 1-h 50 g glucose challenge test (GCT) between 16 and 30 weeks. Women who fail the screening GCT subsequently undergo a diagnostic 2-h 75 g oral glucose tolerance test (OGTT). In this study, women with at least one elevated glucose value based upon the IADPSG criteria (fasting ≥92 mg/dL, 1 h ≥180 mg/dL, or 2 h ≥153 mg/dL) were classified as having GDM. The exclusion criteria were as follows: (i) non-singleton pregnancy, (ii) overt diabetes, (iii) a past history of diabetes, (iv) severe infection, (v) patients before/after surgery, (vi) and patients with preeclampsia.
At our hospital, patients with newly diagnosed GDM are recommended to participate in an inpatient education program lasting from 3 to 7 days. According to the recommendations of the Japan Diabetes Society [13] and the American Diabetes Association [14], insulin therapy is initiated if the fasting glucose level is ≥100 mg/dL, the 1-h postprandial glucose level is ≥140 mg/dL, or the 2-h postprandial level is ≥120 mg/dL.
Written informed consent was obtained from all participants. This study was carried out in accordance with the Declaration of Helsinki [15], and was approved by the ethics committee of St. Marianna University School of Medicine.
Measurements
The age, family history of diabetes, BMI before pregnancy, and glycosylated hemoglobin A1c (HbA1c) level were recorded. On the day after hospitalization, each patient underwent a 5-point 75-g OGTT with measurement of plasma glucose and serum insulin levels. To evaluate insulin resistance, we calculated the insulin sensitivity index (ISI) from the OGTT data according to the following formula: ISI = 10,000/square root of [fasting glucose × fasting insulin] × [mean glucose × mean insulin during the OGTT] [16]. Then body composition was measured after urination and before lunch by using the MC-190EM Body Composition Analyzer (Tanita Corp., Tokyo, Japan) according to the manufacturer’s instructions. This analyzer was developed to measure the body composition of pregnant women by compensating for the intrauterine component (sum of the fetal, placental, and amniotic fluid weights) [17]. Muscle mass data were used to calculate the appendicular skeletal muscle mass (ASM) as the sum of the muscle mass of the arms and the legs. The appendicular skeletal muscle index (SMI) was calculated as ASM/height squared (kg/m2), while the fat index (FI) was calculated as the total fat mass (FM)/height squared (kg/m2). The ASM/FM (M/F) ratio was also calculated. For assessment of β-cell function, the insulinogenic index was calculated as the ratio of the increment of plasma insulin to that of plasma glucose during the first 30 min of the OGTT. Homeostasis model assessment of insulin resistance (HOMA-R) was calculated as fasting insulin (μU/mL) × fasting glucose (mg/dL)/405 and homeostasis model assessment of β-cell function (HOMA-β) was calculated as 360 × fasting insulin (μU/mL)/(fasting glucose (mg/dL) – 63).
Stratified analysis
Stratified analysis was performed to clarify the relationship between muscle mass and insulin resistance. For this analysis, we divided the subjects into a group with higher blood glucose levels who required insulin therapy and a group with lower glucose levels who did not.
Statistical analysis
Results are expressed as the mean ± standard deviation (SD). The relations between ISI and clinical or laboratory data were evaluated by Spearman’s correlation analysis. In addition, multiple regression analysis was performed to examine the independent associations between ISI and variables that showed significant correlation in Spearman’s analysis or were considered to be clinically important, including the age, family history of diabetes, BMI, and M/F ratio. All analyses were performed using the SPSS version 21 software package (IBM, Tokyo, Japan), and p < 0.05 was considered to indicate a significant difference.
Results
All of the subjects were admitted for routine diabetes education and improvement of glycemic control according to the Japanese health system, and none of them were hospitalized for urgent metabolic or perinatal complications. Of the 100 patients with GDM admitted during the study period, 4 patients were excluded from analysis (two patients fitted the criteria for diabetes, there were no 75 g OGTT data for one patient, and the blood samples of one patient showed hemolysis).
The demographic and clinical characteristics of the remaining 96 patients are presented in Table 1. The subjects were aged 34.4 ± 4.8 years and the BMI before pregnancy was 22.3 ± 4.0 kg/m2. Fifty-three patients (55.2%) had a history of diabetes in first-degree relatives. The median [interquartile] gestational age at diagnosis of GDM was 28 [17–32] weeks. At admission, fasting plasma glucose (FPG) was 86.4 ± 8.6 mg/dL, HbA1c was 5.3 ± 0.3%, and glycoalbumin (GA) was 13.3 ± 1.5%.
Table 1
Characteristics of the patients
| Number |
96 |
| Age (years) |
34.4 ± 4.7 |
| Family history of diabetes (+/–) |
53/43 |
| Time of diagnosis (week) |
28 [17–32] |
| BMI before pregnancy (kg/m2) |
22.3 ± 4.0 |
| BMI at hospitalization (kg/m2) |
23.8 ± 4.0 |
| FPG (mg/dL) |
86.4 ± 8.5 |
| HbA1c (%) |
5.3 ± 0.3 |
| GA (%) |
13.3 ± 1.5 |
| HOMA-R |
1.18 ± 0.66 |
| HOMA-β |
90.7 ± 46 |
| Insulinogenic index |
0.51 ± 0.28 |
| ISI |
7.2 ± 3.3 |
| MM (kg) |
36.8 ± 3.5 |
| ASM (kg) |
16.0 ± 2.1 |
| SMI (kg/m2) |
6.8 ± 0.8 |
| FM (kg) |
18.8 ± 8.2 |
| FI (kg/m2) |
7.4 ± 3.1 |
| M/F ratio |
1.00 ± 0.4 |
Data are expressed as the mean ± SD for continuous variables or the median [IQR]. FPG, fasting plasma glucose; HbA1c, hemoglobin A1c; GA, glycoalbumin; HOMA-R, homeostasis model assessment of insulin resistance; HOMA-β, homeostasis model assessment of beta-cell function; ISI, insulin sensitivity index; MM, whole body muscle mass; ASM, appendicular skeletal muscle mass; SMI, skeletal muscle index; FM, whole body fat mass; FI, fat mass index; M/F ratio, ASM/FM ratio
The ISI calculated from OGTT data was 7.2 ± 3.3. In addition, the ASM was 17.0 ± 2.1 kg, SMI was 6.8 ± 0.8 kg/m2, FM was 18.8 ± 8.2 kg, and FI was 7.4 ± 3.1 kg/m2. The M/F ratio was 1.02 ± 0.34.
As shown in Fig. 1, there was a positive correlation between FM and ASM (r = 0.734, p < 0.001). The results of univariate analysis of the relations between ISI and various clinical parameters are displayed in Table 2. ISI was negatively correlated with the BMI before pregnancy and the BMI at admission, while it showed a positive correlation with the M/F ratio. To adjust for potential confounders when evaluating the association between the M/F ratio and ISI, multivariate analysis was conducted using age, family history of diabetes, and BMI as variables. As shown in Table 3, this analysis revealed a significant positive correlation of the M/F ratio with ISI (β = 0.303, p = 0.020). We divided the subjects into groups with or without initiation of insulin therapy and the baseline clinical characteristics of these two groups are displayed in Table 4. There were no significant differences between the two groups with regard to conventional risk factors for GDM, such as the age, family history of diabetes, BMI before pregnancy, HOMA-β, and insulinogenic index. However, the group receiving insulin therapy had a significantly lower M/F ratio (p = 0.040) and a significantly lower ISI (p = 0.033) than the group without insulin.
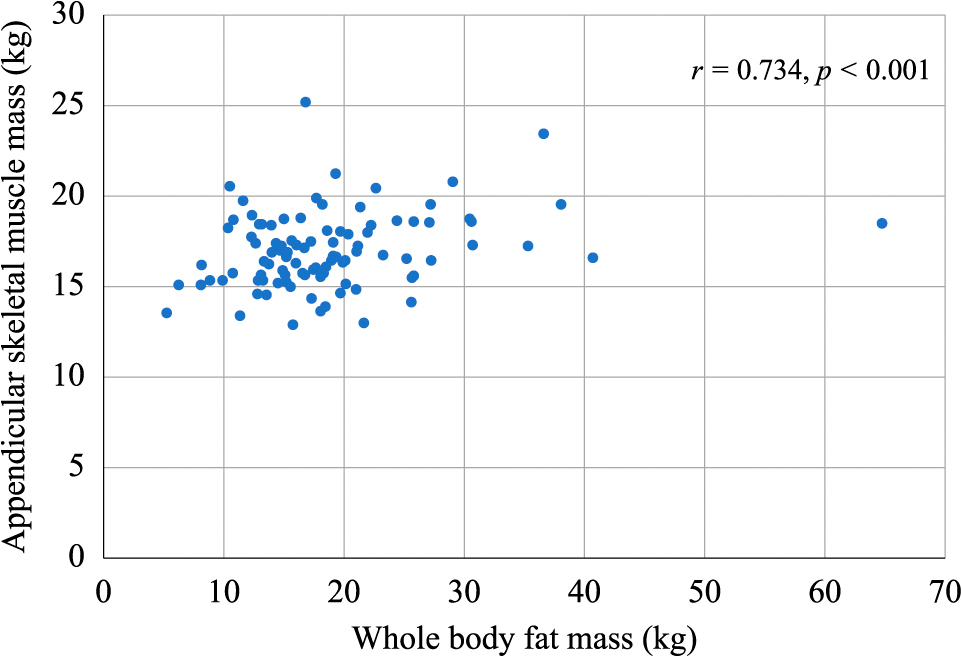
Table 2
Correlations between the ISI and risk factors for gestational diabetes
| Risk factors |
Correlation coefficient |
p value |
| BMI before pregnancy (kg/m2) |
–0.49 |
<0.001 |
| BMI at hospitalization (kg/m2) |
–0.492 |
<0.001 |
| SMI (kg/m2) |
–0.325 |
0.001 |
| FI (kg/m2) |
–0.489 |
<0.001 |
| M/F ratio |
0.513 |
<0.001 |
Table 3
Results of multiple regression analysis of the relation between ISI and various factors
| Variables |
β |
p |
| BMI at hospitalization (kg/m2) |
–0.279 |
0.031* |
| Family history of diabetes (+/–) |
–0.152 |
0.086 |
| Age (years) |
0.092 |
0.292 |
| M/F ratio |
0.303 |
0.020* |
Table 4
Comparison of the patients with and without insulin therapy
|
insulin (–) |
insulin (+) |
| Number |
28 |
68 |
| Age (years) |
34.1 ± 4.7 |
34.5 ± 4.8 |
| Family history of diabetes (+/–) |
15/13 |
38/30 |
| Time of diagnosis (week) |
29.0 [17.8–32.0] |
28.0 [17.0–32.0] |
| BMI before pregnancy (kg/m2) |
21.4 ± 2.8 |
22.7 ± 4.4 |
| BMI at hospitalization (kg/m2) |
22.4 ± 2.9 |
24.4 ± 4.3* |
| FPG (mg/dL) |
81.9 ± 7.4 |
88.3 ± 8.3* |
| HbA1c (%) |
5.1 ± 0.3 |
5.3 ± 0.3* |
| GA (%) |
13.3 ± 1.5 |
13.3 ± 1.6 |
| HOMA-R |
0.91 ± 0.39 |
1.29 ± 0.71* |
| HOMA-β |
98.5 ± 49.6 |
87.4 ± 44.4 |
| Insulinogenic index |
0.54 ± 0.22 |
0.5 ± 0.3 |
| ISI |
8.3 ± 3.5 |
6.7 ± 3.2* |
| MM (kg) |
36 ± 3.2 |
37.1 ± 3.6 |
| FM (kg) |
16.3 ± 5.9 |
19.8 ± 8.8 |
| ASM (kg) |
16.4 ± 1.6 |
17.3 ± 2.3 |
| SMI (kg/m2) |
6.5 ± 0.6 |
6.9 ± 0.8 |
| FI (kg/m2) |
6.4 ± 2.2 |
7.8 ± 3.3* |
| M/F ratio |
1.13 ± 0.42 |
0.97 ± 0.30* |
Data are expressed as the mean ± SD for continuous variables or the median [IQR]. *p < 0.05 vs. IRI(–), FPG, fasting plasma glucose; HbA1c, hemoglobin A1c; GA, glycoalbumin; HOMA-R, homeostasis model assessment of insulin resistance; HOMA-β, homeostasis model assessment of beta-cell function; ISI, insulin sensitivity index; MM, whole body muscle mass; ASM, appendicular skeletal muscle; SMI, skeletal muscle index; FM, whole body fat mass; FI, fat mass index; M/F ratio, ASM/FM ratio
Discussion
We performed a cross-sectional investigation of the association between muscle mass and insulin resistance in Japanese patients with GDM and obtained three main findings. First, there was a positive correlation between FM and ASM. Second, the M/F ratio showed a positive correlation with the ISI, even after adjustment for age, a family history of diabetes, and BMI. Third, when the patients were divided into subgroups according to insulin therapy, the M/F ratio and ISI were significantly lower in the patients who required insulin than in those without insulin.
An increase of FM may exacerbate insulin resistance, while an increase of ASM can improve insulin resistance. However, there was a positive correlation between FM and ASM in the present study, while BMI was negatively correlated with ISI. Thus, FM seems to have a stronger influence on insulin resistance than ASM. According to multivariate analysis, the M/F ratio showed a significant positive correlation with ISI after adjustment for the age, family history of diabetes, and BMI. This suggests that an imbalance between muscle and fat masses is an important factor in the development of insulin resistance at any given BMI.
GDM occurs because of metabolic and hormonal changes during pregnancy, and the physiological increase of maternal hormones such as prolactin, progesterone, and estrogens coincides with development of insulin resistance [6]. Adipokines may also contribute to insulin resistance or impairment of β-cell secretory function [18]. If a pregnant woman cannot increase insulin secretion to compensate for greater insulin resistance, there is a risk of GDM. Inadequate insulin secretion could be due to an inherited disorder of insulin production or to insulin resistance associated with obesity. In a study of 97,157 Japanese subjects, the incidence of GDM increased along with the BMI before pregnancy [19]. However, the BMI before pregnancy was normal (22.3 ± 4.0) in the present study. Also, insulin secretion was not insufficient because the insulinogenic index and HOMA-β were normal at admission to hospital (0.51 ± 0.28 (>0.4) and 90.7 ± 46.0 (>30), respectively). Thus, the conventional parameters and physiological changes associated with pregnancy did not fully explain the etiology of GDM in our patients. This is the first report that a low M/F ratio is associated with insulin resistance. The data obtained from stratified analysis also support our hypothesis, which may partly explain how GDM occurs in Japanese women who are not obese and who have adequate insulin secretion.
A similar metabolic disorder may occur in frail elderly persons with sarcopenia, since sarcopenia has been associated with insulin resistance in both non-obese and obese individuals [11, 20]. In addition, a recent study showed that Indian women with GDM were significantly more sedentary than with those without GDM [21], suggesting that low physical activity might lead to a low M/F ratio in women who develop GDM.
The present study had some limitations. First, we only studied GDM patients, so we could not perform comparison with pregnant women who had normal glucose tolerance. It was previously reported that Japanese women with GDM had a lower ISI than pregnant women with normal glucose tolerance [22]. Thus, we hope to explore the relationship between ISI and body composition in the future by studying a larger population of pregnant women including those with normal glucose tolerance. In addition, the age of our subjects was relatively high for pregnant women (34.4 ± 4.8 years). According to the Japanese Annual Health, Labour and Welfare Report 2016, the average age was 30.7 years at the first delivery, 32.6 years at the second, and 33.6 years at the third [23]. Furthermore, daily activity of the subjects was not evaluated, so we were unable to assess whether the lower M/F ratio of some subjects was due to less activity.
In conclusion, the M/F ratio may be involved in the onset of GDM or may influence its severity. Our findings suggested that reduced muscle mass is an important factor related to the development of insulin resistance in Japanese patients with GDM.
Acknowledgments
The authors are indebted to Dr. Suguru Igarashi and Prof. Mamoru Tanaka for their expert assistance with this study.
Disclosure
The authors declare no conflicts of interest.
References
- 1 The National Health and Nutrition Survey in Japan (2016) http://www.mhlw.go.jp/bunya/kenkou/eiyou/dl/h28-houkoku.pdf [Last accessed on 24 June 2018] (In Japanese).
- 2 International Association of Diabetes and Pregnancy Study Groups Consensus Panel, Metzger BE (2010) International association of diabetes and pregnancy study groups recommendations on the diagnosis and classification of hyperglycemia in pregnancy. Diabetes Care 33: 676–682.
- 3 Metzger BE, Lowe LP, Dyer AR, Trimble ER, Chaovarindr U, et al. (2008) Hyperglycemia and adverse pregnancy outcomes. N Engl J Med 358: 1991–2002.
- 4 Minakami H, Hiramatsu Y, Koresawa M, Fujii T, Hamada H, et al. (2011) Guidelines for obstetrical practice in Japan: Japan Society of Obstetrics and Gynecology (JSOG) and Japan Association of Obstetricians and Gynecologists (JAOG) 2011 edition. J Obstet Gynaecol Res 37: 1174–1197.
- 5 Morikawa M, Yamada T, Yamada T, Akaishi R, Nishida R, et al. (2010) Change in the number of patients after the adoption of IADPSG criteria for hyperglycemia during pregnancy in Japanese women. Diabetes Res Clin Pract 90: 339–342.
- 6 Nadal A, Alonso Magdalena P, Soriano S, Ropero AB, Quesada I, et al. (2009) The role of oestrogens in the adaptation of islets to insulin resistance. J Physiol 587: 5031–5037.
- 7 Homko C, Sivan E, Chen X, Reece EA, Boden G (2001) Insulin secretion during and after pregnancy in patients with gestational diabetes mellitus. J Clin Endocrinol Metab 86: 568–573.
- 8 Catalano PM, Tyzbir ED, Wolfe RR, Calles J, Roman NM, et al. (1993) Carbohydrate metabolism during pregnancy in control subjects and women with gestational diabetes. Am J Physiol 264: E60–E67.
- 9 Richter EA, Hargreaves M (2013) Exercise, GLUT4, and skeletal muscle glucose uptake. Physiol Rev 93: 993–1017.
- 10 Srikanthan P, Karlamangla AS (2011) Relative muscle mass is inversely associated with insulin resistance and prediabetes. Findings from the third National Health and Nutrition Examination Survey. J Clin Endocrinol Metab 96: 2898–2903.
- 11 Srikanthan P, Hevener AL, Karlamangla AS (2010) Sarcopenia exacerbates obesity-associated insulin resistance and dysglycemia: findings from the National Health and Nutrition Examination Survey III. PLoS One 26: e10805.
- 12 Kwon SS, Lee SG, Lee YH, Lim JB, Kim JH (2017) Homeostasis model assessment of insulin resistance in a general adult population in Korea: additive association of sarcopenia and obesity with insulin resistance. Clin Endocrinol (Oxf) 86: 44–51.
- 13 The Japan Diabetes Society (2013) Evidence-based Practice Guideline for the Treatment for Diabetes in Japan 2013. Nankodo, Tokyo: 217–232 (In Japanese).
- 14 American Diabetes Association (2015) 12. Management of diabetes in pregnancy. Diabetes Care 38: s77–s79.
- 15 World Medical Association (2013) World Medical Association Declaration of Helsinki: ethical principles for medical research involving human subjects. JAMA 310: 2191–2194.
- 16 Matsuda M, DeFronzo RA (1999) Insulin sensitivity indices obtained from oral glucose tolerance testing: comparison with the euglycemic insulin clamp. Diabetes Care 22: 1462–1470.
- 17 Ueda Y, Nakano H, Honda Y, Miyama T, Nishizawa M, et al. (2006) Estimation of body fat mass in pregnant women by a new method using bioelectrical impedance analysis with compensation for intrauterine component weight. Int J Body Compos Res 4: 145–152.
- 18 Fasshauer M, Blüher M, Stumvoll M (2014) Adipokines in gestational diabetes. Lancet Diabetes Endocrinol 2: 488–499.
- 19 Enomoto K, Aoki S, Toma R, Fujiwara K, Sakamaki K, et al. (2016) Pregnancy outcomes based on pre-pregnancy body mass index in Japanese women. PLoS One 11: e0157081.
- 20 Lee SW, Youm Y, Lee WJ, Choi W, Chu SH, et al. (2015) Appendicular skeletal muscle mass and insulin resistance in an elderly Korean population: the Korean social life, health and aging project-health examination cohort. Diabetes Metab J 39: 37–45.
- 21 Anjana RM, Sudha V, Lakshmipriya N, Anitha C, Unnikrishnan R, et al. (2016) Physical activity patterns and gestational diabetes outcomes—the wings project. Diabetes Res Clin Pract 116: 253–262.
- 22 Saisho Y, Miyakoshi K, Tanaka M, Shimada A, Ikenoue S, et al. (2010) Beta cell dysfunction and its clinical significance in gestational diabetes. Endocr J 57: 973–980.
- 23 Vital statistics in Japan Trend up to 2016 http://www.mhlw.go.jp/toukei/list/dl/81-1a2.pdf. [Last accessed on 24 June 2018] (In Japanese).
