Abstract
Glucocorticoids play a critical role in the regulation of homeostasis, including metabolism. In patients with Cushing’s syndrome, chronic glucocorticoid excess disrupts physiological internal milieu, resulting in central obesity, muscle atrophy, fatty liver, and insulin resistance. However, the relationship among various metabolic effects of glucocorticoids remains unknown. In the present study, we studied a male mouse model of Cushing’s syndrome and indicated that glucocorticoid excess alters metabolic phenotype and body composition involving possible communication among skeletal muscle, liver, and adipose tissue.
GLUCOCORTICOIDS are secreted from the adrenal cortex under the control of the hypothalamic–pituitary–adrenal (HPA) axis, and play a critical role in the regulation of a variety of physiological processes including cell proliferation, cardiovascular tone, fluid volume, immune response, growth, reproduction, behavior, and energy metabolism [1]. Glucocorticoid action is mediated by the glucocorticoid receptor (GR), a member of the nuclear receptor superfamily of transcription factors. Upon binding glucocorticoid, GR modulates the transcription of distinct gene sets in a tissue-specific manner to achieve their tissue-specific effects [2, 3].
Systemic metabolism is considered to be regulated by complex, not yet fully clarified, interactions between a battery of biological systems, including glucocorticoids [4, 5]. For example, glucocorticoids coordinate the release of glucose into the bloodstream enough to fuel the brain and ensure the organism survival under conditions of acute stress or starvation [1, 6]. We previously reported that, using skeletal muscle-specific GR knockout mice, glucocorticoid effects in muscle mass may control adipose tissue metabolism via liver; GR-driven skeletal muscle degradation produces alanine, which negatively modulates hepatic gene expression of lipolytic hormone fibroblast growth factor 21 (FGF21) [7]. On the other hand, glucocorticoid excess, either endogenous (Cushing’s syndrome) or exogenous (long-term glucocorticoid treatment), results in central obesity, muscle atrophy, fatty liver, hypertension, hyperglycemia, dyslipidemia, and insulin resistance [8, 9], which also suggests the presence of glucocorticoid-driven metabolic communication among various tissues. However, it remains unknown how a variety of tissue-specific glucocorticoid effects are systemically integrated for coordinated regulation of systemic metabolism.
In the present study, for understanding the role of glucocorticoids in regulating whole-body metabolism, we used the mouse model of Cushing’s syndrome and examined the effects of glucocorticoids on a set of organs including the liver, adipose tissue, and skeletal muscle, the pathological and radiological alterations in those organs, and the relationships among them.
Materials and Methods
Mice and glucocorticoid treatment
All animal experiments were performed with the approval of the Animal Ethics Committee of the Institute of Medical Science, the University of Tokyo (approval number PA13-64 and PA18-26). Seven-week-old male C57BL/6J mice (CLEA Japan) were purchased and acclimated for a week. All mice were maintained in individual cages on a 12-h light-dark photocycle with free access to water and a stock pellet diet (CA-1, CLEA Japan, 3.47 kCal/g) as described previously [7].
For creating a male mouse model of Cushing’s syndrome, when those mice became eight-week-old, drinking water was replaced with a 1% ethanol solution containing 100 μg/mL corticosterone (Wako Pure Chemical Industries) or a vehicle, and those mice were remained to be fed and watered ad libitum as previously reported [10-12]. After 4-wk corticosterone treatment, mice were anesthetized with intraperitoneal injection of sodium pentobarbital (Kyoritsu Seiyaku) at 75 mg/kg body weight and sacrificed. Blood samples were collected from the inferior vena cava, blood glucose levels were measured by using Glucose Pilot Blood Glucose Monitoring System (Aventir Biotech), the remaining blood samples were transferred into heparinized sampling tubes, and plasma samples were separated by centrifugation and stored at –80°C until biochemical assays. Excised tissues were weighed and fixed in formalin, or quickly frozen and crushed by using Cryo-Press (Microtec) pre-frozen in liquid nitrogen, unless otherwise specified as described previously [7].
Biochemical analysis of metabolic parameters
As metabolic parameters, plasma concentrations of insulin and FGF21 were measured by ELISA (MS303, Morinaga Institute of Biological Science; MF2100, R&D Systems, respectively) using iMark Microplate Absorbance Reader (BioRad). Quantification of triglyceride (TG) and alanine concentrations were performed by colorimetric assays (K622-100 and K652-100, BioVision, respectively) using DS-11+ (DeNovix). Alanine aminotransferase (ALT) activity in plasma was measured by colorimetric assay (K752-100, BioVision) with iMark Microplate Absorbance Reader. These assays were accurately examined according to the manufacturer’s instructions. Plasma insulin concentrations and blood glucose levels were measured after a 24-hour fasting for calculating homeostasis model assessment for insulin resistance (HOMA-IR) [13]. Calculation formula, HOMA-IR = blood glucose after a 24-hour fasting (mg/dL) × plasma insulin after a 24-hour fasting (μU/mL)/405.
Histopathological analysis
Formalin-fixed tissues from each animal were cut in paraffin sections (5 μm thick) and mounted onto slides, and Hematoxylin-Eosin staining was performed as described previously [14]. Cross sectional areas (CSAs) of adipocytes of retroperitoneal white adipose tissue (rWAT) in mice were determined for 100 randomly selected cells in 4 independent animals of each group by two blinded observers and quantified manual outlining of the cellular membrane with Image J [15].
Micro-CT analysis
Mice were anesthetized with inhalation of isoflurane (DS Pharma Animal Health) and analyzed by using in vivo micro X-ray computed tomography (CT) system CosmoScanFX (Rigaku). The tube voltage was set at 90 kV and the current was constant at 88 μA. Mice were scanned with a resolution of 120 μm pixel. Attenuation values determined by CT are expressed in Hounsfield units (HU) on the basis of a linear scale using water as the reference (0 HU) [16]. Liver, inguinal WAT (iWAT), and rWAT and erector spinae muscles were analyzed at the level of the thirteenth thoracic vertebra (Th13), the fourth lumbar vertebra (L4), and fifth lumbar vertebra (L5), respectively [17]. CSAs of those tissues were measured by manual outlining of their compartments and segmentation as described previously [18]. To obtain the average of CT attenuation values of each organ, we used the method of Rockall et al. with minor modification [19]. In brief, the appropriate region of organs, excluding the margin of organs, blood vessels, and artifacts, was divided into squares (a square is eight pixels (960 μm) on each side). These squares were randomly sampled (eight squares in liver and four squares in others) and those samples were used for calculating the average of the CT attenuation values of each organ. The distribution of CT attenuation values was represented as a frequency histogram [20].
Statistical analysis
Data were analyzed by two-tailed Student’s t-test for unpaired data. Pearson product-moment correlation analysis was used to investigate correlation coefficients among each parameter. P values below 0.05 were considered statistically significant. Bar graphs and line graphs show means ± standard error of the mean (s.e.m.). In boxplot graphs, whiskers show the minimum and maximum of all the data, a box shows one standard deviation above and below the mean of the data, and a line inside the box shows the median of the data.
Results
Changes in tissue mass, fat content, and different metabolic parameters in mice with glucocorticoid excess
As reported elsewhere (See Materials and Methods, and Fig. 1A), 4-wk treatment with corticosterone in drinking water induced morphological changes associated with chronic glucocorticoid excess (Fig. 1B). Those mice showed increased body weight, but their total food intake was not different from that of control mice (Fig. 1C and 1D). Adrenal gland weight of corticosterone-treated mice decreased when compared to that of control mice (Fig. 1E), indicating suppression of the HPA axis. Corticosterone-treated mice had a higher tendency to develop hyperglycemia, hyperinsulinemia, HOMA-IR elevation, hypertriglyceridemia, and plasma ALT elevation (Fig. 1F–1H) than the control mice. Increase in plasma alanine concentrations under fasting condition was blunted in corticosterone-treated mice, and plasma FGF21 concentrations were stimulated by starvation and higher in the corticosterone-treated mice than in control mice (Fig. 1I).

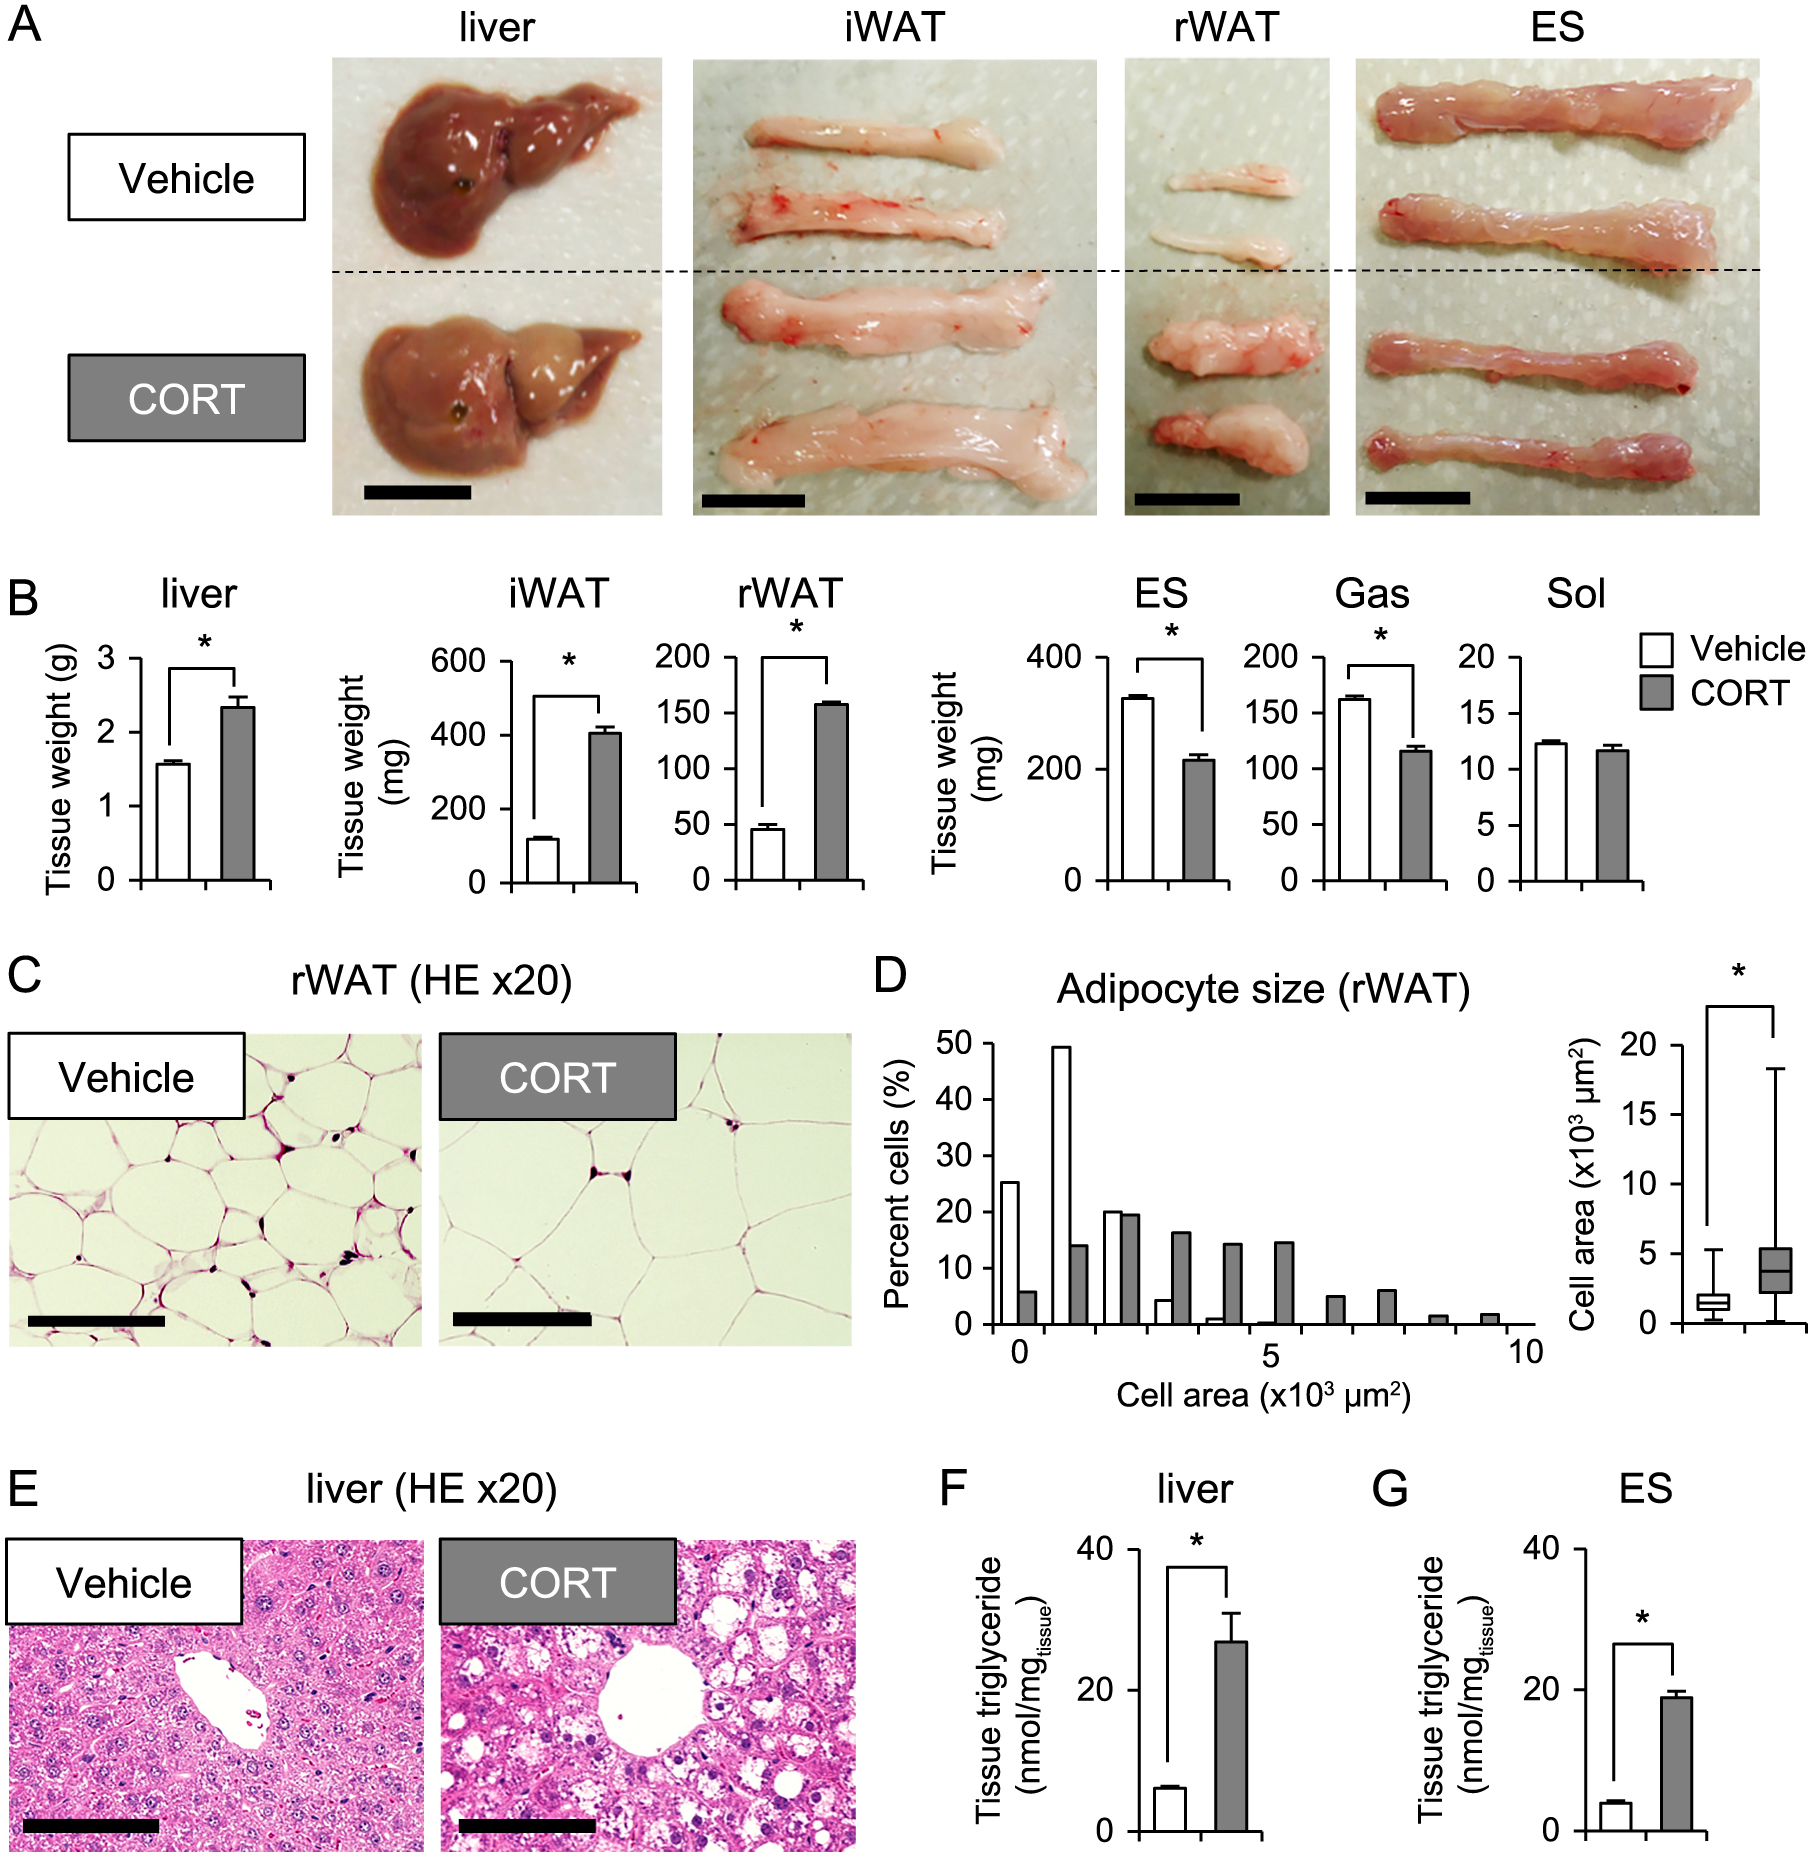
The livers of corticosterone-treated mice were yellowish with blunt edges. The adipose tissues were hypertrophic. Erector spinae appeared to be atrophic (Fig. 2A). The weights of the liver, iWAT, and rWAT were significantly higher, whereas the weights of erector spinae and gastrocnemius muscle were lower in corticosterone-treated than in control mice (Fig. 2B). Of note, the weights of the soleus muscle did not show difference between corticosterone-treated and control mice (Fig. 2B). Pathological analysis showed that corticosterone-treated mice had increased rWAT adipocyte size (Fig. 2C and 2D), hepatic lipid droplet size (Fig. 2E), and hepatic TG content (Fig. 2F) compared with control mice. Interestingly, TG content in the erector spinae was elevated in corticosterone-treated mice (Fig. 2G). These results indicated that chronic treatment with excess glucocorticoid induces alterations in body composition and energy metabolism involving glucose intolerance, whole body insulin resistance, dyslipidemia, liver steatosis, adipose tissue hypertrophy, and muscle atrophy in mice in accordance with previous studies [8, 10, 21].
Since the weights of adrenal glands are considered to reflect HPA-axis suppression effects of glucocorticoid excess, we first tested the relationship between the weights of adrenal glands and glucocorticoid effects in muscle and adipose tissue. As shown in Fig. 3A and 3B, the weights of gastrocnemius and rWAT were significantly correlated with the weights of adrenal glands, positively and negatively, respectively. These results suggested that certain glucocorticoid effects might correlate with each other. Given this, we tested the relationship between various glucocorticoid effects including tissue weights (adrenal gland, WAT, liver, and skeletal muscle), plasma concentrations of insulin, TG, ALT, and FGF21, and tissue content of TG in control and corticosterone-treated mice and created a cross-tabulation (Fig. 3C). The adrenal gland weight significantly correlated with, examined so far, all metabolic parameters except for soleus weight. Moreover, almost all pairs of metabolic parameters showed significant correlation each other. Interestingly, the weights of erector spinae and gastrocnemius, both of which are known to be glucocorticoid-sensitive muscle [22, 23], negatively correlated with the other metabolic parameters. In clear contrast, the weight of glucocorticoid-resistant soleus did not (Fig. 3C).

Next, we analyzed the effects of corticosterone treatment on the body composition of various mouse organs using micro-CT scan as described in Materials and Methods. The CSAs of the liver, iWAT, and rWAT were increased in corticosterone-treated mice when compared to those of control mice, whereas the CSA of the erector spinae was decreased (Fig. 4A–4C). Moreover, the distribution of the CT attenuation values of the liver, rWAT, and erector spinae of the corticosterone-treated mice appeared to be lower than those of control mice (Fig. 4D–4J).

Fig. 4
Effects of glucocorticoid excess for CSAs and CT attenuation values of the liver, WAT, and skeletal muscle in C57BL/6J male mice
(A) A representative CT sagittal image of mice and the levels of axial image for CT analysis are shown. Th13, the 13th thoracic vertebra; L4, the 4th lumbar vertebra; L5, the 5th lumbar vertebra.
(B) Representative CT axial images of mice treated with vehicle or corticosterone (CORT) at the level of the Th13, L4, and L5.
(C) Axial CSAs of the liver at Th13 level, iWAT at L4 level, rWAT at L5 level, and erector spinae muscle (ES) at L5 level in mice treated with vehicle or CORT solution.
(D) A representative CT axial image of mice at the level of Th13 with squares (a square is eight pixels (960 μm) on each side) for calculating the average of the CT attenuation values of the liver. White squares represent randomly sampled squares.
(E, F) Distributions of CT attenuation values of the liver of mice treated with vehicle or CORT solution are shown as frequency histograms (E) and averages (F).
(G, H) Distributions of CT attenuation values of rWAT of mice treated with vehicle or CORT solution are shown as frequency histograms (G) and averages (H).
(I, J) Distributions of CT attenuation values of ES of mice treated with vehicle or CORT solution are shown as frequency histograms (I) and averages (J).
Error bars represent mean ± s.e.m. (n = 4). * p < 0.05 between mice treated with vehicle (white bars) and CORT solution (gray bars) as determined by two-tailed Student’s t-test for unpaired data.
Finally, we analyzed the relationship between the CSAs and CT attenuation values of the liver, WAT, and skeletal muscle in corticosterone-treated and control mice. The CSAs and CT attenuation values of those organs tended to have either positive or negative correlation with each other (Fig. 5).
Discussion
In patients with Cushing’s syndrome, the relationship between the body composition and metabolic abnormalities has been postulated [4, 24]. It is obvious that glucocorticoids, directly or indirectly, play a major role in their Cushingoid features; GR antagonist RU486 and a cortisol biosynthesis inhibitor metyrapone improved type 2 diabetes mellitus and nonalcoholic fatty liver disease [25], and tissue-specific inactivation of glucocorticoid signaling in adipose tissue, liver, or skeletal muscle improved insulin resistance and other metabolic abnormalities including hyperlipidemia [7, 26-30]. Glucocorticoids act via binding to GR and transcriptionally regulate expression of a set of genes in a given tissue, and the repertory of target genes is distinct among tissues. It, therefore, is rationale to speculate that net effects of glucocorticoids on systemic metabolism may be a sum of such tissue-specific effects and that tissue-specific effects may be interrelated via as yet unknown mechanism. In this line, we in the present study examined the relationship among various glucocorticoid effects with mainly focusing on metabolic parameters and body composition.
As shown in Fig. 3, almost all metabolic parameters as well as the weights of adrenal glands showed significant correlation with each other, supporting the notion above. Previously, we showed that, using skeletal muscle GR knockout mice, glucocorticoid-regulated skeletal muscle-derived signals (e.g., alanine) control liver FGF21 synthesis, and FGF21 regulates adipose tissue weights [7]. Here we again indicated the involvement of FGF21 in systemic regulation of metabolism by glucocorticoids (Fig. 3C). However, the effects of corticosterone treatment on plasma levels of FGF21 were as strong as those of 24-h fasting, and plasma levels of FGF21 did not correspond to those of alanine (Fig. 1I). We, therefore, have to think at least 2 possibilities. First, in Cushing model mice, plasma levels of FGF21 might be determined not by skeletal muscle-derived alanine but by exogenous corticosterone in the liver. It is reported that major component of plasma FGF21 is from the liver and that hepatic FGF21 gene expression is positively regulated by GR [31, 32]. Second, the communication between those metabolic organs for systemic metabolism might be conditionally regulated and different between skeletal muscle-specific GR knockout mice and Cushing model.
On the other hand, it should be noted that the weight of soleus muscle did not show significant correlation with either parameter (Fig. 3C). It is well known that type II fibers are rich in gastrocnemius and erector spinae but not in soleus, and that glucocorticoid sensitivity is relatively high in type II fiber-rich muscles [33, 34]. Our results, therefore, may indicate the importance of skeletal muscle glucocorticoid effects in type II fiber-rich muscles in systemic regulation of metabolism.
Our CT analysis (Figs. 4 and 5) also supports the presence of inter-organ communication among skeletal muscle, liver, and adipose tissues. In contrast to the decrease in CSA of skeletal muscle, CSAs of adipose tissues and liver were increased. Moreover, CT attenuation values decreased in skeletal muscle, adipose tissues, and liver, indicating the increase in lipid accumulation in those tissues [16, 19]. This notion is supported by the fact that corticosterone-treatment increased adipocyte size and TG contents in skeletal muscle and liver (Fig. 2). Interestingly, intramuscular fat accumulation was recently reported to be associated with decline in skeletal muscle mass in aged subjects and patients with rheumatoid arthritis [35, 36]. Of course, we cannot rule out such possibility that not only metabolic factors examined so far but also other humoral factors, e.g., pituitary hormones, influence on the alteration in the body composition and metabolism in corticosterone-treated mice. Indeed, it is reported that glucocorticoid excess disrupts various hormonal systems, i.e., decrease in plasma levels of growth hormone, androgen, and estrogen, and increase in plasma levels of insulin-like growth factor 1 [37-39].
In conclusion, the present study may indicate that glucocorticoid excess alters metabolic phenotype and body composition most possibly via the inter-organ communication among skeletal muscle, liver, and adipose tissues. Together with our previous report [7], we may also suggest that such inter-organ communication is conditionally regulated. More comprehensive approach should be needed to unveil complex regulatory mechanism for systemic metabolism.
Disclosures
None of the authors have any potential conflicts of interest associated with this research.
Acknowledgements
We thank Dr. Yoshihiro Kawaoka and Dr. Satoshi Fukuyama (Division of Virology, Department of Microbiology and Immunology, Institute of Medical Science, The University of Tokyo) for technical support for CT analysis. We also thank all members of Tanaka Laboratory for helpful comments. This work was supported by JSPS KAKENHI Grant Numbers JP16H05330, JP16K09230, and JP17K16158 (to H.T., N.Y., and H.Y., respectively).
References
- 1 Sapolsky RM, Romero LM, Munck AU (2000) How do glucocorticoids influence stress responses? Integrating permissive, suppressive, stimulatory, and preparative actions. Endocr Rev 21: 55–89.
- 2 Weikum ER, Knuesel MT, Ortlund EA, Yamamoto KR (2017) Glucocorticoid receptor control of transcription: precision and plasticity via allostery. Nat Rev Mol Cell Biol 18: 159–174.
- 3 Whirledge S, DeFranco DB (2018) Glucocorticoid signaling in health and disease: insights from tissue-specific GR knockout mice. Endocrinology 159: 46–64.
- 4 Rose AJ, Herzig S (2013) Metabolic control through glucocorticoid hormones: an update. Mol Cell Endocrinol 380: 65–78.
- 5 Smith RL, Soeters MR, Wüst RCI, Houtkooper RH (2018) Metabolic flexibility as an adaptation to energy resources and requirements in health and disease. Endocr Rev 39: 489–517.
- 6 Tanaka H, Shimizu N, Yoshikawa N (2017) Role of skeletal muscle glucocorticoid receptor in systemic energy homeostasis. Exp Cell Res 360: 24–26.
- 7 Shimizu N, Maruyama T, Yoshikawa N, Matsumiya R, Ma Y, et al. (2015) A muscle-liver-fat signalling axis is essential for central control of adaptive adipose remodelling. Nat Commun 6: 6693.
- 8 Ferraù F, Korbonits M (2015) Metabolic comorbidities in Cushing’s syndrome. Eur J Endocrinol 173: M133–M157.
- 9 Schäcke H, Döcke WD, Asadullah K (2002) Mechanisms involved in the side effects of glucocorticoids. Pharmacol Ther 96: 23–43.
- 10 Karatsoreos IN, Bhagat SM, Bowles NP, Weil ZM, Pfaff DW, et al. (2010) Endocrine and physiological changes in response to chronic corticosterone: a potential model of the metabolic syndrome in mouse. Endocrinology 151: 2117–2127.
- 11 Gasparini SJ, Weber MC, Henneicke H, Kim S, Zhou H, et al. (2016) Continuous corticosterone delivery via the drinking water or pellet implantation: a comparative study in mice. Steroids 116: 76–82.
- 12 Burke SJ, Batdorf HM, Eder AE, Karlstad MD, Burk DH, et al. (2017) Oral corticosterone administration reduces insulitis but promotes insulin resistance and hyperglycemia in male nonobese diabetic mice. Am J Pathol 187: 614–626.
- 13 Matthews DR, Hosker JP, Rudenski AS, Naylor BA, Treacher DF, et al. (1985) Homeostasis model assessment: insulin resistance and beta-cell function from fasting plasma glucose and insulin concentrations in man. Diabetologia 28: 412–419.
- 14 Yoshikawa N, Shimizu N, Maruyama T, Sano M, Matsuhashi T, et al. (2012) Cardiomyocyte-specific overexpression of HEXIM1 prevents right ventricular hypertrophy in hypoxia-induced pulmonary hypertension in mice. PLoS One 7: e52522.
- 15 Schneider CA, Rasband WS, Eliceiri KW (2012) NIH Image to ImageJ: 25 years of image analysis. Nat Methods 9: 671–675.
- 16 Goodpaster BH, Thaete FL, Kelley DE (2000) Composition of skeletal muscle evaluated with computed tomography. Ann N Y Acad Sci 904: 18–24.
- 17 Goodpaster BH, Krishnaswami S, Harris TB, Katsiaras A, Kritchevsky SB, et al. (2005) Obesity, regional body fat distribution, and the metabolic syndrome in older men and women. Arch Intern Med 165: 777–783.
- 18 Luu YK, Lublinsky S, Ozcivici E, Capilla E, Pessin JE, et al. (2009) In vivo quantification of subcutaneous and visceral adiposity by micro-computed tomography in a small animal model. Med Eng Phys 31: 34–41.
- 19 Rockall AG, Sohaib SA, Evans D, Kaltsas G, Isidori AM, et al. (2003) Hepatic steatosis in Cushing’s syndrome: a radiological assessment using computed tomography. Eur J Endocrinol 149: 543–548.
- 20 Goodpaster BH, Thaete FL, Kelley DE (2000) Thigh adipose tissue distribution is associated with insulin resistance in obesity and in type 2 diabetes mellitus. Am J Clin Nutr 71: 885–892.
- 21 Yu J, Yu B, He J, Zheng P, Mao X, et al. (2014) Chronic glucocorticoid exposure-induced epididymal adiposity is associated with mitochondrial dysfunction in white adipose tissue of male C57BL/6J mice. PLoS One 9: e112628.
- 22 Nawata T, Kubo M, Nomura T, Oishi K, Shiragami K, et al. (2018) Change in muscle volume after steroid therapy in patients with myositis assessed using cross-sectional computed tomography. BMC Musculoskelet Disord 19: 93.
- 23 Khaleeli AA, Betteridge DJ, Edwards RH, Round JM, Ross EJ (1983) Effect of treatment of Cushing’s syndrome on skeletal muscle structure and function. Clin Endocrinol (Oxf) 19: 547–556.
- 24 Pivonello R, Isidori AM, De Martino MC, Newell-Price J, Biller BM, et al. (2016) Complications of Cushing’s syndrome: state of the art. Lancet Diabetes Endocrinol 4: 611–629.
- 25 Macfarlane DP, Raubenheimer PJ, Preston T, Gray CD, Bastin ME, et al. (2014) Effects of acute glucocorticoid blockade on metabolic dysfunction in patients with type 2 diabetes with and without fatty liver. Am J Physiol Gastrointest Liver Physiol 307: G760–G768.
- 26 Kershaw EE, Morton NM, Dhillon H, Ramage L, Seckl JR, et al. (2005) Adipocyte-specific glucocorticoid inactivation protects against diet-induced obesity. Diabetes 54: 1023–1031.
- 27 Mueller KM, Hartmann K, Kaltenecker D, Vettorazzi S, Bauer M, et al. (2017) Adipocyte glucocorticoid receptor deficiency attenuates aging- and HFD-induced obesity and impairs the feeding-fasting transition. Diabetes 66: 272–286.
- 28 Bose SK, Hutson I, Harris CA (2016) Hepatic glucocorticoid receptor plays a greater role than adipose GR in metabolic syndrome despite renal compensation. Endocrinology 157: 4943–4960.
- 29 Opherk C, Tronche F, Kellendonk C, Kohlmüller D, Schulze A, et al. (2004) Inactivation of the glucocorticoid receptor in hepatocytes leads to fasting hypoglycemia and ameliorates hyperglycemia in streptozotocin-induced diabetes mellitus. Mol Endocrinol 18: 1346–1353.
- 30 Chapman K, Holmes M, Seckl J (2013) 11β-hydroxysteroid dehydrogenases: intracellular gate-keepers of tissue glucocorticoid action. Physiol Rev 93: 1139–1206.
- 31 Patel R, Bookout AL, Magomedova L, Owen BM, Consiglio GP, et al. (2015) Glucocorticoids regulate the metabolic hormone FGF21 in a feed-forward loop. Mol Endocrinol 29: 213–223.
- 32 Tezze C, Romanello V, Sandri M (2019) FGF21 as modulator of metabolism in health and disease. Front Physiol 10: 419.
- 33 Johnson MA, Polgar J, Weightman D, Appleton D (1973) Data on the distribution of fibre types in thirty-six human muscles. An autopsy study. J Neurol Sci 18: 111–129.
- 34 Shimizu N, Yoshikawa N, Ito N, Maruyama T, Suzuki Y, et al. (2011) Crosstalk between glucocorticoid receptor and nutritional sensor mTOR in skeletal muscle. Cell Metab 13: 170–182.
- 35 Fabbri E, Chiles Shaffer N, Gonzalez-Freire M, Shardell MD, Zoli M, et al. (2017) Early body composition, but not body mass, is associated with future accelerated decline in muscle quality. J Cachexia Sarcopenia Muscle 8: 490–499.
- 36 Baker JF, Mostoufi-Moab S, Long J, Zemel B, Ibrahim S, et al. (2018) Intramuscular fat accumulation and associations with body composition, strength, and physical functioning in patients with rheumatoid arthritis. Arthritis Care Res (Hoboken) 70: 1727–1734.
- 37 Magiakou MA, Mastorakos G, Gomez MT, Rose SR, Chrousos GP (1994) Suppressed spontaneous and stimulated growth hormone secretion in patients with Cushing’s disease before and after surgical cure. J Clin Endocrinol Metab 78: 131–137.
- 38 Coll S, Matabosch X, Garrostas L, Perez-Maña C, Ventura R (2018) Effect of glucocorticoid administration on the steroid profile. Drug Test Anal 10: 947–955.
- 39 English K, Chikani V, Dimeski G, Inder WJ (2019) Elevated insulin-like growth factor-1 in Cushing’s disease. Clin Endocrinol (Oxf) 91: 141–147.

