Abstract
Sodium–glucose cotransporter-2 inhibitors (SGLT2Is) are reported to prevent cardiovascular events by a mechanism possibly including diuresis and sodium excretion. In this respect, diuresis-induced compensatory upregulation of the renin-angiotensin-aldosterone (RAA) system should be clarified and we performed a randomized controlled trial using dapagliflozin, an SGLT2I. Hypertensive diabetic patients taking angiotensin-converting enzyme inhibitors or angiotensin II receptor blockers were randomly assigned to a dapagliflozin group (DAPA) or a control group (CTRL) with the difference in the changes in plasma renin activity (PRA) after 24 weeks of the treatment as the primary outcome. PRA, plasma aldosterone concentration (PAC), age, sex, BMI, blood pressure, pulse rate, eGFRcys, and HbA1c were not different between the groups at baseline. After 24 weeks, the changes in the PRA from the baseline of the DAPA (n = 44) and CTRL (n = 39) groups were 6.30 ± 15.55 and 1.42 ± 11.43 ng/mL/h, respectively (p = 0.11) although the power of detection was too small. However, post hoc nonparametric analyses revealed that there was a definite increase in the PRA and PAC in the DAPA group (p < 0.0001 and p = 0.00025, respectively) but not in the CTRL group. The PRA in the DAPA group after 24 weeks treatment was significantly elevated compared to the CTRL group (p = 0.013) but not for the PAC. Accordingly, it would be suggested that dapagliflozin may not induce a profound increase, if any, in PAC after 24 weeks of treatment in hypertensive type 2 diabetic patients under RAA suppression.
SODIUM–GLUCOSE COTRANSPORTER-2 INHIBITORS (SGLT2IS), which have been recently developed as antidiabetic agents, suppress the absorption of sodium and glucose in the S1 segment of the proximal tubule. This class of drugs improves not only blood glucose control, but also other metabolic and non-metabolic factors including body weight, blood pressure, lipid profile, uric acid concentration, and erythropoiesis as well as the regulation of steatosis and ketone handling. Clinical trials have revealed that empagliflozin [1] and canagliflozin [2, 3] reduce the incidence of major adverse cardiovascular events, such as heart failure, all-cause mortality, and renal events in cardiovascular outcomes trials. Those benefits were more than generally anticipated. Recent guidelines [4] reflect these results and recommend the use of SGLT2Is for type 2 diabetic patients with atherosclerotic cardiovascular risk factors. Several mechanisms for the favorable effects of SGLT2Is on cardiovascular and renal outcomes have been advocated. Among them, hemodynamic and volume-related effects by osmotic diuresis and sodium excretion, rather than effects on vascular or myocardial remodeling, are assumed to be critical factors contributing to cardio-renal protection, since the manifestation of their benefits occurred as early as 3 months after the start of treatment in the EMPA-REG trial [1]. Similarly, the ALLHAT study [5] revealed that chlorthalidone, a thiazide-like diuretic, prevented heart failure from the very early stage of the trial, compared with amlodipine and lisinopril.
The renin-angiotensin-aldosterone (RAA) system (RAS) is profoundly associated with the development of cardiovascular complications. The effects of medications on the RAA system are well established for the prevention of heart failure or the progression of diabetic renal diseases. The status of the systemic RAA system can usually be assessed by measuring the plasma renin activity (PRA) and the plasma aldosterone concentration (PAC), which can be affected by salt intake, sympathetic nervous activity, or many antihypertensive medications including diuretics and RAA system inhibitors (RAIs), such as angiotensin-converting enzyme (ACE) inhibitors and angiotensin II receptor blockers (ARBs). PRA and PAC are usually suppressed by a high salt intake, while they are enhanced by sympathetic activity. RAIs can increase PRA and decrease PAC by decreasing angiotensin II-mediated intracellular Ca2+ concentrations in juxtaglomerular cells and in adrenal glomerulosa cells, respectively. Thus, the diuretic effect of SGLT2Is in patients taking an RAI may further upregulate the RAA system, which could in turn lead to possible adverse effects on cardiovascular organs. Because many patients with diabetes are often treated with a combination of an RAI and an SGLT2I, evaluations of the RAA status in such situation are all the more clinically important. However, how SGLT2Is affect the RAA system remains unclear. In this study, we examined the effect of the SGLT2I dapagliflozin on the systemic RAA status in patients with type 2 diabetes and hypertension who were taking RAIs.
Research Design and Methods
Study design and participants
This study was a multi-centered, randomized, parallel-group trial of patients with Japanese type 2 diabetes and hypertension who had been taking an RAI(s) for at least 8 weeks at the time of screening. After obtaining informed consent, screening was performed 1 to 8 weeks before randomization. The treatment period was 24 weeks, and physiological as well as biochemical parameters were measured during outpatient visits occurring at 0, 4, and 24 weeks (Fig. 1).

The study protocol has been approved by the Certified Review Board “Clinical Research Review Board (CRRB) of Saitama Medical University” (Certification Number of the Board: CRB3180022) and registered in the jRCT with the registration number JRCTs031180272 (formerly in the UMIN system with the identification number UMIN00002117). All the patients provided written informed consent for participation in the trial. The study was performed according to the ethical principles of the Declaration of Helsinki and was overseen by an independent data monitoring committee.
The trial enrolled individuals aged 20–74 years with type 2 diabetes, with HbA1c levels of 6.5%–7.5% within a 1% fluctuation during the last 3 months, a body-mass index (BMI) of ≥22.0 kg/m2, an eGFRcys ≥45 mL/min/1.73 m2, and no past administration of SGLT2Is during the last 4 months. The exclusion criteria included type 1 diabetes; a blood pressure ≥160/100 mmHg; a history of hypersensitivity to SGLT2Is; severe ketosis; diabetic coma or precoma; severe infection; a perioperative period; severe trauma; severe renal dysfunction or end-stage renal disease requiring hemodialysis; pulmonary embolism or severe lung diseases; dysfunction of the pituitary or adrenal glands; malnutrition or starvation; alcoholism; history of severe liver disease; dehydrated state caused by diarrhea, nausea, gastrointestinal dysfunction or malignancy; malignant tumor; and the possibility of pregnancy or present breast feeding. Individuals were also excluded if they had taken direct renin inhibitors or β- or αβ-blockers during the last 4 months or diuretics during the last 2 months or if they had received dual treatment with ACE inhibitors and ARBs.
Randomization
Patients were randomly assigned in a 1:1 ratio to either a dapagliflozin treatment group (DAPA) or a control group (CTRL) using a computer program. The numbers of subjects enrolled at each facility were 51 at Saitama Medical University Hospital, 22 at Cares Sapporo Hokko Memorial Clinic, 19 at Japanese Red Cross Ogawa Hospital, and less than 10 at the other facilities. Among the 114 subjects in total who provided informed consent, 10 patients with unclear eligibility criteria (i.e., lacking required data) and 9 disqualified patients were excluded. Accordingly, 95 patients were randomly assigned into two groups. Among the 50 patients assigned to the DAPA group, 44 completed the study protocol, while among the 45 patients assigned to the CTRL group, 39 completed the study protocol (Fig. 2).
Procedures
The study registration period was from May 2, 2016, to April 30, 2018, while the follow-up period was from May 2, 2016, to December 31, 2019. Informed consent for registration was acquired within 0–56 days before the start of the study. Randomization was performed 7–56 days after screening. During the study period, patients in the DAPA group received 5 mg of dapagliflozin once a day and were instructed to drink another 100 mL of water or tea after every meal and at bedtime (total 400 mL), in addition to their usual daily water intake. Medications for patients in the control group were continued without modification. At 12 weeks (±2 weeks) after the start of the study protocol, the dose of dapagliflozin could be increased to 10 mg in the DAPA group and the medications in the CTRL group could be modified if the HbA1c level was greater than 7.5% (Fig. 1). No other adjustments were allowed during the study period.
Outcomes
The primary outcome measure was the change in PRA from the baseline at randomization until the last visit at 24 weeks after the start of dapagliflozin administration in the full analysis set. The secondary endpoints were changes in body weight; BMI; systolic and diastolic blood pressure; pulse rate; WBC, RBC, and platelet counts; hemoglobin concentration; hematocrit; biochemical parameters including serum total cholesterol, HDL-cholesterol, triglyceride, cystatin-C, eGFRcys, creatinine, BUN, uric acid, Na, K, Cl, and HbA1c; fasting plasma glucose; PAC, AVP, and BNP; and general urinalysis findings as well as urinary concentration of Na and K. A safety assessment was performed based on adverse event reports and ECG changes.
Laboratory measurements
Blood sampling was performed before 10 a.m. after an overnight fast with water intake to prevent dehydration. After the patients had spent 15 min in a quiet rest in a recumbent or supine position, blood samples were withdrawn to determine the laboratory parameters using routine methods. Participants were advised to avoid excess salt restriction or overload for at least 3 days before the blood sampling.
Statistical analysis
Using a previously published paper [6] reporting the data of PRA in Japanese subjects with RAI administration, we adopted a value of 2.4 ng/mL/h, the baseline characteristics (i.e., before the administration of other anti-hypertensives) as the presumed PRA value for the CTRL group, although the study subjects of this paper [6] were on other antihypertensives such as β-blockers (24%) that will lower PRA; and thiazide (24%) and loop (11%) diuretics that will raise PRA. To verify its 20% difference (0.5 ng/mL/h) between the CTRL and DAPA groups, which we regarded as being a clinically significant difference, the necessary number of participants was estimated to be 64 with an 80% power and a two-sided significance level of 5%, assuming a standard deviation of 1.0 ng/mL/h based on a previous article [7] describing a general population of Japanese subjects. Thus, we did not use the data of the above-mentioned paper [6] for the estimate of the standard deviation because it was deemed to be inappropriate due to the concomitant blood pressure lowering medications, although this substitution might have underestimated the sample size. Hence, we set the planned sample size to 140, which would account for a possible drop-out rate of 10%.
All the data were analyzed using SAS® software version 9.2 for Windows® (SAS Institute, Cary, North Carolina, USA) and Microsoft Excel 2016® for Windows® (Microsoft Corporation, Redmond, Washington, USA). Categorical variables were presented as frequencies and percentages. Continuous variables were presented as the mean ± SD value or median and interquartile range (in the square brackets). Welch’s t-test and ANCOVA, χ2 test and Fisher’s exact test were used for continuous and categorical variables, respectively. In addition, Wilcoxon rank-sum and signed-rank test was performed for PRA and PAC data because of their distribution. A two-sided p value of less than 0.05 was deemed significant.
Role of the funding source
This trial was an investigator-initiated study. The study’s funding sources had no role in the study design, data collection, data analysis, data interpretation, or writing of the report. All the study data were collected and retained by the investigators and were not made available to the funding sources. The corresponding author had full access to all the data in the study and had final responsibility for the decision to submit the manuscript for publication.
Results
Participants and background characteristics
Among the 50 patients assigned to the DAPA group, one patient withdrew consent and two patients did not receive dapagliflozin; these 3 patients were excluded. Among the 45 patients assigned to the CTRL group, 3 patients were excluded because of protocol violations. As a result, we enrolled 47 patients in the DAPA group and 42 patients in the CTRL group; after the exclusion of dropouts, 44 and 39 patients were analyzed in the DAPA and CTRL groups, respectively (Fig. 2). Consequently, the power to detect a difference in the PRA change between the two groups decreased to 66.9%.
The background characteristics of the DAPA group are shown in Table 1. Patient age (64.7 ± 6.3 years), sex (male, 53.2%), complications other than hypertension (89.4%), body weight (68.9 ± 11.8 kg), BMI (26.4 ± 3.7 kg/m2), blood pressure (138.7 ± 16.7/75.2 ± 11.7 mmHg), pulse rate (77.0 ± 13.7 bpm), eGFRcys (87.7 ± 22.3 mL/min/m2), and HbA1c (7.33% ± 0.53%) as well as the Na and K levels in serum and urine were not statistically different between the DAPA and CTRL groups at the start of the study. The RAIs used in this study are shown in Table 2. Most of the patients, except for 5 ACE inhibitor-treated patients in the DAPA group, had been receiving ARBs. The PRA (4.69 ± 6.45 ng/mL/h vs. 5.33 ± 9.01 ng/mL/h; DAPA vs. CTRL) and PAC (89.2 ± 35.5 pg/mL vs. 101.5 ± 44.3 pg/mL; ditto) values at baseline were also comparable.
Table 1
Baseline characteristics and parameters
| Parameter |
DAPA (n = 47) |
CTRL (n = 42) |
p value |
| Age (years old) |
<65 |
18 (38.3%) |
15 (35.7%) |
0.83 |
| ≥65 |
29 (61.7%) |
27 (64.3%) |
| mean ± SD |
64.7 ± 6.3 |
63.0 ± 9.4 |
0.33 |
| Sex |
male |
25 (53.2%) |
23 (54.8%) |
1.00 |
| female |
22 (46.8%) |
19 (45.2%) |
| Past illness |
– |
22 (46.8%) |
19 (45.2%) |
1.00 |
| + |
25 (53.2%) |
23 (54.8%) |
| With hypertension |
– |
0 (0%) |
0 (0%) |
— |
| + |
47 (100%) |
42 (100%) |
| Complications other than hypertension |
– |
5 (10.6%) |
4 (9.5%) |
1.00 |
| + |
42 (89.4%) |
38 (90.5%) |
| PRA (ng/mL/h) |
mean ± SD |
4.69 ± 6.45 |
5.33 ± 9.01 |
0.70 |
| median [interquartile range] |
1.9 [0.9–5.6] |
2.25 [1.00–4.50] |
0.83 |
| PAC (pg/mL) |
mean ± SD |
89.2 ± 35.5 |
101.5 ± 44.3 |
0.15 |
| median [interquartile range] |
86.0 [65.0–103.0] |
90.0 [75.3–117.0] |
0.16 |
| Body weight (kg) |
68.9 ± 11.8 |
68.9 ± 11.5 |
0.98 |
| BMI (kg/m2) |
26.4 ± 3.7 |
26.2 ± 3.9 |
0.80 |
| Systolic BP (mmHg) |
138.7± 16.7 |
134.7 ± 13.1 |
0.21 |
| Diastolic BP (mmHg) |
75.2 ± 11.7 |
74.8 ± 10.6 |
0.87 |
| Pulse rate |
77.0 ± 13.7 |
76.5 ± 13.7 |
0.86 |
| WBC (/μL) |
6,310 ± 1,609 |
6,031 ± 2,071 |
0.48 |
| RBC (104/μL) |
457 ± 57 |
450 ± 42 |
0.50 |
| Hb (g/dL) |
13.8 ± 1.6 |
13.5 ± 1.2 |
0.25 |
| Ht (%) |
41.3 ± 4.7 |
40.2 ± 3.5 |
0.21 |
| PLT (104/μL) |
21.5 ± 4.8 |
22.8 ± 6.9 |
0.32 |
| TC (mg/dL) |
172.5 ± 32.0 |
170.9 ± 34.1 |
0.82 |
| HDLC (mg/dL) |
55.3 ± 13.5 |
52.1 ± 13.5 |
0.26 |
| TG (mg/dL) |
139.2 ± 84.5 |
134.6 ± 70.0 |
0.78 |
| Cys-C (mg/L) |
0.85 ± 0.19 |
0.82 ± 0.16 |
0.35 |
| eGFRcys (mL/min/1.73 m2) |
87.7 ± 22.3 |
91.6 ± 19.0 |
0.38 |
| Cr (mg/dL) |
0.73 ± 0.20 |
0.75 ± 0.23 |
0.55 |
| BUN (mg/dL) |
15.2 ± 5.0 |
15.0 ± 5.5 |
0.90 |
| UA (mg/dL) |
5.47 ± 1.25 |
5.05 ± 1.34 |
0.14 |
| Na (mEq/L) |
140.5 ± 1.6 |
139.8 ± 2.0 |
0.06 |
| K (mEq/L) |
4.29 ± 0.35 |
4.21 ± 0.40 |
0.35 |
| Cl (mEq/L) |
103.9 ± 1.9 |
103.5 ± 32.4 |
0.30 |
| HbA1c (%) |
7.33 ± 0.53 |
7.26 ± 0.46 |
0.50 |
| fasting BG (mg/dL) |
148.0 ± 29.4 |
152.6 ± 30.9 |
0.48 |
| AVP (pg/mL) |
1.89 ± 1.02 |
2.49 ± 2.10 |
0.10 |
| BNP (pg/mL) |
12.5 ± 12.5 |
11.1 ± 12.1 |
0.59 |
| urine specific gravity |
1.014 ± 0.007 |
1.015 ± 0.006 |
0.58 |
| urine Na (mEq/L) |
108.4 ± 53.8 |
113.5 ± 52.6 |
0.65 |
| urine K (mEq/L) |
40.9 ± 20.1 |
43.9 ± 22.1 |
0.50 |
| urine Cr (mg/dL) |
68.9 ± 43.4 |
82.0 ± 46.2 |
0.17 |
| urine protein |
– |
31 (66.0%) |
24 (57.1%) |
0.72 |
| ± |
8 (17.0%) |
10 (23.8%) |
| + |
3 (6.4%) |
2 (4.8%) |
| 2+ |
4 (8.5%) |
6 (14.3%) |
| 3+ |
0 (0.0%) |
0 (0.0%) |
| 4+ |
1 (2.1%) |
0 (0.0%) |
| urine sugar |
– |
41 (87.2%) |
31 (73.8%) |
0.20 |
| ± |
0 (0.0%) |
4 (9.5%) |
| + |
1 (2.1%) |
2 (4.8%) |
| 2+ |
2 (4.3%) |
1 (2.4%) |
| 3+ |
3 (6.4%) |
3 (7.1%) |
| 4+ |
0 (0.0%) |
1 (2.4%) |
DAPA, patients treated by dapagliflozin; CTRL, control patients
Table 2
RAS inhibitors used in the study
| Class |
RAS inhibitor |
DAPA |
CTRL |
| ARB |
telmisartan |
13 |
15 |
| azilsartan |
10 |
3 |
| olmesartan |
6 |
6 |
| losartan |
5 |
10 |
| irbesartan |
3 |
5 |
| valsartan |
3 |
1 |
| candesartan |
2 |
2 |
| ACE inhibitor |
enalapril |
5 |
|
| Total |
47 |
42 |
DAPA, patients treated by dapagliflozin; CTRL, control patients
We were unable to obtain conclusive evidence regarding the primary outcome, i.e., the difference in the PRA change between the two groups, because of the decreased power (66.9%) for the detection of such a difference (Fig. 3A). Among the secondary outcomes, the PAC after 24 weeks was similar and the difference between the two groups was not significant (DAPA, 103.0 ± 38.7 pg/mL; CTRL, 108.1 ± 65.1 pg/mL); at this time point, the difference from the CTRL group to the DAPA group was –5.1 pg/mL (95% confidence interval: –29.0–18.8 pg/mL; p = 0.67) (for the changes after 24 weeks from the baseline were 13.3 ± 27.5 and 8.1 ± 41.2 pg/mL, for the DAPA and CTRL groups, respectively; p = 0.51). After treatment with dapagliflozin for 24 weeks, the fasting plasma glucose level (–14.5 ± 31.6 mg/dL), HbA1c (–0.38%), body weight (–2.05 ± 2.49 kg), BMI (–0.79 ± 0.96 kg/m2), serum uric acid concentration (–0.5 ± 0.86 mg/dL), K level (–0.06 ± 0.26 mEq/L), and BNP (–3.37 ± 9.89 pg/mL) were significantly decreased, while the Ht (2.25% ± 1.86%), Hb (0.64 ± 0.54 g/dL), and AVP (0.51 ± 1.27 pg/mL) were significantly higher in the DAPA group than in the CTRL group (Table 3). After 24 weeks of dapagliflozin administration, the PRA increased up to 10.75 ± 18.19 ng/mL/h, but this value was not significantly different from that seen in the CTRL group (6.44 ± 11.56 ng/mL/h, p = 0.20). The difference from the baseline was 6.30 ± 15.55 and 1.42 ± 11.43 ng/mL/h, for the DAPA and CTRL groups, respectively (p = 0.11 between the groups). The PAC after 24 weeks was also slightly increased to 103.0 ± 38.7 pg/mL, but this value was not significantly different from that seen in the CTRL group (108.1 ± 65.1 pg/mL, p = 0.67).
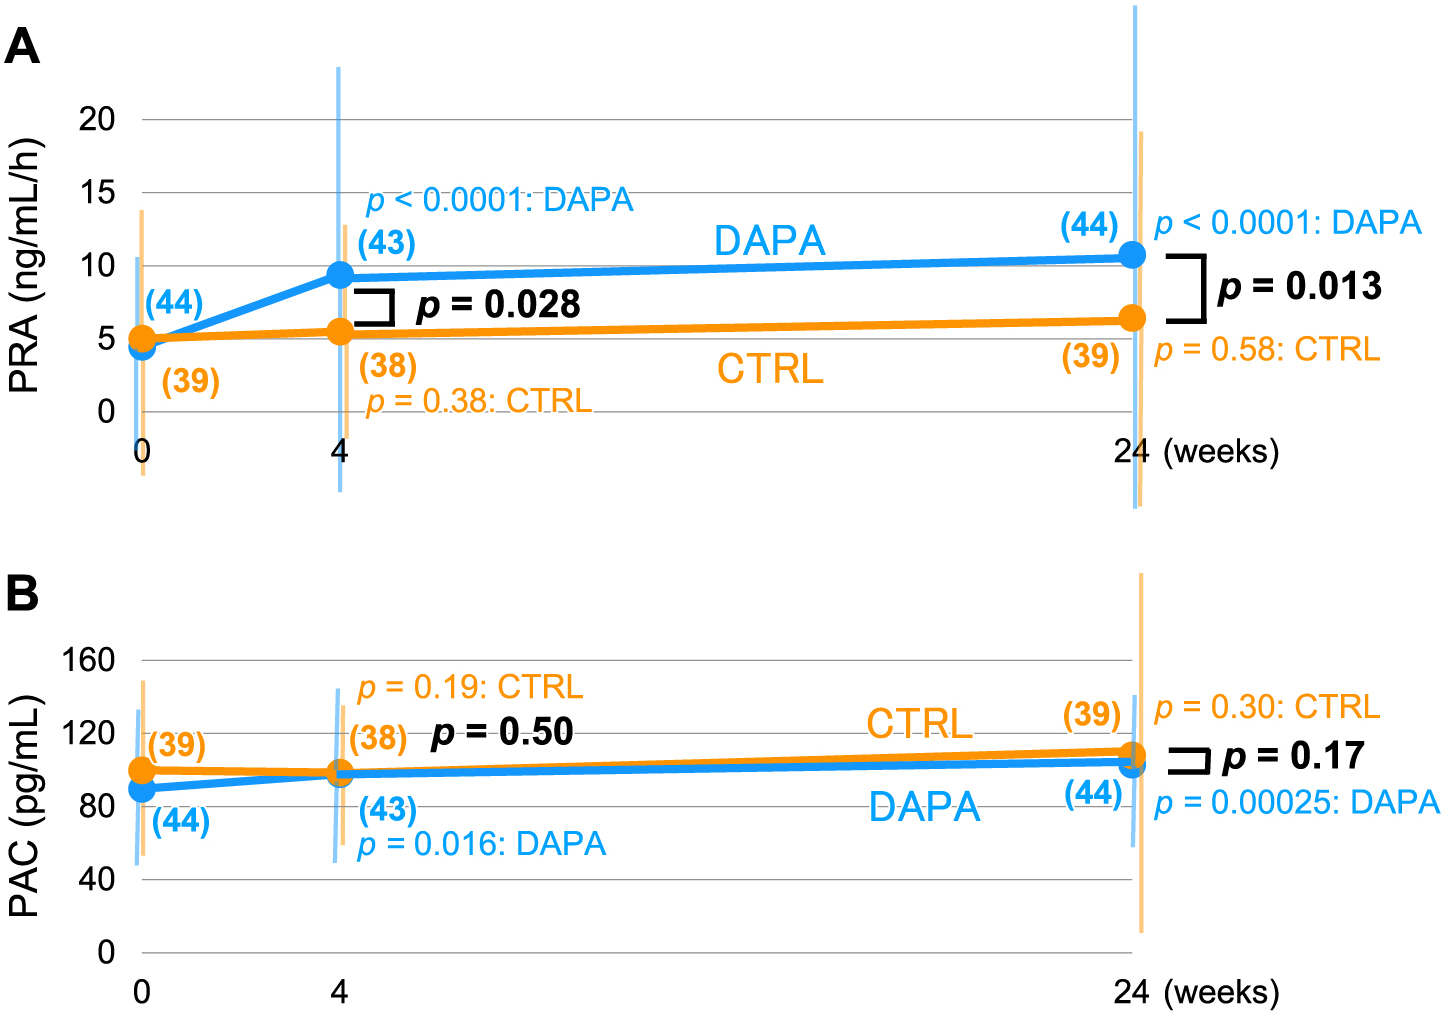
Table 3
Changes of physical and biochemical parameters from the baseline and difference between the DAPA and the CTRL groups
| Δ parameter |
DAPA (n = 44) |
CTRL (n = 39) |
p value |
| Body weight (kg) |
–2.05 ± 2.49* |
–0.37 ± 1.65 |
0.0005 |
| BMI (kg/m2) |
–0.79 ± 0.96* |
–0.15 ± 0.65 |
0.0006 |
| Systolic BP (mmHg) |
–7.5 ± 0.96* |
–0.15 ± 0.65 |
0.80 |
| Diastolic BP (mmHg) |
–1.3 ± 8.0 |
–0.7 ± 7.9 |
0.74 |
| Pulse rate (bpm) |
0.0 ± 10.2 |
–1.1 ± 12.9# |
0.68 |
| WBC (/μL) |
273 ± 1,107 |
–14 ± 1,347 |
0.30 |
| RBC(×104/μL) |
26.4 ± 18.4* |
–1.0 ± 23.9 |
<0.0001 |
| Hb (g/dL) |
0.64 ± 0.54* |
–0.03 ± 0.66 |
<0.0001 |
| Ht (%) |
2.25 ± 1.86* |
–0.03 ± 2.10 |
<0.0001 |
| PLT (×104/μL) |
–0.19 ± 2.2 |
–0.48 ± 3.71 |
0.67 |
| TC (mg/dL) |
–2.8 ± 24.8 |
–1.8 ± 18.7 |
0.85 |
| HDLC (mg/dL) |
1.7 ± 5.6 |
0.6 ± 5.6 |
0.38 |
| TG (mg/dL) |
8.5 ± 75.6 |
–8.4 ± 34.7 |
0.19 |
| Cys-C (mg/L) |
0.045 ± 0.086* |
0.023 ± 0.072 |
0.21 |
| eGFRcys (mL/min/1.73 m2) |
–4.71 ± 7.23* |
–3.38 ± 7.69* |
0.42 |
| Cr (mg/dL) |
0.030 ± 0.082* |
0.018 ± 0.085 |
0.52 |
| BUN (mg/dL) |
4.37 ± 17.8 |
–0.37 ± 3.03 |
0.09 |
| UA (mg/dL) |
–0.5 ± 0.86* |
0.35 ± 0.80*# |
<0.0001 |
| Na (mEq/L) |
0.1 ± 1.5 |
–0.5 ± 1.9 |
0.11 |
| K (mEq/L) |
–0.06 ± 0.26 |
0.12 ± 0.36 |
0.016 |
| Cl (mEq/L) |
0.5 ± 1.9 |
–0.2 ± 1.9 |
0.13 |
| HbA1c (%) |
–0.38 ± 0.59* |
0.11 ± 0.57 |
0.0002 |
| fasting BG (mg/dL) |
–14.5 ± 31.6* |
0.11 ± 34.9* |
0.0006 |
| AVP (pg/mL) |
0.51 ± 1.27* |
–0.16 ± 1.35 |
0.024 |
| BNP (pg/mL) |
–3.37 ± 9.89* |
3.85 ± 10.72 |
0.0022 |
| urinary specific gravity |
0.0053 ± 0.0085* |
0.0001 ± 0.0072 |
0.0035 |
| urine Na (mEq/L) |
–1.57 ± 49.7* |
–8.7 ± 54.4 |
0.54 |
| urine K (mEq/L) |
–7.28 ± 20.1* |
–4.67 ± 22.8 |
0.58 |
| urine Cr (mg/dL) |
–11.1 ± 41.0 |
–3.41 ± 54.7 |
0.047 |
| Na/gCr (mEq/gCr) |
–4.5 ± 110 |
8.4 ± 122 |
0.61 |
| K/gCr (mEq/gCr) |
–2.7 ± 20.4 |
3.3 ± 32.0 |
0.31 |
| Na/K ratio |
0.01 ± 1.82 |
0.25 ± 1.81 |
0.54 |
BP, blood pressure; *, p < 0.05 baseline vs. 24 weeks; #, n = 38
Because the obtained data for the PRA and PAC did not fit normal distribution, we added post hoc analysis using nonparametric statistics retroactively. Although the absolute values of the PRA as well as PAC did not statistically different at each time point including the baseline (PRA: 1.90 [0.90–5.60] ng/mL/h vs. 2.25 [1.00–4.50] ng/mL/h; DAPA vs. CTRL and PAC: 86.0 [65.0–103.0] pg/mL vs. 90.0 [75.3–117.0] pg/mL; ditto) (Table 1), the increase in the PRA was significant both at 4- and 24-week visits (p < 0.0001 for each) in the DAPA group but not in the CTRL group (p = 0.38 and 0.58 for 4 and 24 weeks, respectively) (Fig. 3A). Similarly for the PAC, significant increase was observed in the DAPA group (p = 0.016 and 0.00025 for 4 and 24 weeks, respectively) whereas there was no temporal difference in the CTRL group (p = 0.19 and 0.30 for 4 and 24 weeks, respectively) (Fig. 3B).
However, regarding the changes from the baseline, i.e., with the baseline data subtracted, it is noteworthy that there observed no difference for the PAC between the two groups (p = 0.17 at 24 weeks) (Fig. 3B) despite that there was significant elevation of the PRA in the DAPA over the CTRL group (p = 0.013 at 24 weeks) (Fig. 3A).
Salt status of participants
The urinary sodium excretion estimated using spot analyses was 192.9 ± 109.4 mEq/gCr in the DAPA group and 174.6 ± 99.8 mEq/gCr in the CTRL group; the difference between the two groups was not significant, and no changes relative to the baseline values were observed at 4 and 24 weeks in either group (Table 4). The ratio of Na/K, another parameter for salt status, was also comparable between the two groups, and no changes from baseline were seen in either group (Table 4).
Table 4
Salt status during the study
| Parameter |
group |
0 week |
4 weeks |
24 weeks |
p value |
| n |
n |
n |
| Na/gCr (mEq/gCr) |
DAPA |
44 192.9 ± 109.4 |
43 183.3 ± 108.8 |
44 188.4 ± 91.3 |
0.61 |
| CTRL |
39 174.6 ± 99.8 |
38 172.8 ± 101.6 |
39 183.0 ± 121.0 |
| Na/K ratio |
DAPA |
44 3.01 ± 1.78 |
43 2.86 ± 1.42 |
44 3.02 ±1.23 |
0.54 |
| CTRL |
39 3.16 ± 1.59 |
38 3.11 ± 1.71 |
39 3.41 ± 2.00 |
DAPA, patients treated by dapagliflozin; CTRL, control patients
Adverse events were reported in 27.7% of the DAPA participants and 15.6% of the CTRL participants, respectively (Table 5). Among them, probable side effects of dapagliflozin were observed in 17% of the subjects. Except for one patient who was hospitalized because of an alcohol-induced transient consciousness disturbance, the other adverse effects were not severe, and the safety of dapagliflozin was confirmed in the present study (Table 6). Other side effects included one case of genital itchiness, one case of progressive liver dysfunction, one case of hypoglycemia, 2 cases of hypoglycemic symptoms, one case of skin itchiness, and one case of pollakiuria. No pathological changes in the electrocardiogram findings were observed in either group at the end of the study (data not shown).
Table 5
Adverse events during the study
|
DAPA (n = 47) |
CTRL (n = 45) |
| numbers of patients |
13 (27.7%) |
7 (15.6%) |
| numbers of cases |
15 |
10 |
| adverse event |
|
|
| dizziness |
|
1 (2.2%) |
| ich by rosuvastatin |
|
1 (2.1%) |
| consciousness disturbance |
1 (2.1%) |
|
| genital itch |
1 (2.1%) |
|
| cat bite of right forearm |
|
1 (2.1%) |
| progression of liver dysfunction |
1 (2.1%) |
|
| blood pressure elevation |
|
1 (2.1%) |
| worsening of hyperuricemia |
|
1 (2.1%) |
| cut of left index finger by knife |
1 (2.1%) |
|
| edema of extremities |
|
1 (2.1%) |
| gout attack |
1 (2.1%) |
|
| hypoglycemia |
1 (2.1%) |
|
| hypoglycemic symptom |
2 (4.3%) |
|
| injury of lower jaw by fall |
1 (2.1%) |
|
| headache due to lower jaw injury |
1 (2.1%) |
|
| diabetic macular edema |
1 (2.1%) |
|
| head injury |
|
1 (2.1%) |
| worsening of urine sugar |
|
1 (2.1%) |
| skin itchiness |
|
|
| skin abscess |
|
1 (2.1%) |
| frequent urination |
1 (2.1%) |
|
| insomnia |
1 (2.1%) |
|
| peripheral neuropathy |
|
1 (2.1%) |
| lightheadedness |
1 (2.1%) |
|
DAPA, patients treated by dapagliflozin; CTRL, control patients
Table 6
Side effects of dapagliflozin treatment group
|
DAPA (n = 47) |
| number of cases (incident rate %) |
8 (17.0%) |
| adverse event |
|
| genital itch |
1 (2.1%) |
| progression of liver dysfunction |
1 (2.1%) |
| hypoglycemia |
1 (2.1%) |
| symptom of hypoglycemia |
2 (4.3%) |
| itchy skin |
1 (2.1%) |
| frequent urination |
1 (2.1%) |
| lightheadedness |
1 (2.1%) |
Discussion
Renin is the initial and rate-limiting step in the RAS, and many experimental and clinical studies have provided evidence that inadequate RAS activation can lead to both vascular injury and the injury of organs including the brain, heart, and kidney [8]. Several studies have suggested that a higher PRA is associated with a greater susceptibility to cardiovascular diseases [9] or death [10], even among patients taking ACE inhibitors [11], although these results are somewhat controversial [12]. Hyperaldosteronism through the activation of the mineralocorticoid receptor (MR) also induces cardiovascular damage, and mineralocorticoid receptor antagonists (MRAs) reportedly ameliorate the course of heart failure (RALES [13] and EPHESUS [14] studies) and the renal function of non-diabetic patients (EVALUATE study [15]). The aldosterone-mediated MR signal is sensitized by a high salt intake and the small G-protein Rac1 [16]. PAC is regulated by not only angiotensin II, but also ACTH and the extracellular K+ concentration. Thus, the PAC may be less susceptible to PRA-mediated angiotensin II increases induced by volume-depletion. After an initial decline in the PAC in response to RAIs, the PAC has been shown to recover in some subpopulations (10%–53%) [17] over the long-term; this phenomenon is known as aldosterone breakthrough or escape [18-21] and is possibly associated with left ventricular hypertrophy [22], a decreased exercise capacity [23], higher rates of albuminuria [24], and about a 2-fold faster decline in GFR [20]. In this study, the PAC of the patients using RAIs remained almost stable, and no such phenomenon similar to aldosterone breakthrough was observed.
The RAA system is strongly associated with daily sodium intake and can be modulated by antihypertensives such as diuretics and RAA system inhibitors. During constant diuretic therapy, the PRA increases acutely and reaches a maximum within the first week, then decreases during the next two weeks but remains elevated. The increases in PRA and PAC in response to diuretics is correlated with an increase in the plasma angiotensin II concentration [25]. Ipragliflozin treatment for 4 days was previously reported to induce diuresis and a slight elevation in the PRA with no changes in the PAC in 20 Japanese patients with type 2 diabetes and heart failure [26]. However, the study did not set a control group, and most of the participants were receiving both loop diuretics and β-blockers. In another study that did not use a control group, ipragliflozin treatment for 24 weeks did not increase the PRA but significantly increased the PAC in Japanese patients with type 2 diabetes; however, about 50% of this study group were also receiving unknown antihypertensive drugs [27] without setting control groups. Our study is the first to evaluate the effects of an SGLT2I on the RAA system in a controlled trial, demonstrating that dapagliflozin treatment for 24 weeks may not have a remarkable effect on the PRA and especially on the PAC in type 2 diabetic patients receiving RAA system inhibitors when compared with a defined control group.
In addition, we measured the urinary sodium excretion of participants, which reflects their salt intake. The obtained data were consistently around 170–190 mEq/gCr, corresponding to 10–11 g of salt daily; this range is within the range for average salt intake among the Japanese general population. In other words, the SGLT2I did not affect sodium excretion, which was another important point.
Somewhat unexpectedly, no apparent differences in PAC were observed between the two groups, since SGLT2Is have been reported to possess diuretic properties. In fact, empagliflozin [28] and canagliflozin [29] induced transient (1–2 days after initiation) diuresis, probably because of augmented glucose delivery to the tubular lumen of the kidney.
Why does no overt compensational increase in PAC similar to that for thiazide or loop diuretics occur in response to SGLT2I-induced diuresis? The long-term use of an SGLT2I may induce physiological adaptation of the kidney to maintain overall body fluid balance. One possible mechanism is a manner of sodium excretion in response to SGLT2Is that differs from that of classical diuretics. In fact, the interstitial spaces are the other distinct body fluid compartment and equilibrated with intravascular spaces, where Na+ is the predominant cation, and work as a buffering substance by mechanisms involving VEGF-C secretion via mononuclear phagocyte system cells and eNOS-dependent lymph capillary networks [30]. The measurement of human sodium tissue content using 23Na-MRI demonstrated that dapagliflozin treatment for 6 weeks preferentially decreased the skin sodium content by about 5.8% [31], suggesting a distinctive mechanism of Na+ excretion that differs from those of thiazide diuretics and loop diuretics, both of which induce predominantly intravascular Na+ excretion. This preferential sodium excretion from the interstitial space may minimize PRA activation, and hence PAC increase as well. However, the precise mechanisms require further clarification.
Factors that contribute to the cardioprotection induced by SGLT2Is in clinical trials are assumed to improve the preload through natriuresis/osmotic diuresis, blood pressure reduction accompanied by improved vascular function, improved cardiac metabolism and bioenergetics, myocardial Na+/H+ exchange inhibition, and alterations in adipokines or cytokine production as well as the epicardial adipose tissue mass (review [32]). Tubuloglomerular feedback via the increased flow of sodium to the juxtaglomerular apparatus can decrease the intraglomerular pressure, which in turn tends to lead to renal protection.
As an antidiabetic drug, dapagliflozin decreased the fasting plasma glucose and HbA1c levels from the baseline values, and the resulting values were significantly different from those observed in the CTRL group. A body weight reduction, decreased uric acid concentration, and increased hematocrit, all of which have been shown to be the characteristics of SGLT2Is, were also observed in the DAPA group in this study. Only the systolic blood pressure was reduced from the baseline value in the DAPA group, but the difference was not significant, possibly because the number of actual subjects was smaller than the required number. A small, but significant, increase in the AVP and a decrease in the BNP were observed in the DAPA group reflecting the diuretic effect of this agent, although the clinical relevance remains unclear.
This study had some limitations. First, as described above, the sample size was too small to detect the primary outcome. Moreover, if we would have employed a posteriori values of PRA for sample size setting, required number of enrollees would have been much more expanded and the resultant statistical power should have by far diminished. Notably, for PAC, although it was supposed that the value was higher at 24-week visit in the DAPA group than in the CTRL group, the outocome was on the contrary; the former was non-significantly (p = 0.67; by 5.1 pg/mL) lower than the latter. In fact, this evaluation was performed under a condition that increase by dapagliflozin (a 20% of the CTRL group as a non-inferiority margin) would be detected (one-sided p < 0.05) with fairly high (more than 70%) statistical power even on the assumption of normal distribution and when the a posteriori distribution of PAC would have been applied.
In this regard, according to the nonparametric analyses we performed retroactively, we did observe significant increase in the PRA by the SGLT2I administration; but not for PAC even with this PRA elevation at each of 4- and 24-week timepoint clearly appreciated. This could be interpreted as that RAIs might almost negate PAC increase caused by SGLT2Is and hereby act protectively against cardiovascular and renal problems.
Second, the antihypertensives used in this study were limited to only RAIs and calcium channel blockers; diuretics and β-blockers may modulate the RAA system differently when SGLT2Is are administered. Third, improved glucose control in the DAPA group might have exerted some beneficial effect, although relatively small, onto the RAA system through body fluid handling.
Finally, in hypertensive patients with diabetes who are taking an RAI, addition of an SGLT2I class medication transiently increases the PRA further as a result of its diuretic action; PRA, however, is thought to return almost immediately to the near-basal level through compensatory intravascular volume recovery (Fig. 4). Thus, SGLT2Is might possibly help avoid the harmful effects of RAA system activation on the cardiovascular system. In conclusion, treatment with dapagliflozin is apparently safe and has been suggested to have minimal effect on the RAA system in hypertensive type 2 diabetic patients who are being treated with ARBs or ACE inhibitors.
Acknowledgements
We thank Dr. Akiyo Tanabe (National Center for Global Health and Medicine, Tokyo, Japan) and Dr. Rimei Nishimura (Jikei University School of Medicine, Tokyo, Japan) for advices regarding the study protocol. We also thank Dr. Atsushi Goto (Yokohama City University, Kanagawa, Japan) for statistical advice.
Disclosure
This work was supported by AstraZeneca K.K and Ono Pharmaceutical CO., Ltd. through the Nonprofit Organization Hokkaido Health-Science Institute. None of the authors have any potential conflicts of interest associated with this research in person.
References
- 1 Zinman B, Wanner C, Lachin JM, Fitchett D, Bluhmki E, et al. (2015) Empagliflozin, cardiovascular outcomes, and mortality in type 2 diabetes. N Engl J Med 373: 2117–2128.
- 2 Neal B, Perkovic V, Mahaffey KW, de Zeeuw D, Fulcher G, et al. (2017) Canagliflozin and cardiovascular and renal events in type 2 diabetes. N Engl J Med 377: 644–657.
- 3 Perkovic V, Jardine MJ, Neal B, Bompoint S, Heerspink HJL, et al. (2019) Canagliflozin and renal outcomes in type 2 diabetes and nephropathy. N Engl J Med 380: 2295–2306.
- 4 American Diabetes Association (2019) Standards of medical care in diabetes-2019 Abridged for Primary Care Providers. Clin Diabetes 37: 11–34.
- 5 ALLHAT Officers and Coordinators for the ALLHAT Collaborative Research Group (2002) Major outcomes in high-risk hypertensive patients randomized to angiotensin-converting enzyme inhibitor or calcium channel blocker vs. diuretic: The Antihypertensive and Lipid-Lowering Treatment to Prevent Heart Attack Trial (ALLHAT). JAMA 288: 2981–2997.
- 6 Kanaoka T, Tamura K, Wakui H, Ohsawa M, Azushima K, et al. (2013) L/N-type calcium channel blocker cilnidipine added to renin-angiotensin inhibition improves ambulatory blood pressure profile and suppresses cardiac hypertrophy in hypertension with chronic kidney disease. Int J Mol Sci 14: 16866–16881.
- 7 Uzu T, Nakamura T, Ashida N, Togashi K (2016) Development and evaluation of EIA for the detection of plasma renin activity. Jpn J Med Pharm Sci 73: 311–321 (In Japanese).
- 8 Struthers AD, MacDonald TM (2004) Review of aldosterone- and angiotensin II-induced target organ damage and prevention. Cardiovasc Res 61: 663–670.
- 9 Brunner HR, Laragh JH, Baer L, Newton MA, Goodwin FT, et al. (1972) Essential hypertension: renin and aldosterone, heart attack and stroke. N Engl J Med 286: 441–449.
- 10 Parikh NI, Gona P, Larson MG, Wang TJ, Newton-Cheh C, et al. (2007) Plasma renin and risk of cardiovascular disease and mortality: the Framingham Heart Study. Eur Heart J 28: 2644–2652.
- 11 Campbell DJ, Woodward M, Chalmers JP, Colman SA, Jenkins AJ, et al. (2005) Prediction of myocardial infarction by N-terminal-pro-B-type natriuretic peptide, C-reactive protein, and renin in subjects with cerebrovascular disease. Circulation 112: 110–116.
- 12 Meade TW, Cooper JA, Peart WS (1993) Plasma renin activity and ischemic heart disease. N Engl J Med 329: 616–619.
- 13 Pitt B, Zannad F, Remme WJ, Cody R, Castaigne A, et al. (1999) The effect of spironolactone on morbidity and mortality in patients with severe heart failure. Randomized Aldactone Evaluation Study Investigators. N Engl J Med 341: 709–717.
- 14 Zannad F, McMurray JJV, Krum H, van Veldhuisen DJ, Swedberg K, et al. (2011) Eplerenone in patients with systolic heart failure and mild symptoms. N Engl J Med 364: 11–21.
- 15 Ando K, Ohtsu H, Uchida S, Kaname S, Arakawa Y, et al. (2014) Anti-albuminuric effect of the aldosterone blocker eplerenone in non-diabetic hypertensive patients with albuminuria: a double-blind, randomised, placebo-controlled trial. Lancet Diabetes Endocrinol 2: 944–953.
- 16 Nagase M, Fujita T (2013) Role of Rac1-mineralocorticoid-receptor signalling in renal and cardiac disease. Nat Rev Nephrol 9: 86–98.
- 17 Bomback AS, Klemmer PJ (2007) The incidence and implications of aldosterone breakthrough. Nat Clin Pract Nephrol 3: 486–492.
- 18 Cicoira M, Zanolla L, Rossi A, Golia G, Franceschini L, et al. (2001) Failure of aldosterone suppression despite angiotensin-converting enzyme (ACE) inhibitor administration in chronic heart failure is associated with ACE DD genotype. J Am Coll Cardiol 37: 1808–1812.
- 19 MacFadyen RJ, Lee AF, Morton JJ, Pringle SD, Struthers AD (1999) How often are angiotensin II and aldosterone concentrations raised during chronic ACE inhibitor treatment in cardiac failure? Heart 82: 57–61.
- 20 Schjoedt KJ, Andersen S, Rossing P, Tarnow L, Parving HH (2004) Aldosterone escape during blockade of the renin-angiotensin-aldosterone system in diabetic nephropathy is associated with enhanced decline in glomerular filtration rate. Diabetologia 47: 1936–1939.
- 21 Staessen J, Lijnen P, Fagard R, Verschueren LJ, Amery A (1981) Rise in plasma concentration of aldosterone during long-term angiotensin II suppression. J Endocrinol 91: 457–465.
- 22 Sato A, Saruta T (2001) Aldosterone escape during angiotensin-converting enzyme inhibitor therapy in essential hypertensive patients with left ventricular hypertrophy. J Int Med Res 29: 13–21.
- 23 Cicoira M, Zanolla L, Franceschini L, Rossi A, Golia G, et al. (2002) Relation of aldosterone “escape” despite angiotensin-converting enzyme inhibitor administration to impaired exercise capacity in chronic congestive heart failure secondary to ischemic or idiopathic dilated cardiomyopathy. Am J Cardiol 89: 403–407.
- 24 Sato A, Hayashi K, Naruse M, Saruta T (2003) Effectiveness of aldosterone blockade in patients with diabetic nephropathy. Hypertension 41: 64–68.
- 25 Lijnen P, Fagard R, Staessen J, Amery A (1981) Effect of chronic diuretic treatment on the plasma renin-angiotensin-aldosterone system in essential hypertension. Br J Clin Pharmacol 12: 387–392.
- 26 Takeuchi T, Dohi K, Omori T, Moriwaki K, Sato Y, et al. (2015) Diuretic effects of sodium-glucose cotransporter 2 inhibitor in patients with type 2 diabetes mellitus and heart failure. Int J Cardiol 201: 1–3.
- 27 Nomiyama T, Shimono D, Horikawa T, Fujimura Y, Ohsako T, et al. (2018) Efficacy and safety of sodium-glucose cotransporter 2 inhibitor ipragliflozin on glycemic control and cardiovascular parameters in Japanese patients with type 2 diabetes mellitus; Fukuoka Study of Ipragliflozin (FUSION). Endocr J 65: 859–867.
- 28 Yasui A, Lee G, Hirase T, Kaneko T, Kaspers S, et al. (2018) Empagliflozin induces transient diuresis without changing long-term overall fluid balance in Japanese patients with type 2 diabetes. Diabetes Ther 9: 863–871.
- 29 Iijima H, Kifuji T, Maruyama N, Inagaki N (2015) Pharmacokinetics, pharmacodynamics, and safety of canagliflozin in Japanese patients with type 2 diabetes mellitus. Adv Ther 32: 768–782.
- 30 Machnik A, Neuhofer W, Jantsch J, Dahlmann A, Tammela T, et al. (2009) Macrophages regulate salt-dependent volume and blood pressure by a vascular endothelial growth factor-C-dependent buffering mechanism. Nat Med 15: 545–552.
- 31 Karg MV, Bosch A, Kannenkeril D, Striepe K, Ott C, et al. (2018) SGLT-2-inhibition with dapagliflozin reduces tissue sodium content: a randomised controlled trial. Cardiovasc Diabetol 17: 5.
- 32 Verma S, McMurray JJV (2018) SGLT2 inhibitors and mechanisms of cardiovascular benefit: a state-of-the-art review. Diabetologia 61: 2108–2117.


