Abstract
Grafting of non-transgenic scion onto genetically modified (GM) rootstocks provides superior
agronomic traits in the GM rootstock, and excellent fruits can be produced for consumption. In
such grafted plants, the scion does not contain any foreign genes, but the fruit itself is
likely to be influenced directly or indirectly by the foreign genes in the rootstock. Before
market release of such fruit products, the effects of grafting onto GM rootstocks should be
determined from the perspective of safety use. Here, we evaluated the effects of a transgene
encoding β-glucuronidase (GUS) on the grafted tomato fruits as a model case. An edible tomato
cultivar, Stella Mini Tomato, was grafted onto GM Micro-Tom tomato plants that had been
transformed with the GUS gene. The grafted plants showed no difference in
their fruit development rate and fresh weight regardless of the presence or absence of the
GUS gene in the rootstock. The fruit samples were subjected to transcriptome
(NGS-illumina), proteome (shotgun LC-MS/MS), metabolome (LC-ESI-MS and GC-EI-MS), and general
food ingredient analyses. In addition, differentially detected items were identified between
the grafted plants onto rootstocks with or without transgenes (more than two-fold). The
transcriptome analysis detected approximately 18,500 expressed genes on average, and only 6
genes were identified as differentially expressed. Principal component analysis of 2,442 peaks
for peptides in proteome profiles showed no significant differences. In the LC-ESI-MS and
GC-EI-MS analyses, a total of 93 peak groups and 114 peak groups were identified, respectively,
and only 2 peak groups showed more than two-fold differences. The general food ingredient
analysis showed no significant differences in the fruits of Stella scions between GM and non-GM
Micro-Tom rootstocks. These multiple omics data showed that grafting on the rootstock harboring
the GUS transgene did not induce any genetic or metabolic variation in the
scion.
1. Introduction
Advances in plant molecular biology to introduce foreign genes derived from different
organisms by Agrobacterium and particle bombardment techniques have enabled aggressive genome
manipulation. Many genetically modified (GM) transgenic crops harboring foreign genes with
useful traits, such as herbicide-tolerant and insect-resistant traits, have been developed in
the last twenty-five years, and a wide variety of foods derived from GM plants are eaten
worldwide.
Risk assessments of foods derived from transgenic organisms had been discussed, and the Codex
Alimentarius Commission (CAC) authorized the principles and guidelines for assessing food safety
derived from recombinant-DNA plants, animals, and microorganisms1,2,3,4).
Following these Codex guidelines, safety assessment procedures for seed plants and
microorganisms harboring recombinant DNA were established by the Food Safety Commission of
Japan5,6). According to this procedure, the safety of >300 foods
derived from GM seed plants have been authorized until 20207). From the perspective of risk regulation, the introduced foreign
genes of transgenic organisms need to be detected using molecular biological techniques, which
enable the identification of transgenic crops versus non-transgenic ones, even in some processed
foods derived from transgenic crops and vegetables8,9,10,11).
A novel molecular biological technology, genome editing using zinc-finger nucleases (ZFNs),
and transcription activator-like effector nucleases (TALENs) and clustered regulatory
interspaced short palindromic repeat (CRISPR)/CRISPR-associated 9 (Cas 9) RNA-guided DNA
endonucleases (CRISPR/Cas 9), provides a novel approach for the next generation of plant
breeding12,13,14,15).
Coupled with genome editing, oligo-directed mutagenesis, cisgenesis and transgenesis,
RNA-directed DNA methylation (RdDM) and grafting using transgenic plants are called “New Plant
Breeding Technology (NPBT)”16,17).
The remarkable property of genome editing and oligo-directed mutagenesis is that nucleotide
sequences of genomic DNA are modified to create phenotypical traits providing benefits for
producers and consumers, and such modification of genomic sequences is indistinguishable from
those of naturally mutated varieties and artificial mutants caused by reagents and radiation.
RdDM does not alter the nucleotide sequences of genomic DNA, but it does make the methylation
status heritable and give rise to new phenotypes. Cisgenesis and transgenesis result in
transgenic plants with the rearrangement or introduction of genomic DNA fragments derived from
hybridizable species, whose alteration of nucleotide sequences is expected to be possible in
natural hybridization or variants. In all the cases mentioned above, whole cells in their
individual plant bodies are homogeneous with regard to their managed genomic and epigenomic
status. However, grafting using transgenic and non-transgenic plants could enable the production
of chimeras consisting of GM and non-GM plant parts in one plant body.
Grafting is a traditional technique18,19).
In general, wild plants that are the same species as cultivars, are more tolerant of abiotic and
biotic stresses than cultivars. Therefore, cultivars, which are superior for producing food, are
grafted as scions onto wild rootstocks. In some cases, the rootstock is prepared from a plant
species different from the scion species20,21,22).
For example, most watermelon fruits are produced from the watermelon (Citrullus
lanatus) scion grafted onto the bottle gourd (Lagenaria siceraria)
rootstock. Undoubtedly, the rootstock and scion regions of these chimeric plant bodies are
composed of different genomes. When the lower parts of GM plants are used as rootstocks and the
upper parts of non-GM plants are used as scions, the fruit produced on the non-GM scion do not
contain introduced DNA. Many grafted chimeric crops consisting of GM rootstocks and non-GM
scions have been reported for fruits, such as grape23), plum24), blueberry25), apple26), cherry27), pear28), and citrus29) plants, and vegetables, such as tomato30,31,32),
potato33), cucurbits34), pumpkin35), eggplant36), and soybean37) plants. The transmission of useful traits from intraspecies
grafting between GM rootstocks and non-GM scions has been reported, such as for non-GM
watermelon onto GM bottle gourd38)
and non-GM potato onto GM-tomato or GM-tobacco39). Furthermore, multiple grafting among tomato, bell pepper and
eggplant40) and among tobacco
(Nicotiana benthamiana), tomato, and potato41) of GM and non-GM scions and rootstocks have been
reported.
Local short-range movement, especially for large molecules, occurs via plasmodesmata
connection between neighboring cells. In addition, small chemical substances as well as RNAs and
proteins can move from the top to the bottom of a plant body and vice versa, primarily through
the vascular tissue and phloem (called long-range movement)32,42,43,44,45,46,47,48,49).
The latter movement occurs beyond the grafting adhesion from rootstock to scion and from scion
to rootstock20,50,51,52).
For example, chimeric poplar with GM rootstock harboring the cry gene produced
Bt toxin (Cry1Ac protein) derived from Bacillus thuringiensis and the non-GM
scion showed resistance to leaf-eating insects in the scion parts of the plant, in which Bt
toxin could be detected53). Some
peptides, such as flower-timing regulation25,31,54,55),
were moved through the junction of the scion and rootstock. In contrast, there is a report
showing that large molecules of mRNAs and proteins were not transported from rootstocks to
scions38). When plant growth
regulators are over-synthesized by the introduced genes in GM rootstocks, the phenotypic traits
of non-GM scions are altered by the increase in plant growth regulators transmitted from
rootstocks56,57,58).
Most of these grafting experiments have not considered the food safety of the edible parts of
plants, such as of fruits or tubers. However, the risk of edible plant parts to human health
could be affected by the transport of toxic substances. The alkaloids of Solanaceae are
synthesized in the roots and then transported to the rest of the plants. Recently, a severe food
poisoning accident occurred in Japan when eggplant fruits from a grafted plant composed of angle
trumpet, Datura stramonium, rootstock and eggplant, Solanum
melongena, scion were cooked with pasta and eaten59). Datura alkaloids were synthesized in the rootstock60) and transported into the eggplant fruits
in the scion. In grafted plants with tobacco rootstock and tomato scion, nicotine synthesized in
the rootstocks was transported and accumulated in the leaves of the tomato scions61). These examples highlight some of the
risks that should be considered regarding the edible parts of scions in grafted plants.
Tomatoes are one of the major fruit crops using grafted seedlings prepared by farmers and
nursery companies to provide virus- and pathogen-resistant plants62,63,64).
The characteristics of grafted tomato plants have been examined from the perspective of
scientific interest30,31,32,43,50,65,66)
but not from the perspective of the food safety of tomato fruits. As a foundation of the
assessment of the food safety of grafted plants, we conducted a multi-omics analysis of tomato
fruits obtained from the grafted plants with a GM-tomato rootstock. A model tomato variety,
“Micro-Tom” was transformed using a transgene encoding β-glucuronidase (GUS) driven by
cauliflower mosaic virus 35S promoter (CaMV35S), and it was used as a rootstock. A non-GM scion
was prepared from a commercial variety of mini tomato, “Stella Mini”. The GUS protein has been
used as a versatile reporter of gene expression in plant molecular biology, and it is considered
to be independent of plant metabolism67). After grafting, the tomato fruit on the scion was analyzed. We
examined the alteration of transcriptomic, proteomic, and metabolomic traits with food
ingredients in fruits to contribute to the assessment of the food safety of grafted GM
plants.
2. Materials and Methods
2.1 Preparation of Rootstock Plants of CaMV35S-GUS Introduced Micro-Tom
and Scion Plants of Cultivar Tomato
The non-transgenic Micro-Tom (N-MT) and transgenic Micro-Tom (T-MT) plants that express the
GUS gene under controlled CaMV35S promoter were kindly provided by Dr. Satoko
Nonaka from the University of Tsukuba, Japan. The T-MT was generated by Agrobacterium-mediated
transformation with pIG121-Hm68).
The Stella Mini Tomato (Solanum lycopersicum var. cerasiforme) is a true-bred
cherry tomato cultivar and was brought from Noguchi Seed, Saitama, Japan. T-MT, N-MT, and
Stella tomatoes were cultured for five weeks in a culture room, at 25°C with a light/dark cycle
of 16 h of light provided by fluorescent light and 8 h of dark, and they were used as donors
for the grafted plants. Stella Mini Tomato plantlets were used as the scions of the grafted
plants, and they were grafted on T-MT, N-MT, and Stella rootstocks. We generated three
different grafted plants consisting of Stella scion and T-MT rootstock (ST1, 2 and 3) and three
consisting of Stella scion and N-MT rootstock (SN1, 2 and 3). After habituation in the culture
room, grafted tomatoes were transferred into 15-cm diameter pots in a screened greenhouse. The
fruit development statuses of the plants were determined based on the breaker stage, which is
the stage when change in pericarp color is observed. Fruits were harvested at 5 and 10 days
after breaker (DAB) and chilled quickly using liquid nitrogen. Then, they were stored at −80°C
until use for analysis. Three fruits from each of the six grafted plants were independently
subjected to analyses to provide biological triplicates.
2.2 Qualitative Genomic PCR
The leaves collected from T-NT and N-MT at 5 week-after-sowing and genomic DNAs were prepared
as templates of PCR by the method described by Thomsom and Henry69). The primer pairs to detect
GUS70) and
neomycin phosphotransferase II (NPTII)71) genes and the sequence of
CaMV35S72) for introduced
transgenes and tomato endogenous polygalacturonase (PG)
gene73) were prepared according
to previous reports (Supplementary Table
S1). The reaction volume of 20 μL contained 10 μL of AmpliTaq Gold 360 (Applied
Biosystems, Thermo Fisher Scientific, Waltham, MA, USA), 0.3 μmol/L each of primer pair, and an
aliquot of the template. The PCR reaction was performed with TP600 (Takara Bio Inc., Shiga,
Japan) according to the following step-cycle program; per-incubation 95°C for 5 min, following
by 35 cycles of denaturing at 95°C for 15 s, annealing at 55°C for 15 s, and extension at 20 s
in each cycle. The PCR products were separated by 2% agarose-TBE gel.
2.3 Transcriptome Analysis of Fruits Prepared from Grafted Tomatoes of Rootstock Plants
of CaMV35S-GUS Introduced MT and Scion Plants of Cultivar Tomato
2.3.1 Total RNA Extraction and RNA-seq Data Analysis
Total RNA from tomato fruits stored at −80°C was extracted using the FavoPrep Plant Total
RNA Mini Kit (Favogen Biotech Co., Ping-Tung, Taiwan) and by following the instructions
provided. The outsourcing service of Eurofins Genomics (Tokyo, Japan) constructed the
preparation of RNA library and obtained the mRNA sequencing data. The mRNA purified by
poly(A)+ and paired-end 101-base sequencing data was generated using HiSeq 4000
(Illumina Inc., San Diego, CA, USA). The mRNA-seq data (BioProject ID: PRJDB9192) were
obtained with a total of 48.9 million reads. Then, 46.4 million reads were obtained after
trimming the reads containing adapter sequences, poly-N, low-quality, and discorded fragments
less than 50 bp using the quality control tool, fastp (v0.20.1). After the fastp data were
mapped against the tomato transcriptome data ITGA4.073), the gene expression levels were calculated using Salmon
(v0.14.1). The NumReads estimate, Salmon’s estimate of the number of reads mapping to each
transcript, was normalized by a trimmed mean of M values (TMM) using the R package (v3.6.1),
edgeR (v3.28.1). Hierarchical cluster analysis was performed using the ward.D2 method in the R
package stats (v3.6.1).
2.3.2 Identification of Differentially Expressed Genes (DEGs)
DEGs were identified between ST and SN using the edgeR package on TMMs. A DEG was declared
if an associated false discovery rate p-value (PFDR) < 0.05 was observed. Gene
expression levels of DEGs were used to generate a heatmap using two R packages: heatplus
(v2.32.0) and genefilter (v1.68.0).
2.3.3 Blast Search on Transcriptome Assembly
ST mRNA-seq data were concatenated in two files and inputted into the assembler Trinity
(v2.8.6) with standard parameters to investigate the transferring GUS gene or
movement of GUS gene transcripts from the rootstock to fruits of the scion.
The tblastn (blast+ v2.9.0) search in the generated transcriptome data was used against the
GUS transgene (AAC53703).
2.4 Proteome Analysis to Tomato Fruits
2.4.1 Preparation of Digested Protein Samples
A measure of 100 mg of pulverized fruit materials was suspended in 500 μL of CellLytic P
extraction buffer (Sigma-Aldrich Japan Co., Tokyo, Japan). The resulting suspension was
vortexed for 1 min and then centrifuged at 10,000 rpm for 10 min. The insoluble materials were
removed using filtration through a membrane filter (0.45 μm; Merck Millipore, Billerica, MA,
USA). Then, 100 μL of 5 mM iodoacetamide was added to the resulting filtrate and incubated in
the dark for 10 min, followed by centrifugation for 30 min. Next, trypsin was added and
incubated overnight at 37°C. After filtration through the membrane filter, the filtrate was
acidified with trifluoroacetic acid and stored at −80°C until analysis.
2.4.2 Ultra-High Performance Liquid Chromatography (UHPLC)-Mass Spectrometry Analysis
and Multivariate Analysis
The essential protocols for UHPLC and data analysis were conducted following a previous
report74). The UHPLC system was
interfaced with a Q Exactive hybrid quadrupole-orbitrap mass spectrometer (Thermo Fisher
Scientific). A 2 μL portion of each sample was introduced using full-loop injection into an
UltiMate 3000 RS LC system with a photodiode array detector (Thermo Fisher Scientific).
Separation was performed using an Acquity UHPLC BEH-C18 column (1.8 μm, i.d. 2.1 × 100 mm;
Waters Co., Milford, MA, USA) at 40°C. The mobile phase consisted of a 0.1% aqueous solution
of formic acid (phase A) and acetonitrile containing 0.1% formic acid (phase B) running at a
flow rate of 0.1 mL/min. The parameter of gradient elution was 5%–40% B in the initial 15 min,
40%–95% B in successive 75 min increments, holding for 15 min, and then returned to 5% B in
0.2 min. Mass spectrometry (MS) was measured in the positive- and negative-ion electrospray
modes. Nitrogen was used as the desolvation gas at 300°C. The capillary and cone voltages were
set to 4,000 V and 35 V, respectively. Data were collected over the range of
m/z 150–2000 and were centroided during the acquisition. MS/MS data were
acquired in DDA mode, using the Top20 method. The MS1 mass range was 133–2000
m/z, and the resolution was set to 60000 (at 400 m/z), the
AGC target was 1e6 and maximum injection time was set to 120 msec. The MS/MS resolution was
set to 17500, with an isolation window of 2 m/z, underfill ratio of 1.3%, AGC
target of 5e5, and maximum injection time of 100 msec. Dynamic exclusion was set to 120
msec.
All data obtained from the four assays in the two systems in both the positive- and
negative-ion modes were processed using Progenesis QI data analysis software (Nonlinear
Dynamics, Newcastle upon Tyne, UK). This was used for peak picking, alignment, and
normalization to produce peak intensities for retention time and m/z data
pairs. The ranges of the automatic peak picking assays were between 5 and 100 min. The
resultant data matrices were imported into SIMCA version 14.0 (Umetrics, Umeå, Sweden) for
further multivariate statistical analysis with Pareto scaling.
2.5 Metabolome Analysis of Tomato Fruits
2.5.1 Liquid Chromatography-Electrospray Ionization-Mass Spectrometry Analysis
Metabolites were extracted following Iijima et al75) with some modifications. Frozen tomato fruits were lyophilized
and ground into powder in liquid nitrogen. A measure of 30 mg of ground sample was mixed with
900 µL of 75% methanol containing reserpine (20 µg/mL) as an internal control. After
homogenization using a Mixer Mill MM 400 (Retsch, Haan, Germany) with a zirconia bead at 30 Hz
for 2 min, the homogenate was centrifuged at 12,000 × g for 10 min at 4°C.
The extraction was repeated twice, and the supernatants were combined in a new microcentrifuge
tube. The supernatant was filtered through a PTFE membrane (0.2 µm; Millex-LG; Merck
Millipore).
Non-targeted metabolite analysis was conducted using liquid chromatography-electrospray
ionization-MS (LC–ESI-MS) in an LCMS-8040 system with control from LabSolutions software
(Shimadzu Corp., Kyoto, Japan). A measure of 5 µL of filtrated sample was separated on the
Kinetex C18 column (2.6 μm, i.d. 2.1 × 150 mm; Phenomenex Inc., Torrance, CA, USA) at 40°C
with a flow rate of 0.3 mL min−1. An initial solvent of 5% acetonitrile/0.1% formic
acid (v/v) was applied for 2 min. Then, an acetonitrile concentration gradient (5%–98%) was
applied in the presence of 0.1% formic acid over 7 min, followed by a 3-min elution with 98%
acetonitrile/0.1% formic acid. Mass spectra within the m/z
range of 100–1500 were obtained using Q3 scan mode with positive/negative polarity switching.
The MS conditions were a DL temperature of 250°C, nebulizer gas flow rate of 3.0
dm3 min−1, heat block temperature of 400°C, and drying gas flow rate of
15 dm3 min−1. A dataset of LC-ESI-MS raw data files was converted to
mzXML file format using ProteoWizard’s MSConvertGUI software76), and the mzXML files were uploaded to XCMS Online ver.
3.7.077) to process the
dataset. The mass data obtained between 2 and 12 min were analyzed using the XCMS and a
provided parameter set #11025 with the feature detection method “matchFilter”. α-Tomatine was
identified using an authentic standard compound.
2.5.2 Gas Chromatography-Electron Ionization-Mass Spectrometry Analysis
Metabolite extraction, derivatization, and gas chromatography-electron ionization-MS
(GC-EI-MS) analysis of tomato fruit samples were conducted at the Laboratory of Biomolecule
Analysis, Kazusa DNA Research Institute (Kisarazu, Chiba, Japan).
Metabolites from 10 mg of lyophilized tomato fruit were extracted using 1 mL of 80% methanol
containing 10 µg of ribitol as an internal standard, and tissue debris was removed by
centrifugation at 15,000 rpm for 5 min. The supernatant was passed through a Monospin C18
column (GL Sciences Inc., Tokyo, Japan), and a 20 µL sample was dried under a nitrogen gas
stream. The dried sample was derivatized for 90 min at 30°C in 50 μL of 20 mg/mL methoxyamine
hydrochloride in pyridine followed by a 30-min treatment at 37°C with 50 μL of
N-methyl-N-(trimethylsilyl)trifluoroacetamide.
GC-MS analysis was performed on a SHIMADZU QP-2010 Ultra system (Shimadzu) equipped with an
Agilent DB-5 column, 30 m × 0.25-mm inner diameter with a 1.00-µm film thickness (Agilent
Technologies Inc., Santa Clara, CA, USA) and injection volume was 0.5 µL. The injection port
temperature was 280°C. The helium gas flow rate through the column was 1.1 mL
min−1. The oven temperature was initially kept at 100°C for 4 min, and it was
increased from 100°C to 320°C at 4°C/min and then kept at 320°C for 8 min. The transfer line
and ion-source temperatures were 280°C and 200°C, respectively. Mass spectra generated at an
ionization energy of 70 eV were acquired from 45 to 600 m/z
with a scanning frequency of 2,000 u/sec.
The AnalyzerPro (SpectralWorks, Runcorn, UK) and FragmentAlign programs78) were used for spectral data mining for
non-targeted analysis. GCMSsolution program (Shimadzu) was used with GC/MS Metabolite Database
Ver.2 (Shimadzu) for metabolite annotation.
2.5.3 Statistical Analysis
After creating the multivariate data matrix, principal component analysis (PCA) and volcano
plot analysis were performed with the web-based free software MetaboAnalyst 4.079). The data scaling used for PCA was
auto scaling, which is mean-centered and divided by the standard deviation of each variable.
For the volcano plot analysis, the fold change threshold was set at 2.0, and the
PFDR threshold was set at 0.05.
2.6 General Food Ingredient Analysis
Analyses of the water, protein, lipid, ash, and carbohydrate contents of the tomato fruits
were conducted by the Japan Food Research Laboratories (Tokyo, Japan). Triplicate samples of 30
g of frozen tomato fruits, each of which was approximately 10 fruits harvested from each plant
line, on 7 DAB were ground using a food mixer (IFM-C20G; Iwatani Co., Osaka, Japan) and then
sent to the Japan Food Research Laboratories. The data were statistically analyzed using
Tukey’s honestly significant difference (HSD) tests in R software (version 4.0.3 (2020-10-10))
(The R Foundation for Statistical Computing, Vienna, Austria).
3. Results and Discussion
3.1 Properties of Traits of Plants and Fruits of Stella Mini Tomato Scions Grafted on
T-MT (ST) and on N-MT (SN)
T-MT, N-MT and Stella Mini Tomato were cultured for five weeks in the culture room and
provided as donors for grafted plants. MT is a dwarf variety of tomato plant that is regarded
as an experimental model plant for genomics and molecular breeding studies of tomato
plants80). The Stella Mini
Tomato, Solanum lycopersicum var. cerasiforme, is a true-bred cherry tomato
cultivar, and it was used to represent an edible cultivar in this study. The grafted plantlets
were transferred to the screened greenhouse in the middle of April 2019. All tomato plants
including the combinations of grafted and non-grafted plants, flowered until the middle of June
2019 (Fig. 1A). The flowers were tapped
gently to promote pollination as soon as they bloomed. The successfully-pollinated flowers
settled the breaker stage fruit approximately one month after flowering. The presence of the
transgene in T-MT was detected using PCR for the NPTII, GUS
gene and CaMV 35S promoter sequences (Fig.
1F). In the early growth stage, Stella scions grafted on MT rootstocks were
smaller than those grafted on Stella rootstock, but no differences were observed in the aerial
parts of the plant shapes (Fig. 1A–C).
Stella scions grafted on MT rootstocks were slightly faster at flowering than those grafted on
Stella rootstocks (data not shown). Fruits of the non-grafted MTs and the grafted plants with
MTs as scions were fully ripe at 5 DAB, whereas fruits of the non-grafted Stella and grafted
plants with Stella scions did not appear to be fully ripe. However, the cleavages were observed
in many fruits at 10 DAB. Thus, 7 DAB was defined as the fully ripe stage of the Stella plants
(Fig. 1D), and was used for the
following analyses. The grafted plants with Stella scion and MT rootstock did not differ in
their fruit development rates and fresh weight compared to the self-grafted Stella and
non-grafted Stella (Fig. 1E).
Additionally, among the grafted plants with Stella scion and N-MT or T-MT rootstock, there were
no differences in the fruit development rate and fresh weight regardless of the presence or
absence of transgenes of MT rootstock (Fig.
1E). These results suggest that grafting operations on MT rootstocks did not
affect fruit formation in Stella scions. In addition, it was suggested that the expression of
the GUS gene in MT rootstock did not affect the morphology, growth, and fruit
formation of the Stella scion of grafted plants.

We used grafted tomato plants comprising of non-transgenic Stella tomato as the scion and a
transgenic MT rootstock expressing the GUS gene under the control of the
CaMV35S promoter (ST line). In addition to these grafted tomato plants, we analyzed SN lines
consisting of a non-GM Stella scion and non-transgenic MT rootstock. The 46.4 million RNA-seq
reads from the fruits harvested from three lines of ST1, 2 and 3 and SN1, 2 and 3 against the
ITGA4.0 reference transcriptome data, including 33,976 genes, showed that 84.5% reads were
mapped in total. Overall, the mapped reads enabled the identification of a total of 22,035
genes expressed with NumReads > 0, at least in one of the six samples. The total number of
expressed genes of ST was 18,864 at ST1, 18,738 at ST2, 18,643 at ST3, and of SN were 18,306
at SN1, 18,961 at SN2, 18,374 at SN3. The hierarchical cluster analysis result indicated that
the expression profiles are similar in ST and SN, respectively (Fig. 2A). Thus, we investigated DEGs between ST and SN.

The transcriptomes of three biological replicates of ST and SN were compared and DEGs were
identified. This allowed the identification of six DEGs (PFDR < 0.05), and only
one gene was more expressed in ST than SN, and the others were downregulated in ST (Fig. 2B). The DEGs functional annotation
showed that the highly expressed gene in ST is glutathione S-transferase, and
the other five less expressed genes in ST were involved in some of the transferases. However,
β-fructofuranosidase, polygalacturonase 2A, pectinesterase, and superoxide dismutase are known
as tomato allergen81), and they
were not detected as DEGs in the comparison between ST and SN.
3.2.3 Investigation of the Transfer of the GUS Gene from Rootstocks to Scions
The ST mRNA-seq data were assembled to generate a transcriptome data, and the resulted
profile of the transcriptome data is as follows: the number of contigs 53,530, N50 length
1,880, maximum contig length 15,831. We searched the GUS gene via BLAST
search with this transcriptome dataset. We did not detect any transcripts derived from the
GUS gene in the ST transcriptome data. It is possible that the
GUS RNA fragments exist at a lower level in the ST and we fail to detect
these fragments in the ST mRNA-seq data. Even so, such small amounts of the
GUS RNA fragment had a limited effect on the transcriptome in the ST.
3.3 Proteome Analysis in Tomato Fruits
We designed a strategy to comprehensively extract fragment peaks from UHPLC-MS chromatograms
of digested mixtures of proteins from tomatoes and to compare these between the SN and ST
groups. The data matrices were prepared using peaks obtained from peak extraction on the
chromatograms of tomato samples (6 samples, n = 5) measured using
UHPLC-MS.
In the UHPLC–ESI-MS analysis, we detected 1,487 and 955 peaks from peak extraction from the
chromatograms of positive-ion mode and negative-ion mode, respectively. A PCA of a total of 30
samples was performed using data matrices representing peak intensities extracted from
individual peak groups82), and we
compared the extracts primarily includes digested peptide fragment contents between ST and SN
lines. A PCA with high statistical values of Rx2 (0.847) and
Q2 (0.702) was derived from the UHPLC-ESI-(+)-MS, where,
Rx2 represents the goodness of fit and
Q2 reveals the predictability of the PCA model. The projection of
PCA models using projections into two dimensions of the first principal component (PC1) and the
second principal component (PC2) is shown in Fig. 3A.
The two groups seemed to form their own clusters, but the two groups largely overlapped (Fig. 3A). Therefore, no significant difference between the
two groups of SN and ST was observed. Subsequently, the PCA derived from UHPLC-ESI-(-)-MS was
examined. High statistical values for Rx2 (0.883) and
Q2 (0.745) were obtained from the PCA. Fig. 3B presents the projection of the PCA models in PC1 and PC2. In this
PCA score plot of UHPLC-ESI-(-)-MS, no significant difference was observed between the two
groups of SN and ST, which is similar to the results for UHPLC-ESI-(+)-MS. Also, no obviously
different peptide fragments were identified as contributing components.

From this fingerprinting of tomato fruits by UHPLC-ESI-MS, we found that GUS
gene expression in rootstock had a limited effect on the production of proteins in tomato
fruits. Recently, there were reports on proteomic analysis using Solanaceae plants for the
study of the change of membrane proteins during ripening83). Our analysis using UHPLC-ESI-MS revealed that the contents of
crude protein extracts were not different between the ST and SN fruits. Further analytical and
statistical studies are needed to confirm differences between the recombinant and
non-recombinant forms, and further studies are currently underway.
3.4 Metabolome Analysis in Tomato Fruits
3.4.1 Analytical Scheme
We have explored the possibility of unanticipated metabolomic changes was exerted in
non-transgenic scions of grafted crop plants engrafted with rootstocks carrying transgenic
events. Metabolomic profiles were obtained using analytical data from non-targeted metabolomic
profiling by LC-ESI-MS and GC-EI-MS. In mass chromatograms, metabolites are separately eluted
and detected as peaks of a set of ion signals within certain time ranges. Such peaks comprised
of ions generated from a single metabolite, exhibiting m/z
values of molecular ions, fragment ions, and isotopic ions, are compiled into peak groups
representing molecular information from individual metabolites. Thus, in this study, each peak
group should represent a distinct metabolite.
3.4.2 Metabolomic Profiling of Tomato Fruits from Grafted Plants
Fruits of 10 DAB stage were harvested from these grafted plants and subjected to LC-ESI-MS
and GC-EI-MS analyses. Three fruits harvested from each independent plant line of ST1, 2, and
3 and from each line of SN1, 2, and 3, making 18 fruits in total, were used for the MS
analyses.
In the LC-ESI-MS analysis, we identified 60 and 33 peak groups in the analyses of positive
ion mode and negative ion mode, respectively. Using representative peak intensities from
individual peak groups, PCA was performed to compare the metabolite composition between the ST
and SN lines. The PCA score plots composed of the first two PCs did not show metabolome
cluster separation between ST and SN (Fig. 4A and
4B). Similarly, the PCA score plots of PC3 and PC4 did not show metabolome cluster
separation between ST and SN (data not shown). The cumulative variances of first four PCs are
66.3% in the positive ion mode analysis and 70.0% in the negative ion mode analysis. There
were not more than two-fold differences in the metabolite accumulation levels between ST and
SN. In the GC-EI-MS analysis, we obtained 114 peak groups. Among them, 97 peak groups were
subjected to PCA because the remaining 17 peak groups were not consistently detected in the
analyzed samples due to their low abundance. Two-dimensional PCA score plot graph composed of
the first two PCs showed overlapping but partially separated metabolome clusters derived from
the ST and SN lines (Fig. 4C). On the other hand,
the PCA score plots of PC3 and PC4 did not show metabolome cluster separation between ST and
SN (data not shown). The cumulative variance of first four PCs is 49.9%. Two peak groups, G57
and G102, showed more than a two-fold difference in their relative abundance (PFDR
< 0.05) (Fig. 4D). G57 was annotated as
asparagine, and its accumulation was 2.8-fold higher in the SN lines. The accumulation level
of G102, whose identity and molecular structure are unknown, was three-fold higher in the ST
lines. However, G57 and G102 were not detected in a non-negligible number of fruits.
Therefore, it is necessary to examine in detail the data to obtain a better understanding
(Supplementary Table S2). Asparagine (peak group
G57) was detected in all the samples from the SN lines at a similar intensity, while it was
detected in only six fruits from the ST lines: two out of three fruits from each line. The
contents of the metabolite represented by peak group G102 was very low. Thus, G102 was not
consistently detected among all the fruit samples. For example, it was undetected in the SN1
fruits and detected in two of three fruits from SN2.

From the metabolite profiling of tomato fruits using LC-ESI-MS and GC-EI-MS, we found that
GUS gene expression in rootstock had a limited effect on tomato fruit
metabolites. However, the molecular identity of G102 remains unknown because of its extremely
low concentration and a lack of practical information to investigate its molecular structure,
such as an MS spectral database and authentic compounds. Nonetheless, it was also detected in
the measurements in the fruits ripened on the non-grafted Stella plants, and there is no
information to evaluate its biological effects on the edible part of the plants. It remains a
point in question whether such a minor component can be critical.
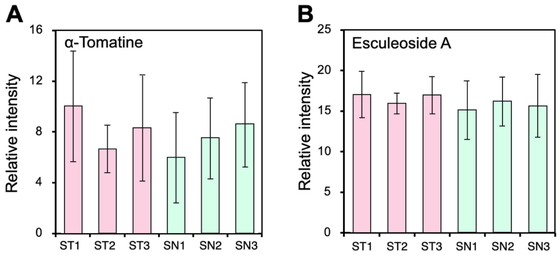
It is well known that Solanaceae plants contain toxic substances: steroidal
glycoalkaloids84).
Representative steroidal glycoalkaloids in tomato fruits are α-tomatine and esculeoside
A85). In this study, we
analyzed three independent fruits from each plant to compare these steroidal alkaloids using
LC-ESI-MS. We found that the contents of α-tomatine and esculeoside A were not different
between ST and SN fruits (Fig. 5A and 5B).
3.5 General Food Ingredient Analysis
The contents of general food ingredients are shown in Fig. 6. No significant differences were found in the chemical contents
of the fruits from grafted plants and a non-grafting Stella tomatoes (Tukey-HSD, ɑ = 0.05,
n = 3) (Fig.
6). These measurements were closely related to the values described in the
Standards Tables of Food Composition in Japan86). These results suggest that the food ingredients of tomatoes with
a Stella scion were not affected by either grafting operations or the type of the rootstocks
used, which were T-MT, N-MT, and Stella.
4. Conclusions
We evaluated the effects of a GUS transgene in the rootstock on the grafted
tomato fruits as a model case, since GUS is independent from the plant metabolism. The omics
analyses revealed insignificant effects of grafting on the transcript, protein, and metabolite
profiles of tomato fruits on the scion. In conclusion, grafting onto the GM rootstocks harboring
the transgenes encoding the enzymes that do not affect the host metabolism had a quite limited
effects on plant metabolism in the non-GM scion, indicating no apparent risk for food safety of
the grafting onto the GM rootstock. The multiple omics analyses shown here could be applied for
safety evaluation of the products of grafted plants in which the transgene products interact
with the host metabolism. In contrast, grafted plants composed of GM scion onto non-GM rootstock
will be developed especially in the cultivation of potato plants, and evaluation of food safety
of the products from the non-GM rootstock would be required in future. Finally, the movement of
the RNA molecules and translated protein product derived from the transgene through the grafted
junction still remain uncertain and require further investigation in terms of food safety
assessment.
Supplementary Table S1. Primer pairs for genomic PCR
| Primer pair |
Target |
Amplicon length |
Reference |
| 5′-TTACGTCCTGTAGAAACCCC-3′ |
GUS |
155 bp |
Goda et al., 200170) |
| 5′-TCGTTAAAACTGCCTGGCAC-3′ |
| 5′-TGAATGAACTGCAGGACGAG-3′ |
NPTII |
151 bp |
Goda et al., 200170) |
| 5′-AGGTGAGATGACAGGAGATC-3′ |
| 5′-ATTGATGTGATATCTCCACTGACGT -3′ |
35S promoter |
250 bp |
Kuribara et al., 200271) |
| 5′-CCTCTCCAAATGAAATGAACTTCCT -3′ |
| 5′-GGATCCTTAGAAGCATCTAGT-3′ |
PG |
384 bp |
JRC Compendium of Reference Methods for GMO Analysis
(QL-TAX-SL-001)72) |
| 5′-CGTTGGTGCATCCCTGCATGG-3′ |
Supplementary Table S2. Relative intensity of G57 and G102 obtained using GC-EI-MS in the
ST and SN fruits
| Line |
Fruit name |
Relative intensity to internal control |
| G57 |
G102 |
| SN1 |
SN1-1 |
0.087 |
n.d.* |
| SN1-2 |
0.045 |
n.d.* |
| SN1-3 |
0.095 |
n.d.* |
| SN2 |
SN2-1 |
0.063 |
0.033 |
| SN2-2 |
0.089 |
n.d.* |
| SN2-3 |
0.105 |
0.071 |
| SN3 |
SN3-1 |
0.116 |
0.035 |
| SN3-2 |
0.061 |
0.045 |
| SN3-3 |
0.058 |
0.078 |
| ST1 |
ST1-1 |
0.035 |
0.095 |
| ST1-2 |
0.032 |
0.070 |
| ST1-3 |
n.d.* |
0.119 |
| ST2 |
ST2-1 |
0.048 |
0.106 |
| ST2-2 |
0.045 |
0.083 |
| ST2-3 |
n.d.* |
0.106 |
| ST3 |
ST3-1 |
n.d.* |
0.076 |
| ST3-2 |
0.026 |
0.104 |
| ST3-3 |
0.050 |
0.104 |
* n.d, not detected. In statistical analysis shown in Fig.
4D, these missing values were replaced by 1/5 of the minimum positive values of their
corresponding variables assuming that this was the detection limit.
Acknowledgements
This research was commissioned under the “2010 FSCJ Research Grant Program for Risk Assessment
on Food Safety (Topic No. 1902)”.
Non-transgenic and transgenic Micro-Tom were kindly provided from Dr. Satoko Nonaka from
University of Tsukuba, Japan.
Conflict of Interest
The authors have no conflict of interest.
References
- 1.Codex Alimentarius Commission (CAC), Joint FAO/WHO
Food Standards Program. Principles for the risk analysis of foods
derived from modern biotechnology (CAC/GL 44-2003). 2003.
http://www.fao.org/fileadmin/user_upload/gmfp/resources/
CXG_044e.pdf. Accessed on November 26, 2020.
- 2.Codex Alimentarius Commission (CAC), Joint FAO/WHO
Food Standards Program. Guideline for the conduct of food safety assessment of foods derived
from recombinant-DNA plants (CAC/GL 45-2003) 2003.
http://www.fao.org/fileadmin/user_upload/gmfp/docs/CAC.GL_45_2003.pdf. Accessed onNovember 26,
2020
- 3.Codex Alimentarius Commission (CAC), Joint FAO/WHO
Food Standards Program. Guideline for the conduct of food safety assessment of foods derived
from recombinant-DNA microorganisms (CAC/GL 46-2003). 2003.
http://www.fao.org/fileadmin/user_upload/gmfp/resources/CXG_046e.pdf. Accessed on November 26,
2020.
- 4.Codex Alimentarius Commission (CAC), Joint FAO/WHO
Food Standards Program. Guideline for the conduct of food safety assessment of foods derived
from recombinant-DNA animals (CAC/GL 68-2008). 2003.
http://www.fao.org/fileadmin/user_upload/gmfp/resources/CXG_068e.pdf. Accessed on November 26,
2020.
- 5.Food Safety Commission of Japan. Standards for the
safety assessment of genetically modified foods (seed plants). 2004.
http://www.fsc.go.jp/senmon/idensi/gm_kijun.pdf. Accessed on November 26,
2020.
- 6.Food Safety Commission of Japan. Standards for the
safety assessment of genetically modified foods (microorganisms). 2008.
http://www.fsc.go.jp/senmon/idensi/gm_biseibutu_kijun.pdf. Accessed on November 26,
2020.
- 7. Ministry of Health, Labour, and Welfare.
List of genetically modified foods and additives submitted in accordance with food hygiene
handling procedures for food and additives derived from genome editing technology [In
Japanese]. https://www.mhlw.go.jp/content/000704532.pd. Accessed on November 26,
2020
- 8.ISO. Foodstuffs - Methods of analysis for the
detection of genetically modified organisms and derived products - Quantitative nucleic acid
based methods. ISO 21570:2005. 2005.
- 9. Marmiroli N, Maestri E, Gullì M, et al. Methods for
detection of GMOs in food and feed. Biotechnol Adv. 2008;
392(3): 369–384. PMID:18726090,
DOI:10.1007/s00216-008-2303-6
- 10. Holst-Jensen A, Bertheau Y, de Loose M, et al.
Detecting un-authorized genetically modified organisms (GMOs) and derived materials.
Biotechnology Advances. 2012; 30(6): 1318–1335.
PMID:22333321, DOI:10.1016/j.biotechadv.2012.01.024
- 11. Mano J, Takabatake R, Kitta K. Development and
standardization of analytical methods for increasing varieties of genetically modified crops.
Japan Agricultural Research Quarterly: JARQ. 2020;
54(2): 113–119. DOI:10.6090/jarq.54.113
- 12. Lusser M, Parisi C, Plan D, Rodríguez-Cerezo E.
Deployment of new biotechnologies in plant breeding. Nat Biotechnol. 2012;
30(3): 231–239. PMID:22398616,
DOI:10.1038/nbt.2142
- 13. Gaj T, Gersbach CA, Barbas CF, III ZFN, TALEN, and
CRISPR/Cas-based methods for genome engineering. Trends Biotechnol. 2013;
31(7): 397–405. PMID:23664777,
DOI:10.1016/j.tibtech.2013.04.004
- 14. Chandrasegaran S, Carroll D. Origins of programmable
nucleases for genome engineering. J Mol Biol. 2016;
428(5, 5 Pt B): 963–989. PMID:26506267,
DOI:10.1016/j.jmb.2015.10.014
- 15. Xu J, Hua K, Lang Z. Genome editing for horticultural
crop improvement. Hortic Res. 2019; 6(1): 113.
PMID:31645967, DOI:10.1038/s41438-019-0196-5
- 16. Podevin N, Devos Y, Davies HV, Nielsen KM. Transgenic
or not? No simple answer! EMBO Rep. 2012; 13(12):
1057–1061. PMID:23154464, DOI:10.1038/embor.2012.168
- 17. Schmidt SM, Belisle M, Frommer WB. The evolving
landscape around genome editing in agriculture. EMBO Rep. 2020;
21(6): e50680. PMID:32431018,
DOI:10.15252/embr.202050680
- 18. Garner RJ. The Grafter’s Handbook.
London, the UK: Chelsea Green Publishingl.1947.
- 19. Mudge K, Janick J, Scofield S, Goldschmidt EE.
A History of Grafting. Horticultural Reviews, volume 35. Janick J, ed. New
Jersey, USA: John Wiley and Sons Inc; 2009: 437–493.
- 20. Goldschmidt EE. Plant grafting: new mechanisms,
evolutionary implications. Front Plant Sci. 2014; 5: 727.
PMID:25566298, DOI:10.3389/fpls.2014.00727
- 21. Melnyk CW, Meyerowitz EM. Plant grafting.
Curr Biol. 2015; 25(5): R183–R188. PMID:25734263,
DOI:10.1016/j.cub.2015.01.029
- 22. Gaut BS, Miller AJ, Seymour DK. Living with two
genomes: Grafting and its implications for plant genome-to-genome interactions, phenotypic
variation, and evolution. Annu Rev Genet. 2019;
53(1): 195–215. PMID:31424971,
DOI:10.1146/annurev-genet-112618-043545
- 23. Agüero CB, Uratsu SL, Greve C, et al. Evaluation of
tolerance to Pierce’s disease and Botrytis in transgenic plants of Vitis vinifera L. expressing
the pear PGIP gene. Mol Plant Pathol. 2005; 6(1):
43–51. PMID:20565637, DOI:10.1111/j.1364-3703.2004.00262.x
- 24. Nagel AK, Kalariya H, Schnabel G. The Gastrodia
antifungal protein (GAFP-1) and its transcript are absent from scions of chimeric-grafted plum.
HortScience. 2010; 45(2): 188–192.
DOI:10.21273/HORTSCI.45.2.188
- 25. Song G, Walworth A, Zhao D, Jiang N, Hancock JF. The
Vaccinium corymbosum FLOWERING LOCUS T-like gene (VcFT): a flowering activator reverses
photoperiodic and chilling requirements in blueberry. Plant Cell Rep. 2013;
32(11): 1759–1769. PMID:23907615,
DOI:10.1007/s00299-013-1489-z
- 26. Schäfer T, Hanke MV, Flachowsky H, et al. Chitinase
activities, scab resistance, mycorrhization rates and biomass of own-rooted and grafted
transgenic apple. Genet Mol Biol. 2012; 35(2):
466–473. PMID:22888297, DOI:10.1590/S1415-47572012000300014
- 27. Song G, Sink KC, Walworth AE, Cook MA, Allison RF,
Lang GA. Engineering cherry rootstocks with resistance to Prunus necrotic ring spot virus
through RNAi-mediated silencing. Plant Biotechnol J. 2013;
11(6): 702–708. PMID:23521804,
DOI:10.1111/pbi.12060
- 28. Zhu LH, Li XY, Ahlman A, Welander M. The rooting
ability of the dwarfing pear rootstock BP10030 (Pyrus communis) was significantly increased by
introduction of the rolB gene. Plant Sci. 2003;
165(4): 829–835.
DOI:10.1016/S0168-9452(03)00279-6
- 29. Molinari HBC, Marur CJ, Filho JCB, et al. Osmotic
adjustment in transgenic citrus rootstock Carrizo citrange (Citrus sinensis Osb. x Poncirus
trifoliate L. Raf). Plant Sci. 2004; 167: 1375–1381.
DOI:10.1016/j.plantsci.2004.07.007
- 30. Kim M, Canio W, Kessler S, Sinha N. Developmental
changes due to long-distance movement of a homeobox fusion transcript in tomato.
Science. 2001; 293(5528): 287–289. PMID:11452121,
DOI:10.1126/science.1059805
- 31. Lifschitz E, Eviatar T, Rozman A, et al. The tomato
FT ortholog triggers systemic signals that regulate growth and flowering and substitute for
diverse environmental stimuli. Proc Natl Acad Sci U S A. 2006;
103(16): 6398–6403. PMID:16606827,
DOI:10.1073/pnas.0601620103
- 32. Nakamura S, Hondo K, Kawara T, et al. Conferring
high-temperature tolerance to nontransgenic tomato scions using graft transmission of RNA
silencing of the fatty acid desaturase gene. Plant Biotechnol J. 2016;
14(2): 783–790. PMID:26132723,
DOI:10.1111/pbi.12429
- 33. Banerjee AK, Chatterjee M, Yu Y, Suh SG, Miller WA,
Hannapel DJ. Dynamics of a mobile RNA of potato involved in a long-distance signaling pathway.
Plant Cell. 2007; 18(12): 3443–3457.
PMID:17189340, DOI:10.1105/tpc.106.042473
- 34. Lin MK, Belanger H, Lee YJ, et al. FLOWERING LOCUS T
protein may act as the long-distance florigenic signal in the cucurbits. Plant
Cell. 2007; 19(5): 1488–1506. PMID:17540715,
DOI:10.1105/tpc.107.051920
- 35. Yoo BC, Kragler F, Varkonyi-Gasic E, et al. A
systemic small RNA signaling system in plants. Plant Cell. 2004;
16(8): 1979–2000. PMID:15258266,
DOI:10.1105/tpc.104.023614
- 36. Gal-On A, Wolf D, Antignus Y, et al. Transgenic
cucumbers harboring the 54-kDa putative gene of Cucumber fruit mottle mosaic tobamovirus are
highly resistant to viral infection and protect non-transgenic scions from soil infection.
Transgenic Res. 2005; 14(1): 81–93.
PMID:15865051, DOI:10.1007/s11248-004-3802-7
- 37. Jiang L, Xu X, Li Z, Doohan D. Grafting imparts
glyphosate resistance in soybean. Weed Technology. 2013;
27(2): 412–416. DOI:10.1614/WT-D-12-00161.1
- 38. Kim BO, Han JS, Park KI, Jeon SM, Kim CK. Absence of
AVP1 transcripts in wild type watermelon scions grafted onto transgenic bottle gourd
rootstocks. Journal of Plant Biotechnology. 2015;
42(1): 13–18. DOI:10.5010/JPB.2015.42.1.13
- 39. Kasai A, Bai S, Hojo H, Harada T. Epigenome editing
of potato by grafting using transgenic tobacco as siRNA donor. PLoS ONE. 2016;
11(8): e0161729. PMID:27564864,
DOI:10.1371/journal.pone.0161729
- 40. Wu R, Wang X, Lin Y, et al. Inter-species grafting
caused extensive and heritable alterations of DNA methylation in Solanaceae plants.
PLoS ONE. 2013; 8(4): e61995. PMID:23614002,
DOI:10.1371/journal.pone.0061995
- 41. Xia C, Zheng Y, Huang J, et al. Elucidation of the
mechanisms of long-distance mRNA Movement in a Nicotiana benthamiana/tomato heterograft system.
Plant Physiol. 2018; 177(2): 745–758.
PMID:29720554, DOI:10.1104/pp.17.01836
- 42. Ruiz-Medrano R, Xoconostle-Cázares B, Lucas WJ.
Phloem long-distance transport of CmNACP mRNA: implications for supracellular regulation in
plants. Development. 1999; 126(20): 4405–4419.
PMID:10498677, DOI:10.1242/dev.126.20.4405
- 43. Haywood V, Yu TS, Huang NC, Lucas WJ. Phloem
long-distance trafficking of GIBBERELLIC ACID-INSENSITIVE RNA regulates leaf development.
Plant J. 2005; 42(1): 49–68. PMID:15773853,
DOI:10.1111/j.1365-313X.2005.02351.x
- 44. Kehr J, Buhtz A. Long distance transport and movement
of RNA through the phloem. J Exp Bot. 2007; 59(1):
85–92. PMID:17905731, DOI:10.1093/jxb/erm176
- 45. Banerjee AK, Lin T, Hannapel DJ. Untranslated regions
of a mobile transcript mediate RNA metabolism. Plant Physiol. 2009;
151(4): 1831–1843. PMID:19783647,
DOI:10.1104/pp.109.144428
- 46. Cho SK, Sharma P, Butler NM, et al. Polypyrimidine
tract-binding proteins of potato mediate tuberization through an interaction with StBEL5 RNA.
J Exp Bot. 2015; 66(21): 6835–6847.
PMID:26283046, DOI:10.1093/jxb/erv389
- 47. Notaguchi M. Identification of phloem-mobile mRNA.
J Plant Res. 2015; 128(1): 27–35. PMID:25516498,
DOI:10.1007/s10265-014-0675-6
- 48. Notaguchi M, Okamoto S. Dynamics of long-distance
signaling via plant vascular tissues. Front Plant Sci. 2015; 6:
161. PMID:25852714, DOI:10.3389/fpls.2015.00161
- 49. Wang J, Jiang L, Wu R. Plant grafting: how genetic
exchange promotes vascular reconnection. New Phytol. 2017;
214(1): 56–65. PMID:27991666,
DOI:10.1111/nph.14383
- 50. Haroldsen VM, Szczerba MW, Aktas H, et al. Mobility
of transgenic nucleic acids and proteins within grafted rootstocks for agricultural
improvement. Front Plant Sci. 2012; 3: 39. PMID:22645583,
DOI:10.3389/fpls.2012.00039
- 51. McGarry RC, Kragler F. Phloem-mobile signals
affecting flowers: applications for crop breeding. Trends Plant Sci. 2013;
18(4): 198–206. PMID:23395308,
DOI:10.1016/j.tplants.2013.01.004
- 52. Tsutsui H, Notaguchi M. The use of grafting to study
systemic signaling in plants. Plant Cell Physiol. 2017;
58(8): 1291–1301. PMID:28961994,
DOI:10.1093/pcp/pcx098
- 53. Wang L, Yang M, Akinnagbe A, Liang H, Wang J, Ewald
D. Bacillus thuringiensis protein transfer between rootstock and scion of grafted poplar.
Plant Biol (Stuttg). 2012; 14(5): 745–750.
PMID:22372666, DOI:10.1111/j.1438-8677.2011.00555.x
- 54. Navarro C, Abelenda JA, Cruz-Oró E, et al. Control of
flowering and storage organ formation in potato by FLOWERING LOCUS T. Nature.
2011; 478(7367): 119–122. PMID:21947007,
DOI:10.1038/nature10431
- 55. Yoo SC, Chen C, Rojas M, et al. Phloem long-distance
delivery of FLOWERING LOCUS T (FT) to the apex. Plant J. 2013;
75(3): 456–468. PMID:23607279,
DOI:10.1111/tpj.12213
- 56. Ko D, Kang J, Kiba T, et al. Arabidopsis ABCG14 is
essential for the root-to-shoot translocation of cytokinin. Proc Natl Acad Sci U S
A. 2014; 111(19): 7150–7155. PMID:24778257,
DOI:10.1073/pnas.1321519111
- 57. Melnyk CW, Schuster C, Leyser O, Meyerowitz EM. A
developmental framework for graft formation and vascular reconnection in Arabidopsis thaliana.
Curr Biol. 2015; 25(10): 1306–1318.
PMID:25891401, DOI:10.1016/j.cub.2015.03.032
- 58. Yin H, Yan B, Sun J, et al. Graft-union development:
a delicate process that involves cell–cell communication between scion and stock for local
auxin accumulation. J Exp Bot. 2012; 63(11):
4219–4232. PMID:22511803, DOI:10.1093/jxb/ers109
- 59. Oshiro N, Kuniyoshi K, Nakamura A, Araki Y, Tamanaha
K, Inafuku Y. A case of food poisoning due to ingestion of eggplant, Solanum melongena, grafted
on Devil’s trumpet, Datura metal [in Japanese]. Shokuhin Eiseigaku Zasshi.
2008; 49(5): 376–379.
DOI:10.3358/shokueishi.49.376
- 60. Waller GR, Nowacki EK. Alkaloid Biology and
Metabolism in Plants., New York, NY: Plenum Press; 1978.
- 61. Dawson RF. Accumulation of nicotine reciprocal grafts
of tomato and tobacco. American Journal of Botany. 1942;
29(1): 66–71.
DOI:10.1002/j.1537-2197.1942.tb13971.x
- 62. Singh H, Kumar P, Chaudhari S, Edelstein M. Tomato
grafting: a global perspective. HortScience. 2017;
52(10): 1328–1336. DOI:10.21273/HORTSCI11996-17
- 63. Spanò R, Ferrara M, Gallitelli D, Mascia T. The role
of grafting in the resistance of tomato to viruses. Plants (Basel). 2020;
9(8): 1042. PMID:32824316,
DOI:10.3390/plants9081042
- 64. Spanò R, Ferrara M, Montemurro C, Mulè G, Gallitelli
D, Mascia T. Grafting alters tomato transcriptome and enhances tolerance to an airborne virus
infection. Sci Rep. 2020; 10(1): 2538.
PMID:32054920, DOI:10.1038/s41598-020-59421-5
- 65. Spiegelman Z, Ham BK, Zhang Z, et al. A tomato
phloem‐mobile protein regulates the shoot‐to‐root ratio by mediating the auxin response in
distant organs. Plant J. 2015; 83(5): 853–863.
PMID:26173789, DOI:10.1111/tpj.12932
- 66. Shaharuddin NA, Han Y, Li H, Grierson D. The
mechanism of graft transmission of sense and antisense gene silencing in tomato plants.
FEBS Lett. 2006; 580(28-29): 6579–6586.
PMID:17113082, DOI:10.1016/j.febslet.2006.11.005
- 67. Jefferson RA, Kavanagh TA, Bevan MW. GUS fusions:
beta-glucuronidase as a sensitive and versatile gene fusion marker in higher plants.
EMBO J. 1987; 6(13): 3901–3907. PMID:3327686,
DOI:10.1002/j.1460-2075.1987.tb02730.x
- 68. Ohta S, Mita S, Hattori T, Nakamura K. Construction
and expression in tobacco of β-glucuronidase (GUS) reporter gene containing an intron within
the coding sequence. Plant & Cell Physiology. 1990; 31:
805–813.
- 69. Thomson D, Henry R. Single-step protocol for
preparation of plant tissue for analysis by PCR. Biotechniques. 1995;
19(3): 394–397, 400. PMID:7495552
- 70. Goda Y, Asano T, Shibuya M, Hino A, Toyoda M.
Detection of recombinant DNA from genetically modified Papaya [in Japanese]. Shokuhin
Eiseigaku Zasshi. 2001; 42(4): 231–236.
DOI:10.3358/shokueishi.42.231
- 71. Kuribara H, Shindo Y, Matsuoka T, et al. Novel
reference molecules for quantitation of genetically modified maize and soybean. J AOAC
Int. 2002; 85(5): 1077–1089. PMID:12374407,
DOI:10.1093/jaoac/85.5.1077
- 72.Citation: Van Den Eede G. Compendium of reference
methods for GMO analysis. EUR 24526 EN. Luxembourg (Lux embourg): Publications Office of the
European Union; 2011
- 73. Tomato Genome Consortium.
The tomato genome sequence provides insights into fleshy fruit evolution.
Nature. 2012; 485(7400): 635–641. PMID:22660326,
DOI:10.1038/nature11119
- 74. Tsujimoto T, Yoshitomi T, Maruyama T, Yamamoto Y,
Hakamatsuka T, Uchiyama N. High-resolution liquid chromatography−mass spectrometry-based
metabolomic discrimination of Citrus-type crude drugs and comparison with nuclear magnetic
resonance spectroscopy-based metabolomics. J Nat Prod. 2019;
82(8): 2116–2123. PMID:31322883,
DOI:10.1021/acs.jnatprod.8b00977
- 75. Iijima Y, Nakamura Y, Ogata Y, et al. Metabolite
annotations based on the integration of mass spectral information. Plant J.
2008; 54(5): 949–962. PMID:18266924,
DOI:10.1111/j.1365-313X.2008.03434.x
- 76.Holman JD, Tabb DL, Malllick P. Employing
ProteoWizard to convert raw mass spectrometry data. Curr Protoc Bioinform.
2014; 46 : 13.24.1–13.24.9. PMID: 24939128, doi:
.DOI:10.1002/0471250953.bi1324s46
- 77. Tautenhahn R, Patti GJ, Rinehart D, Siuzdak G. XCMS
Online: a web-based platform to process untargeted metabolomic data. Anal
Chem. 2012; 84(11): 5035–5039. PMID:22533540,
DOI:10.1021/ac300698c
- 78. Sakurai N, Ara T, Enomoto M, et al. Tools and
databases of the KOMICS web portal for preprocessing, mining, and dissemination of metabolomics
data. Biomed Res Int. 2014; 2014: 1–11. PMID:24949426,
DOI:10.1155/2014/194812
- 79. Chong J, Soufan O, Li C, et al. MetaboAnalyst 4.0:
towards more transparent and integrative metabolomics analysis. Nucleic Acids
Res. 2018; 46 (W1): W486–W494. PMID:29762782,
DOI:10.1093/nar/gky310
- 80. Sun HJ, Uchii S, Watanabe S, Ezura H. A highly
efficient transformation protocol for Micro-Tom, a model cultivar for tomato functional
genomics. Plant Cell Physiol. 2006; 47(3):
426–431. PMID:16381658, DOI:10.1093/pcp/pci251
- 81. Kondo Y, Urisu A, Tokuda R. Identification and
characterization of the allergens in the tomato fruit by immunoblotting. Int Arch
Allergy Immunol. 2001; 126(4): 294–299. PMID:11815736,
DOI:10.1159/000049526
- 82. Lualdi M, Fasano M. Statistical analysis of
proteomics data: A review on feature selection. J Proteomics. 2019;
198: 18–26. PMID:30529743, DOI:10.1016/j.jprot.2018.12.004
- 83. Pontiggia D, Spinelli F, Fabbri C, et al. Changes in
the microsomal proteome of tomato fruit during ripening. Sci Rep. 2019;
9(1): 14350. PMID:31586085,
DOI:10.1038/s41598-019-50575-5
- 84. Sucha L, Tomsik P. The steroidal glycoalkaloids from
Solanaceae: toxic effect, antitumour activity and mechanism of action. Planta
Medica. 2016; 82(05): 379–387. PMID:26845708,
DOI:10.1055/s-0042-100810
- 85. Iijima Y, Watanabe B, Sasaki R, et al. Steroidal
glycoalkaloid profiling and structures of glycoalkaloids in wild tomato fruit.
Phytochemistry. 2013; 95: 145–157. PMID:23941899,
DOI:10.1016/j.phytochem.2013.07.016
- 86. Ministry of Education, Culture, Sports,
Science and Technology. STANDARD TABLES OF FOOD COMPOSITION IN JAPAN - 2015 - (Seventh Revised
Version). 2015.
https://www.mext.go.jp/en/policy/science_technology/policy/title01/detail01/1374030.htm.
Accessed on November 26, 2020.