| Edited by Hideo Shinagawa. Masahiro Ishiura: Corresponding author. E-mail: ishiura@gene.nagoya-u.ac.jp. Yasuhide Okumoto and Manabu Harada: Present address: Filgen, Inc., 15-1 Nakanoshima, Ohdaka-cho, Midori-ku, Nagoya 459-8001, Japan. Masahiro Ishiura: Present address: Moritex Corporation, 1-3-3, Azamino-minami, Aoba-ku, Yokohama 225-0012, Japan |
Cyanobacteria are prokaryotic organisms that carry out plant-like oxygen-evolving photosynthesis. Because genetic manipulation of several cyanobacterial species is easy, they are used for the study of various biological phenomena, including photosynthesis, metabolism, response to environmental stress, and circadian rhythm.
The thermophilic cyanobacterium Thermosynechococcus elongatus BP-1, which was isolated from a Japanese hot spring, grows at greater than 50°C (Yamaoka et al., 1978). Its proteins are highly heat-stable, which permitted X-ray analysis of the crystal structure of photosystems I (Jordan et al., 2001) and II (Zouni et al., 2001) and the circadian clock proteins KaiA (Uzumaki et al., 2004) and KaiB (our unpublished data). The three-dimensional structure of the circadian clock protein KaiC was elucidated by electron microscopy (Hayashi et al., 2003). The entire genome sequence of T. elongatus (2.6 Mbp) has been determined, and its genome is estimated to contain 2,524 genes (Nakamura et al., 2002). In addition, an efficient transformation procedure had been established (Onai et al., 2004a). These technical advances greatly facilitate research in the thermophilic cyanobacteria.
Circadian rhythms are self-sustaining oscillations whose period length coincides with the 24-hour day-night cycle. The rhythms are widespread and involve functions as diverse as human sleep-wake cycles and cyanobacterial nitrogen fixation. Cyanobacteria are the simplest organisms found to show circadian rhythms. kaiABC, a clock gene cluster that generates circadian rhythms, has been identified in the mesophilic cyanobacterium Synechococcus sp. strain PCC 7942 (Ishiura et al., 1998). Expression of the kaiA gene and the kaiBC operon are circadian. KaiA and KaiC proteins regulate the transcription of the kaiBC operon positively and negatively, respectively, and this feedback regulation is critical for generation of the circadian rhythms. Recently, we demonstrated by real-time bioluminescence monitoring that the circadian clock operates in T. elongatus (Onai et al., 2004b). The circadian clock of T. elongatus shows the widest temperature range (30 to 60°C) for the compensation of the period length among organisms investigated so far.
In the present study, we report the construction of a DNA microarray that covers almost all the T. elongatus genes. We used as probes unmodified oligonucleotides that allow sensitive and specific detection of transcripts at low fabrication cost (Kucho et al., 2004a). Using the microarray, we screened for candidate clock-controlled genes.
We obtained nucleotide sequences of all genes contained in the T. elongatus genome (Nakamura et al., 2002) from CyanoBase (http://www.kazusa.or.jp/cyano/). First, we extracted every 45-nucleotide-span nucleotide sequence from each gene and took those with 35–55% GC and <20% T using Perl scripts (Wall et al., 2002). Second, we used the BLAST program (Altschul et al., 1997) with word size set at 7 and gap penalty at –3 to reject nucleotide sequences that showed >70% similarity to other genes in the genome. Third, we used the RNAfold program (Zuker and Stiegler, 1981; http://www.tbi.univie.ac.at/%7Eivo/RNA/) to reject nucleotide sequences that showed <–10.5 kcal/mol free energy for the predicted secondary structure. Fourth, we used the Tandem Repeat Finder program (Benson, 1999; http://c3.biomath.mssm.edu/trf.html) to reject nucleotide sequences that contained repetitive sequences. We selected the surviving sequence with the lowest similarity to other genes in the genome as a probe for each gene. When nucleotide sequences satisfying all four criteria were not found, we selected a probe that satisfied as many criteria as possible and was the least similar to other genes in the genome.
We constructed the microarrays using a DNA Microarray Kit (Nippon Laser & Electronics Lab, Japan) according to the manufacturer's instructions. Unmodified oligonucleotide probes were synthesized chemically, purified by gel filtration (Nihon Gene Research Laboratories Inc.), and robotically spotted onto glass slides with a Gtmas Stamp II microarray spotter (Nippon Laser & Electronics Lab, Japan). The concentration of oligonucleotide solutions used for spotting was 3 μM. 45-mer oligonucleotides with artificial nucleotide sequences that show <58% similarity to any T. elongatus genes were spotted as negative control probes. We fragmented the genomic DNA of T. elongatus by sonication and spotted 0.03, 0.1, 0.3, 1, 3, 10, and 30 ng/μl solutions. DNAs were immobilized on glass slides by UV cross-linking at 60 mJ/cm2. Hybridization-ready microarrays were stored in a desiccator at room temperature.
We grew wild-type T. elongatus (Yamaoka et al., 1978) at 50°C under constant light from white fluorescent lamps at 38 μmol m–2 sec–1 (hereafter called LL conditions) in BG-11 liquid medium (Rippka et al., 1979) with bubbling of air containing 5% (v/v) CO2. We subjected the cells to 12 h of darkness to synchronize the circadian clock, and transferred them back to LL. We collected cells for RNA isolation at 2 h (LL2) and 14 h (LL14) after the transfer.
We isolated total RNAs from two independent cultures by the hot-phenol method (Kucho et al., 2004a) and purified them using the SV total RNA isolation system (Promega, WI, USA). We used a mixture of the total RNAs from the two cultures for label-ing reactions. We synthesized fluorescence-labeled cDNA by direct incorporation of Cy3-dUTP or Cy5-dUTP (Amersham Bioscience, NJ, USA) during random-primed reverse transcription, using 5.9 μg total RNA and an RNA fluorescence labeling core kit (M-MLV version 2.0, TaKaRa, Japan). We prehybridized the microarray for 1 h at 42°C in a solution containing 5 × SSC (1 × SSC is 0.15 M NaCl, 0.015 M sodium citrate), 0.1% sodium lauryl sulfate (SDS), and 10 mg/ml bovine serum albumin. We washed the microarray at room temperature in distilled water 3 times for 1 min, rinsed it in 2-propanol, and dried it by centrifugation at 150 × g for 2 min. We performed hybridization for 16 h at 42°C in 12-μL solution containing 5 × SSC, 0.1% SDS, 30% formamide, and heat-denatured labeled cDNA. We then washed the microarray at room temperature with 2 × SSC containing 0.1% SDS for 4 min, with 0.1 × SSC containing 0.1% SDS for 4 min, and 3 times with 0.1 × SSC for 1 min. We dried the microarray by centrifugation. We obtained fluorescence images of Cy3 and Cy5 dye channels using a GenePix 4000B scanner (Axon Instruments, CA, USA).
We used GenePix Pro 5.0 software (Axon Instruments) to determine the signal intensity of each spot and its local background. We calculated net signal intensity by subtracting the median signal intensity of all pixels within the local background area from the median signal intensity of all pixels within the spot area. We visually confirmed the correct recognition of all spot areas by the automatic alignment function of the GenePix Pro. We flagged spots and did not use them for data analysis when any of following occurred: (i) the GenePix Pro did not find the spot area automatically, (ii) the net signal intensity was ð0, (iii) the percentage of saturated pixels in the spot area was Š25, and (iv) severe noise was present. We normalized biases in signal intensity between the two fluorescent dye channels in a microarray by locally weighted linear regression analysis (lowess normalization) (>Yang et al., 2002) using MIDAS software (http://www.tigr.org/software/tm4/midas.html). For all normalization, we set the smoothing parameter to 0.33. Microarray data were deposited in the Gene Expression Omnibus (GEO) (http://www.ncbi.nlm.nih.gov/geo/) under accession number GSE2114.
We used the Student t-test (Sanders, 1995) to evaluate the significance of difference in expression level between LL2 and LL14 (log2[LL14 / LL2]). We controlled type I errors (false positives) by the method of Holm (1979) and considered P < 0.05 as significant.
We used KEGG database (Kanehisa et al., 2002; http://www.genome.jp/dbget-bin/get_htext?T.elongatus.kegg) to assign names, annotations and functional categories of genes (Table 1 and Table 2). Functional categories of some genes were unassigned in KEGG database but they were apparent from our knowledge. In such cases, we discussed the functions in the text (e.g. tll0855, tll0854, tlr2302, and tlr0873).
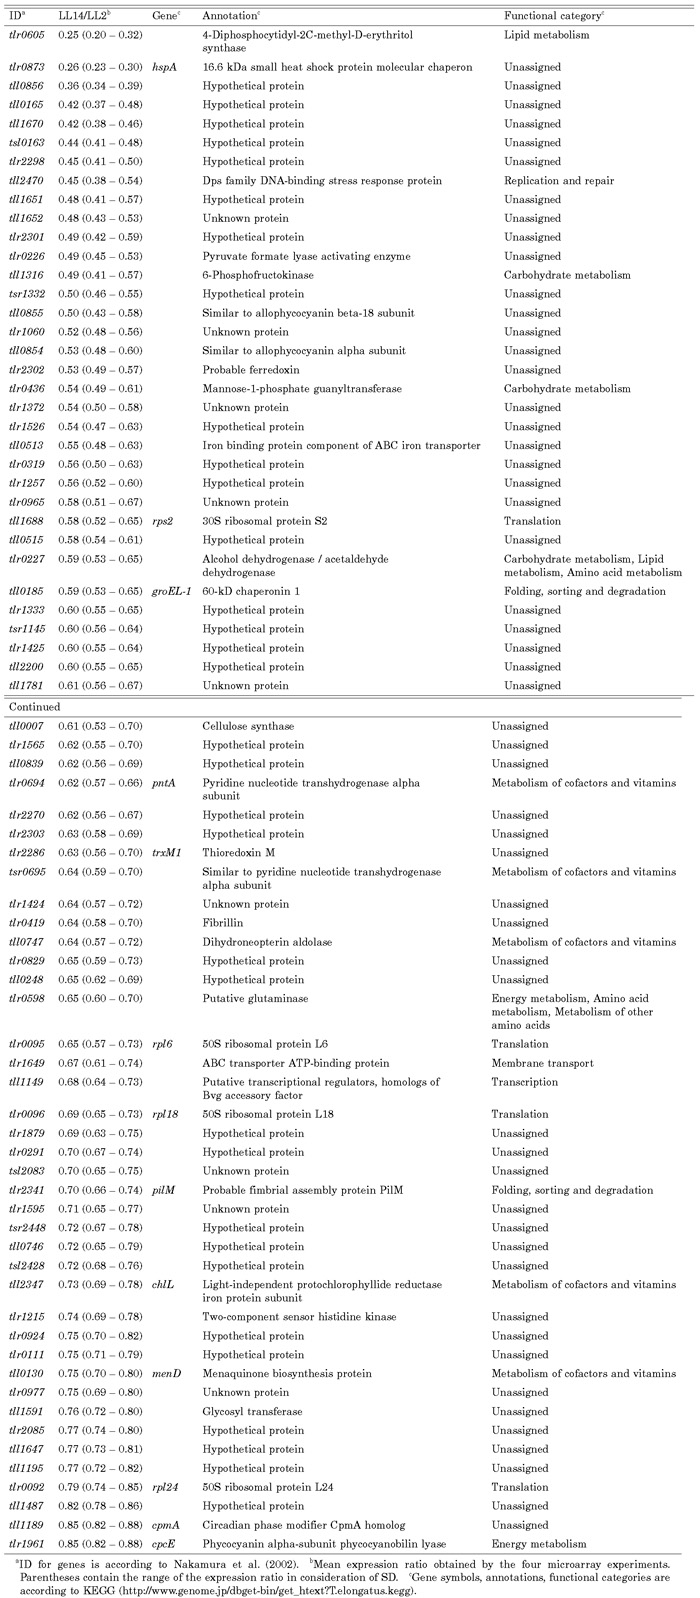 View Details | Table 1. Genes enhanced in the early subjective day (LL2). |
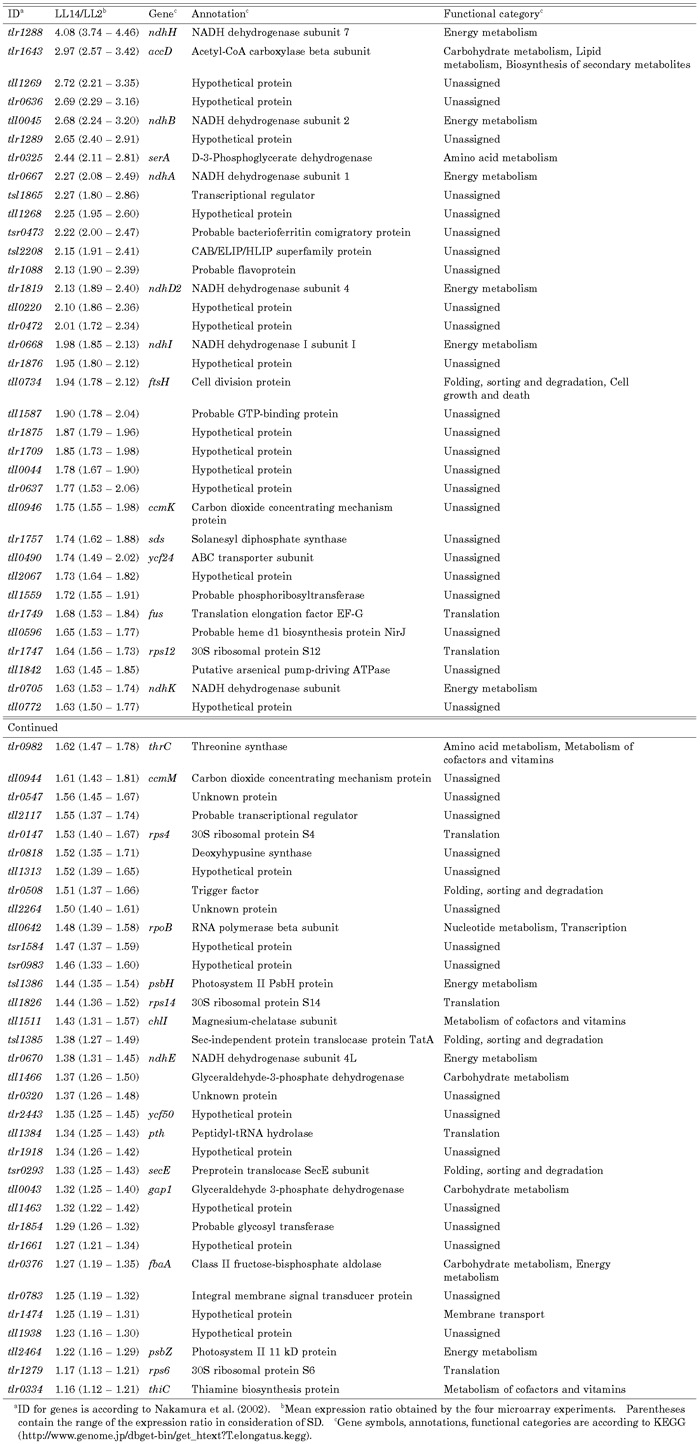 View Details | Table 2. Genes enhanced in the early subjective night (LL14). |
We separated total RNA (5 μg) by electrophoresis on a denaturing agarose gel containing formaldehyde and blotted it to a Biodyne B nylon membrane (Pall, NY, USA) (Sambrook and Russell, 2001). We electrophoresed each RNA sample in three lanes. We end-labeled 45-mer oligonucleotides complementary to the microarray probes with [γ-32P] ATP, and hybridized them in ExpressHyb Hybridization Solution (Clontech, CA, USA) at 60°C for 1 h. We washed the membranes in 0.1 × SSC containing 0.1% SDS at 50°C. We quantified band signal intensities using a BAS2000 image analyzer (Fujifilm, Tokyo, Japan). We used the Student t-test (Sanders, 1995) corrected by the Holm method (Holm, 1979) to evaluate differences in expression level between LL2 and LL14 and considered P < 0.05 significant.
In our previous study, we demonstrated that DNA microarrays with unmodified oligonucleotide probes detected transcripts with sensitivity and specificity when appropriate oligonucleotide sequences were selected (Kucho et al., 2004a). We applied those selection criteria to 2,521 T. elongatus genes. Three ribosomal RNA genes were omitted because their expression levels are extremely high and cannot be precisely quantified by microarray analysis. 2,264 genes (90%) contained at least one optimal probe sequence that satisfied all the selection criteria (see MATERIALS AND METHODS). Such probes could not be designed for 257 (10%) of the genes. Most probes in those genes showed an inappropriate base composition (129 genes) or high sequ-ence similarity to other genes in the genome (105 genes). The latter were members of gene families. In particular, four reverse transcriptase genes shared a completely identical sequence, and 76 putative transposase genes shared 86 to 100% sequence similarity. We therefore included in the microarray a representative gene for each of the gene families.
Using the oligonucleotide probes, we constructed a microarray that represented 2,397 genes (95% of total genes contained in the genome). The microarray also contained 39 control probes (32 negative controls and 7 serial dilutions of genomic DNA). We did not include genes of ð100 bp because such short transcripts are removed during RNA purification. We spotted all the oligonucleotide probes in duplicate. Fig. 1 shows a typical hybridization image of the microarray. The fluorescent signals were uniform and homogeneous, and signal/background contrast was high.
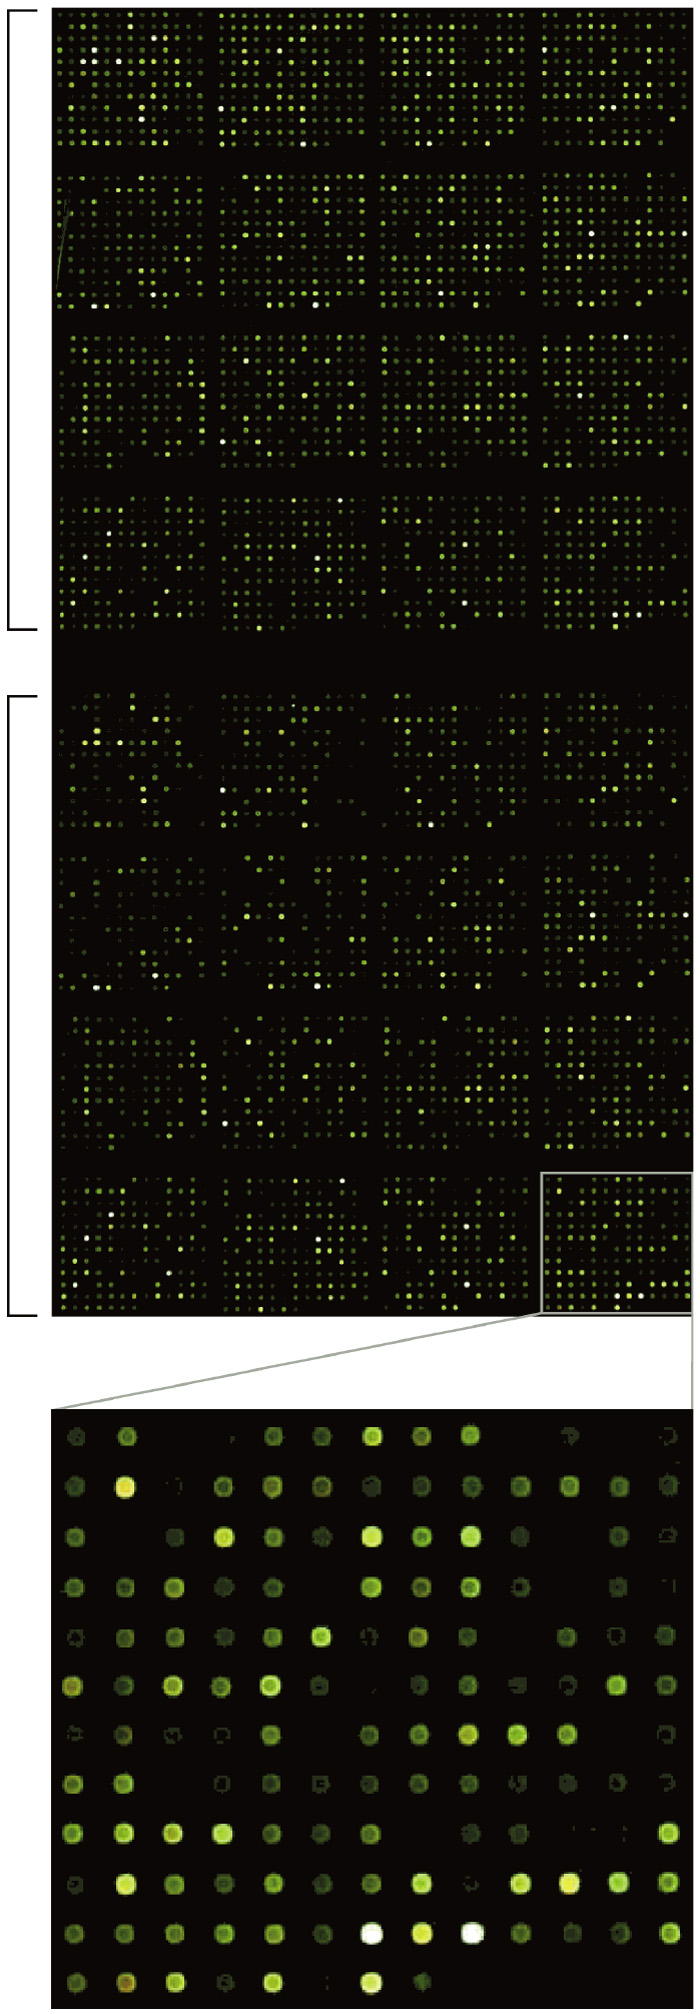 View Details | Fig. 1. A typical hybridization image of the microarray. Brackets represent duplicates. The lower image is a magnified view of a part of the microarray. LL2 and LL14 cDNAs were labeled with Cy5 (red) and Cy3 (green), respectively. |
To evaluate specificity of hybridization, we compared signal intensities between T. elongatus genes and negative control probes whose nucleotide sequences did not show significant similarity to any T. elongatus genes. As shown in Fig. 2, most negative control probes exhibited very low signals while T. elongatus gene probes showed a wide range of signal intensities. This result suggests that sequence-specific hybridizations occurred on the oligonucleotide microarray.
 View Details | Fig. 2. Signal intensities exhibited by T. elongatus gene probes (open squares) and negative control probes (open circles). A representative result (Cy5-labeled LL14 cDNA) is shown. Seven other hybridization images provided similar results (data not shown). |
We compared gene expression levels at two different circadian times — LL2 (early subjective day) and LL14 (early subjective night). The experiment had two purposes: (i) to evaluate the reli-ability of the measurements obtained by the oligonucleotide microarray, and (ii) to screen for candidate clock-controlled genes. We performed two sets of microarray experiments. In one set, two microarrays were hybridized with a mixture of solutions containing LL2 cDNA labeled with Cy3 and LL14 cDNA labeled with Cy5. In the other set, the fluorescent dyes were swapped. The expression ratios (LL14 / LL2) of genes obtained by the two independent microarray hybridizations were similar (correlation coefficient [r] = 0.853 and 0.818) (Fig. 3). Fig. 4 shows the mean expression ratios obtained by the four microarray hybridizations. The microarray contained spots of serial dilutions of T. elongatus genomic DNA. As expected, all the spots showed a signal ratio near 1.0, suggesting that biases in signal intensities between the two fluorescent dye channels were correctly normalized. Using a statistical test, we identified 143 genes whose LL2 and LL14 expression levels were significantly different. The expression of 69 genes was enhanced in the early subjective night (LL14 / LL2 > 1), and the expression of the remaining 74 genes was enhanced in the early subjective day (LL14 / LL2 < 1). We confirmed the expression changes of 20 genes by Northern blot analysis (Fig. 5). Concordance of the expression ratios obtained by the two different methods was high (r = 0.832). The expression changes of 14 (70%) genes detected by Northern blot analysis were statistically significant.
 View Details | Fig. 3. Reproducibility of the expression ratios (LL14 / LL2) of genes obtained by two independent microarray hybridizations. A representative result is shown. Dashed line represents theoretical values for identical expression ratios. |
 View Details | Fig. 4. Comparison of global gene expression in T. elongatus cells between two different circadian times. The log10 of the product of the signal intensities from the two fluorescent dye channels (horizontal axis) roughly corresponds to gene expression level. Open diamonds indicate genes whose expression levels were significantly different between LL2 and LL14. Gray triangles indicate genomic DNA spots. Bars attached to the open diamonds represent the SD for eight measurements at maximum. |
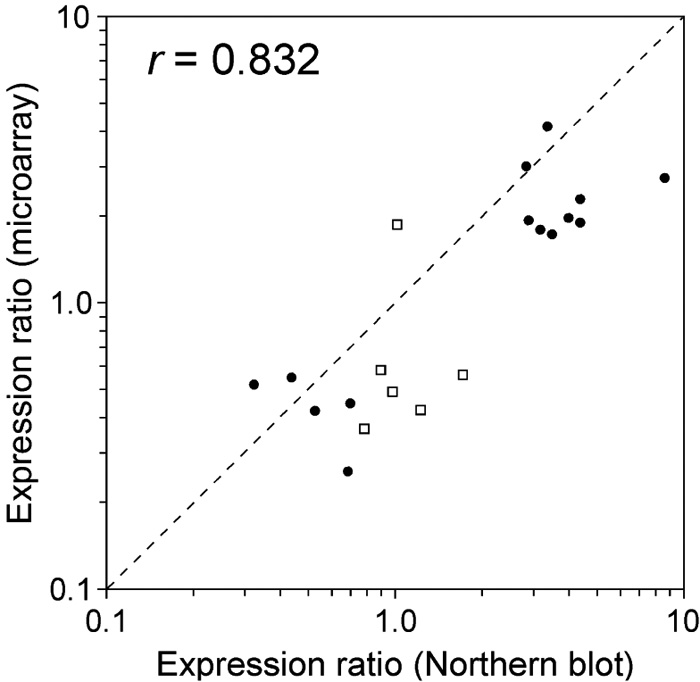 View Details | Fig. 5. Comparison of the expression ratios (LL14 / LL2) obtai-ned by microarray and Northern blot analyses. Closed circles represent genes whose expression changes were statistically significant in Northern blot analysis and open squares represent those that were not. The dashed line represents theoretical values for identical expression ratios. r represents correlation coefficient. |
Table 1 and Table 2 list the genes whose expression was enhanced in the early subjective day (LL2) or early subjective night (LL14). In considering the possible importance of these genes on cellular physiology, we used a functional category list in KEGG (http://www.genome.jp/dbget-bin/get_htext?T.elongatus.kegg). Of the 143 possible clock-controlled genes, 53% were assigned predicted annotations. The physiological roles of the candidate clock-controlled genes were diverse (Fig. 6).
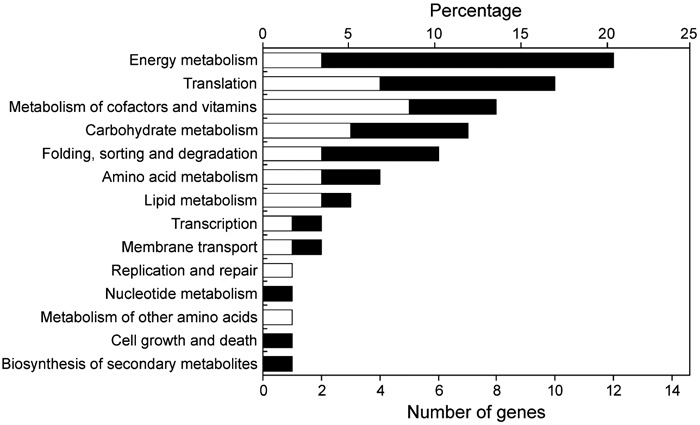 View Details | Fig. 6. Percentage of the candidate clock-controlled genes in each functional category. White and black bars represent genes that were activated in the early subjective day and the early subjective night, respectively. Some genes are represented in more than one category. |
Expression of several genes associated with photosynthesis were enhanced in the early subjective day (Table 1). They included three genes encoding subunits of the light-harvesting phycobilisome complex (tll0855, tll0854, and tlr1961 [cpcE]), the chlL gene (tll2347) encoding the light-independent protochlorophyllide reductase that is involved in chlorophyll synthesis, and a gene encoding ferredoxin (tlr2302), which is a photosystem electron carrier. Two chaperonin genes, hspA and groEL-1 (tlr0873 and tll0185), were also activated in the early subjective day. The chaperonin gene dnaK shows circadian rhythm and peaks just before the subjective morning in the cyanobacterium Synechocystis sp. strain PCC 6803 (Aoki et al., 1995). Circadian regulation of chaperonin genes is important for adaptation to rising atmospheric temperatures in the daytime. We were surprised, therefore, to find such regulation in a thermophilicorganism that inhabits hot springs.
A large number of genes involved in energy metabolism showed differential expression between LL2 and LL14. Expression of most of them was enhanced in the early subjective night (Fig. 6), suggesting their important role in cyanobacterial physiology. These genes contained 7 subunits of the NADH dehydrogenase complex (ndhA, ndhB, ndhD2, ndhE, ndhH, ndhI, and ndhK) that are involved in respiratory electron transport (Table. 2). Intensive circadian regulation of respiratory genes occurs in Synechocystis (Kucho et al., 2004b), and those genes also show peak expressions in the early sub-jective night. Such regulation of respiratory genes would contribute to the supply of night-time energy in cyanobacteria. We found that the ftsH gene (tll0734), which is involved in cell division, was activated in the early subjective night (Table 2). In Synechococcus, another cell division gene, ftsZ, also exhibits circadian rhythm with peak expression in the early subjective night (Mori and Johnson, 2001). The timing of cell division in cyanobacteria is regulated by the circadian clock (Mori et al., 1996). Circadian regulation of the cell division genes may contribute to the cell division rhythm.
Circadian rhythms in genes related to transcription and translation are of particular interest because quantitative oscillation of those genes could play significant roles in the output mechanism of the circadian clock system. We found that many genes involved in translation showed differential expression between LL2 and LL14 (Fig. 6). They included the elongation factor EF-G (fus: tlr1749) and eight ribosomal proteins (rps and rpl genes: tll1688, tlr0095, tlr0096, tlr0092, tlr1747, tlr0147, tll1826, and tlr1279) (Table 1 and Table 2). Such regulation may yield circadian rhythms at the level of protein synthesis. In the green alga Chlamydomonas reinhardtii, genes encoding chloroplast ribosomal proteins show coordinated circadian rhythm and peak in the early subjective day (K. Kucho, K. Okamoto, S. Tabata, H. Fukuzawa and M. Ishiura, an article submitted). In T. elongatus, in contrast, some ribosomal protein genes were activated in the early subjective night while others were activated in the early subjective day (Table 1 and Table 2). A gene encoding the β subunit of RNA polymerase (rpoB: tll0642) was up-regulated in the early subjective night (Table 2).
In summary, we generated full-genome microarrays of T. elongatus using unmodified oligonucleotide probes. We confirmed the specificity and reproducibility of the hybridization signals and demonstrated the usefulness of the unmodified oligonucleotide-based microarray. This microarray should contribute significantly to the genome biology of thermophilic cyanobacteria, and in addition, allow the comparative genomics of transcriptome between those cyanobacteria for which DNA microarrays are available (such as Synechocystis, Synechococcus and Anabaena sp. PCC 7120). Using the oligonucleotide-based microarray, we identified 143 candidate clock-controlled genes involved in diverse physiological functions. More precise analysis (e.g. at 4-h intervals for 48 h) will confirm the circadian status of these genes and provide valuable clues to genome-wide circadian regulation in T. elongatus.
This work was supported by grants from the Japanese Ministry of Education, Science and Culture (MEXT), ‘Program for Promotion of Basic Research Activities for Innovative Biosciences’ (PROBRAIN) promoted by BRAIN, ‘Research for the Future Novel Gene Function Involved in Higher-Order Regulation of Nutrition-Storage in Plants’ promoted by the Japan Society for the Promotion of Science, ‘Ground-based Research Announcement for Space Utilization’ promoted by the Japan Space Forum, ‘National Project on Protein Structural and Functional Analyses’ promoted by MEXT, and ‘Joint-Project for Leading Science and Technology’ promoted by the Aichi Science and Technology Foundation to M.I. Division of Biological Science, Graduate School of Science, Nagoya University was supported by a 21st century COE grant from MEXT.
|