| Edited by Kiichi Fukui. Manuel Ruiz-García: Corresponding author. E-mail: mmura@rib.okayama-u.ac.jp. Edited by Yoko Satta. Manuel Ruiz-García: Corresponding author. E-mail: mruiz@javeriana.edu.co |
The Andean or spectacled bear (Tremarctos ornatus) is one of the most important predators in the Andean mountains in South America.
Its conservation status is problematic: the International Union for Conservation of Nature (IUCN) classified this bear in the vulnerable category (A2bc) whereas the Convention on International Trade of Endangered Species of Wild Fauna and Flora (CITES) listed it in Appendix I, as an endangered species.
The spectacled bears are threatened by habitat degradation, hunting, conflict with cattle ranchers, road building, and illegal trade. On occasion, spectacled bears kill cattle or eat crops, especially maize or grazing pastures, which induces colonists and indigenes to kill them. There is strong evidence that both the habitat use and population density of bears are reduced following the introduction of cattle in wilderness areas. Yerena (1998) claimed that this problem is as great a problem for bears as habitat destruction. Furthermore, the destruction and fragmentation of the bears’ habitat is a relevant threat. Colonization contributes to a massive conversion of forests into pastures for agriculture and cattle grazing. About 73.000 Km2 are involved in this process in the Andean and Piedmont regions (Peyton et al., 1998). At least 20% of the spectacled bear’s range is occupied by landless peasants who are involved in the production and trafficking of narcotics, underdeveloped subsistence farming, mining and road building (Peyton et al., 1998). Moreover, the rate of colonization and habitat clearing is increasing at an exponential rate. Additionally, rivers from the Andes frequently have traces of gold and precious minerals, which provokes intensive exploitation of areas with heavy machinery.
These threats in Colombia result in the death of 50 bears and the loss of 300–500 Km2 of potential bear habitat annually. Sport hunting also accounts for a small number of bear deaths (10 deaths/year) (Orejuela and Jorgenson, 1996). The poaching and illegal international trade of bear parts, such as claws, teeth and gall bladders, to supply the demand for traditional east Asian medicine, have become a new threat, especially in countries like Ecuador.
Only a few ecological studies have been carried out regarding the feeding habits and distribution of this species (Peyton, 1980, 1981; Rodriguez et al., 1986; Yerena, 1994). Those studies pointed out that the spectacled bear is a key and umbrella species in the Andean ecosystem, and needs urgent protection measures in all the countries where it is distributed (Venezuela, Colombia, Ecuador, Perú and Bolivia).
The most outstanding benefits of spectacled bear con-servation are in good harmony with watershed main-tenance (the loss of watershed products due to the destruction of their habitat imperils up to three-quarters of the people in the five Andean nations who live in highland areas close to the bears), biodiversity benefits (the Andean bear range occupies only 3.2% of the land area in South America, but this area contains 76% of the mammal species of this continent; Mares, 1992), and cultural and religious values of indigenous tribes, all highly important to Andean residents (Peyton et al., 1998).
From a phylogenetic perspective this species is also unique. Nash and O’Brien (1987), Goldman et al. (1989), and Waits et al. (1999) demonstrated at the karyological and molecular (allozymes and mtDNA genes) levels that this species constituted a single separated branch from the Panda bear and from the six Ursus species, with an antiquity of around 12–15 million years.
Although in the last decade, DNA microsatellite markers (STRPs, short tandem repeat polymorphisms) have shown amazing power to reconstruct the genetic structure, migrations and natural history of three bear species (Ursus americanus, Paetkau and Strobeck, 1994, 1995; Ursus arctos, Craighead et al., 1995; Paetkau et al. 1998a,b; Taberlet et al., 1995, 1997; Waits et al., 2000; Ursus maritimus, Paetkau et al., 1995, 1999), no molecular studies have been reported for the Third World bear species, with the exception of a preliminary approach to the spectacled bear molecular composition by Ruiz-Garcia (2003). In that study 82 DNA samples were analyzed for four polymorphic microsatellites distributed in Venezuela, Colombia and Ecuador.
In the present study, we analyzed new DNA microsatellite data for 9 STRPs for 155 spectacled bears sampled in the five Andean countries where this species is present. The main aims of this work were as follows: 1- To determine the possible existence of private alleles and differential allele frequencies among the different populations studied. 2- To determine the gene diversity levels of this species within and among populations. 3- To analyze the Hardy-Weinberg equilibrium within local populations and at a global level. 4- To estimate the molecular gene-tic heterogeneity among the diverse spectacled bear populations studied and to make estimates of the gene flow among these populations, and 5- To analyze the precise geographical assignment of the individuals studied to determinate how many gene pools are present in the current distribution of this species.
A total of 155 samples of spectacled bear DNA were collected from the following localities: 50 Colombian animals from 11 different sampling sites, 78 Ecuadorian specimens representing at least six different sampling sites, 12 animals from Venezuela, 5 animals from diverse localities of Peru, but representing one geographical region, and 10 samples from Bolivia representing two different geographical areas. In Fig. 1, the sampling sites of the animals analyzed are shown.
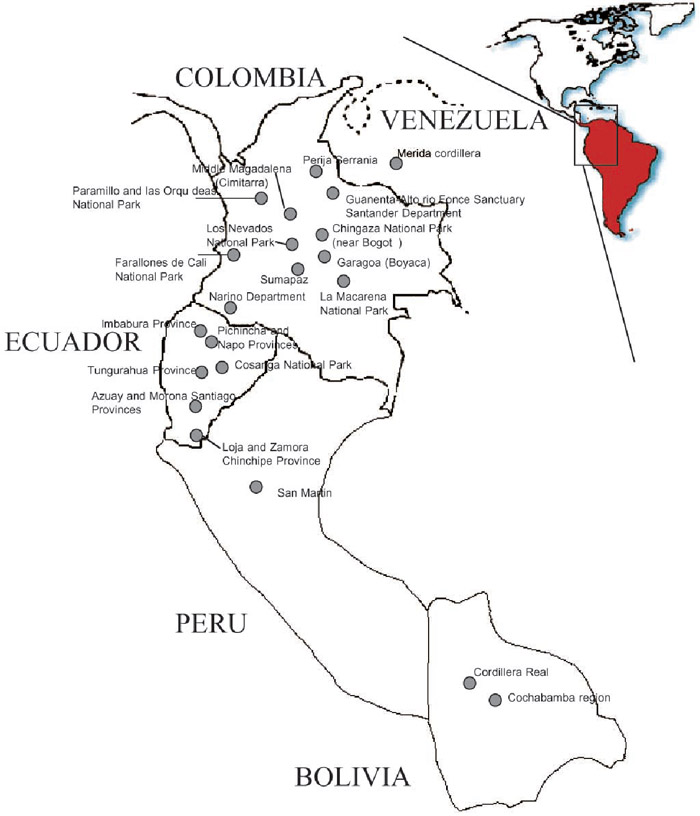 View Details | Fig. 1. Map showing the five Andean countries where the spectacled bear is distributed and the collection sites where samples were obtained. |
These samples were consisted of 5 ml of blood preserved in EDTA disodium, in the case of samples obtained from captured animals with known geographical origins, of rooted hairs directly obtained in the field, pieces of skin from animals killed by hunters, and some teeth, bones and muscle tissues generously provided by hunters and collectors.
Two different methods were used to extract DNA from the blood samples (phenol-chloroform and Chelex resin). For muscle tissues, pieces of skin, teeth and bones, the phenol-chloroform procedure was employed with several modifications of standard techniques. The DNA extraction from the hairs with follicle roots was carried out by using 10–20% Chelex 100 resin (BIO-RAD, USA), with several modifications of the Walsh (1991) procedure. The concentration of DNA extracted from the blood samples ranged from 8 to 1213 ng/μl.
The PCR reactions were performed as follows. The final volume of the PCR reaction, when the template DNA was obtained by the phenol-chloroform or DTAB-CTAB (Doyle and Doyle, 1987) procedure, was 25 μl, and it contained 2.5 μl of 3 mM MgCl2, 2.5 μl of 10x Promega Buffer, 2 μl of 1 mM dNTPs, 10 pmol of each primer (forward and reverse), 13 μl of H2O, 2 μl of DNA and 0.5 units of Taq Polymerase. For PCR with template DNA extracted from hairs by using 10–20% Chelex resin, the overall volume was 50 μl, and it contained 20 μl of DNA and twofold the above amounts of all other components.
The primers used in the present study belonged to loci of the following nine microsatellites, G1A, G1D, G10B, G10C, G10L, G10M, G10P, G10X and UarMU59, and were originally developed for the black bear (Ursus americanus) by Paetkau and Strobeck (1994) and Paetkau et al. (1995), except for UarMU59, which was designed by Taberlet et al. (1997). The PCR reactions were carried out in a Geneamp PCR System 9600 thermocycler (Perkin Elmer, Cetus). The temperatures employed were 95°C for 5 minutes, 35 cycles of 1 minute at 95°C, 1 minute at the most appropriate annealing temperature (52, 55, or 60°C depending on the microsatellite), and 1 minute at 72°C. After the amplification cycles, the extension reaction was carried out at 72°C. The amplification products were kept at 4°C until they were used. The PCR products were electrophoresed in 6% denaturing polyacrylamide gels in a Hoefer SQ3 sequencer and were stained with silver nitrate. This method provides resolution of one nucleotide base difference.
The levels of gene diversity of the spectacled bear populations studied were measured by means of the expected heterozygosity (Nei, 1978). Differences among heterozygosity estimates were analyzed statistically with Student’s t test for sample pairs. The heterozygosity data were arcsine transformed prior to analysis, as proposed by Archie (1985).
The Hardy-Weinberg equilibrium (HWE) was studied by means of the Weir and Cockerham (1984)’s F (W-C F) statistic. To measure the exact probabilities of this statistic, the Markov chain method was employed as it was implemented by Raymond and Rousset (1995) in the GENEPOP v. 3.1 program. The HWE equilibrium was analyzed by locus, by population, and simultaneously by loci and populations employing Fisher’s method.
The genetic heterogeneity among the spectacled bear populations of the five countries was obtained employing diverse strategies. Exact probabilities with Markov chains applying 5000 dememorization, 500 batches and 5000 iterations per batch were used. Furthermore, the hierarchical Wright F statistics were examined by means of the procedure of Michalakis and Excoffier (1996). In addition, the standard deviations of these F statistics were analyzed using jackknifing over populations and over loci with 10000 permutations. Bootstrapping over loci, with 10000 permutations, allowed calculation of the 95 and 99% confidence intervals.
Throughout the genetic heterogeneity statistics, indirect theoretical gene flow estimates (Nm) among the Ecuadorian and the Colombian bear populations, as well as among all the samples studied, were obtained by using the infinite island and the n-dimensional models (Ruiz-Garcia, 1993, 1998, 2000, Ruiz-Garcia and Alvarez, 2000). The gene flow was also calculated using the private allele model (Slatkin, 1985, Barton and Slatkin, 1986). Slatkin and Barton (1989) demonstrated that these procedures are robust for obtaining accurate values of Nm independently of the geographic position of the populations, deviations from gene drift-mutation equilibrium, existence of several types of selection and presence of mutation.
To analyze how many different gene pools there are in the spectacled bear distribution surveyed and to detect possible hybrid individuals among these gene pools, the theory described by Pritchard et al. (2000), and developed in the STRUCTURE program, was employed. This method, which employs Markov chain Monte Carlo (MCMC) procedures and the Gibbs sampler, uses multilocus genotypes to infer population structure, and individuals are simultaneously assigned to specific populations. The model considers K populations, where K may be unknown, and the individuals are assigned tentatively to one population or jointly to two or more populations if their genotypes are considered to be admixed. The original theory considers HWE and linkage equilibrium in a real population. Departures from these assumptions lead the overall sample to be split into different gene pools to which individuals are assigned. The posterior K probabilities are calculated assuming uniform prior values of K, in our case, between 1 and 6 (USEPOPINFO = 0). The presence of the most probable number of gene pools within the data considered is revealed by the increasing likelihood. Once the most likely number of populations is found, the analysis is repeated, but intro-ducing the model with prior geographic population information (USEPOPINFO = 1). The analysis presen-ted herein was carried out with one million iterations, following a burn-period of 30000 iterations. The analysis was performed twice, offering totally convergent results. One advantage of this procedure is that no HWE in the data is needed “a priori” to carry out this analysis.
Finally, the Garza and Williamson (2001) procedure to detect any possible reduction in population size was employed. This procedure is based on the ratio M = k/r, where k is the total number of alleles detected in a given locus and r is the spatial diversity, the distance between alleles in number of repeats and the overall range in allele size. When a population is reduced in size, this ratio will be smaller than in equilibrium populations. To calculate this M value, the program simulates an equilibrium distribution of M and give assumed values for three parameters of the two phase mutation model (θ = 4Neμ, where Ne is the effective number and μ is the mutation rate per generation, ps = mean percentage of mutations that add or delete only one repeat unit, and Δg = mean size of larger mutations). Once M is obtained, it is ranked relative to the equilibrium distribution. Using conventional criteria, there is evidence of a significant reduction in population size if less than 5% of the replicates are below the observed value. The average θ values employed in this analysis were obtained from the MISAT program of Nielsen (1997), as well as ps and Δg. This bottleneck analysis was applied to the Colombian bear sample (θ = 11.18; ps = 93.57%; Δg = 3.5) , to the Ecuadorian bear sample (θ = 8.48; ps = 90.36%; Δg = 3.5) and the total bear sample (θ = 9.72; ps = 90.72%; Δg = 3.5). Other different values were employed but the results were the same. This analysis was carried out with the M-P-Val and Critical-M programs of Garza and Williamson (2001).
Out of nine microsatellites studied, seven were clearly polymorphic in the spectacled bear (Fig. 2) and the other two were monomorphic (G1A and UarMU59). G1D presented four alleles, with one of them predominant (178 bp, 0.859). Six alleles were identified at the G10B locus, with the 160 bp allele having the highest frequency (0.462). G10C showed five alleles, with one allele clearly dominant (105 bp, 0.866). G10M and G10P yielded the highest number of alleles, nine each. G10X presented eight alleles, with two alleles having the greatest frequencies, 125 bp (0.474) and 133 bp (0.237). Seven alleles were observed at the G10L locus.
 View Details | Fig. 2. Histograms of microsatellite allele frequencies determined for the spectacled bear from the five countries. |
It is interesting to note the existence of some private alleles in the spectacled bear samples of each country studied. The most outstanding findings were as follows: For G1D, a 182 bp allele was observed exclusively in Colombia, while a 186 bp allele was exclusively observed in Ecuador. G10C presented an exclusive allele of 109 bp for Venezuela and another of 101 bp for Bolivia. For G10P, the Colombian sample yielded an allele of 137 bp not detected in Ecuador, whereas two alleles of 149 bp and 153 bp were found only in Ecuador. G10X presented alleles of 123 bp and 137 bp in Ecuador but not in Colombia or Venezuela, while 129 bp and 133 bp alleles were only detected in Colombia and Venezuela. At G10L, the Colombian population showed alleles of 127 bp, 129 bp and 137 bp, which were not found in Ecuador. Finally, the 139 bp, 141 bp and 147 bp alleles typically found in Ecuador were not detected in the Colombian samples.
The average number of alleles per locus (ANAP) was 5.67 ± 3.00 (including monomorphic loci). The overall expected heterozygosity was 0.56 ± 0.32.
The ANAP for the samples from Ecuador was 4 ± 3.20. In the case of the samples from Colombia, the value was 3.22 ± 2.22. There was no significant difference between the two countries. For the samples from the other countries, the ANAP values were lower than those for Ecuador and Colombia, although statistical significance was not tested because the sample sizes for these countries were considerably lower than those for Ecuador and Colombia. The ANAP values were as follows: Venezuela 2.67 ± 1.03, Bolivia 1.8 ± 0.84 and Peru 1.3 ± 0.58.
The average expected heterozygosity (HE) for the samples from each country, including the nine microsatellites genotyped, yielded the following picture. Venezuela presented the highest value (HE = 0.571 ± 0.421), followed by Colombia (HE = 0.432 ± 0.341), Ecuador (HE = 0.403 ± 0.325) and Peru-Bolivia (HE = 0.4 ± 0.343). There were no significant differences between these gene diversities when the Archie (1985) procedure to test the differences in HE between samples was employed, although the bears of Venezuela and Colombia seem to have slightly higher levels.
For the overall sample, the unbiased estimates of H-W exact P-values by the Markov chain method for all polymorphic microsatellites taken together (multi-locus test) was 0.0000 ± 0.0000, which put forward an extremely high excess of homozygosity at a global level. Also, the overall significance of the seven microsatellites with the Fisher’s method revealed the non-existence of global HWE (χ2 = infinite, 14 df, p = 0.000000).
The individual analysis of each microsatellite locus showed that all the loci presented positive values of F (W-C), but the ones with significant values were G1D (F = 0.499, P = 0.0013), G10B (F = 0.231, P = 0.0161), G10M (F = 0.294, P = 0.0000), G10X (F = 0.706, P = 0.0000) and G10L (F = 0.325, P = 0.0012). The highest levels of homo-zygous excess were for G10X, G1D and G10L. If Bonferroni’s correction is applied (α’ = 0.00714), G1D, G10M, G10X and G10L continue being significant. Thus, only G10C and G10P did not show significantly homozygous excess.
The independent H-W analyses by locus and by country revealed some interesting traits. For example, in Ecuador all the F values were positive with the exception of G10C (F = –0.03); meanwhile, four loci showed negative values (G1D-F = –0.016), G10B-F = –0.015, G10C-F = –0.083 and G10M-F = –0.239) in Colombia. Even G10M yielded a remarkable heterozygous excess (P = 0.0357) reaching a significant threshold in this country. In Ecuador, G1D (F = 0.634, P = 0.008), G10X (F = 0.532, P = 0094) and G10M (F = 0.366, P = 0.0000) showed a HWE bias with respect to homozygous excess at the 5% level. In the same situation, the Colombian sample only presented a single microsatellite with significant homozygous excess, G10X (F = 0.692, P = 0.0027). If Bonferroni’s correction was applied, this statistical significance disappeared. Therefore, while the Colombian population is near HWE, the Ecuadorian population significantly deviated by homozygous excess of HWE. When HWE was simultaneously measured for both countries (with Bonferroni’s correction), G10M and G10X significantly deviated from HWE, revealing that the Wahlund effect (subdivision effect) among the bear populations of these two countries is mainly provoked by these two loci. The test for all loci taken together and for both samples taken simultaneously showed an evident homozygous excess (χ2 = infinite, 20 df, p = 0.00000), which highlights the existence of more than one gene pool for the Andean bears from Ecuador and Colombia taken together. Otherwise, the test for individual populations revealed a striking homozygous excess bias for the Ecuadorian sample (χ2 = infinite, 14 df, p = 0.00000), whereas no significant departure from HWE was revealed for the overall Colombian sample (χ2 = 18.3, 14 df, p = 0.193). Even the HWE trends among these two samples were opposite for several microsatellites. This was the case for G1D and G10M, especially. The case of the Venezuelan sample resembled that found in Colombia. Several loci (G1D, G10B and G10X) showed high positive values of F, although no statistical significance was reached by the low sample value of specimens from Venezuela, while G10C and G10P presented negative values (heterozygous excess), although without reaching statistical significance. For the Bolivian and the Peruvian cases, only a few loci could be studied because of the small number of DNA samples analyzed. G10C and G10X yielded positive values for Bolivia but significance was not reached. For Peru, the single locus studied for this analysis, G10P, also showed positive but not statistically significant F values. Therefore, the Colombian population showed the more limited HWE bias (FIS = 0.099), with Venezuela (FIS = 0.396), Ecuador (FIS = 0.394) and Peru-Bolivia (FIS = 0.688) showing higher levels, although only the Ecuadorian value was significant.
First we examined the level of genic differentiation between the Colombian and the Ecuadorian samples by means of Markov chains. G1D, G10C and G10P did not show significant differences. Nevertheless, conspicuous significant differences were seen for G10B (p = 0.00001), G10M (p = 0.00094), G10X (p = 0.00000) and G10L (p = 0.0019). Applying Bonferroni’s correction, all these values were also significant. The overall genic differentiation was straightforwardly significant (χ2 = infinite, 14 df, p = 0.000001). These two populations therefore represent at least two different gene pools. The gene flow estimate made by means of the private allele method was Nm = 0.2727, which indicates a practically absent or very limited gene flow among the spectacled bear populations.
Secondly, we obtained some insights about the genic differentiation among the five countries where samples were simultaneously obtained. Two loci, G1D and G10P, did not show significant heterogeneity throughout the range of the spectacled bear. G10C showed significant heterogeneity in this case (p = 0.00412) regard to the Colombia-Ecuador comparison. The other loci showed extremely significant heterogeneity as well: G10B (p = 0.00000), G10M (p = 0.01823), G10X (p = 0.00000) and G10L (p = 0.00163). The significance disappeared in the case of the G10M locus when Bonferroni’s correction was employed. G10B and G10X were the markers which discriminated most accurately among all these spectacled bear samples. The overall genic differentiation taking into account all loci studied was noteworthly significant (χ2 = infinite, 14 df, p = 0.00000). The gene flow estimate throughout the range of the spectacled bear as determined by the private allele method again showed a low value (Nm = 0.64989). This value was slightly higher than that determined between Colombia and Ecuador, although it still supports the scenario of very limited gene flow. This slightly higher Nm value, for the five countries taken together, than that detected only for the Ecuador-Colombia pair, means that among other country pairs, such as Ecuador-Perú, Ecuador-Bolivia, Ecuador-Perú and Colombia-Venezuela, the gene flow is higher than between the populations from Colombia and Ecuador.
The probability values for genic differentiation for each population pair locus-by-locus are shown in Table 1. The only significant difference for G1D was between Colombia and Venezuela, although no significant heterogeneity was maintained when Bonferroni’s correction was employed. G10B showed highly significant differences among pairwise comparisons for Venezuela, Colombia and Ecuador. The value obtained for the Ecuadorian-Venezuelan comparison was the only one significant for the G10C locus, while the Ecuadorian-Colombian comparison was the only one significant for G10M. For G10P, the differentiation is highly limited. Only the Ecuadorian-Venezuelan comparison gave a significant difference at the 5% level, which disappeared with Bonferroni’s correction. In contrast, G10X was the locus yielding the highest degree of differentiation among all the samples analyzed. Venezuela and Colombia were outstandingly differentiated from Ecuador, while Colombia was differentiated from Bolivia and Peru, and Venezuela from Peru. Significant differences were noted between the Ecuador and Bolivia samples, and in turn between the samples from Bolivia and Peru. G10L showed significant differences between Colombia and Ecuador, and between Ecuador and Bolivia.
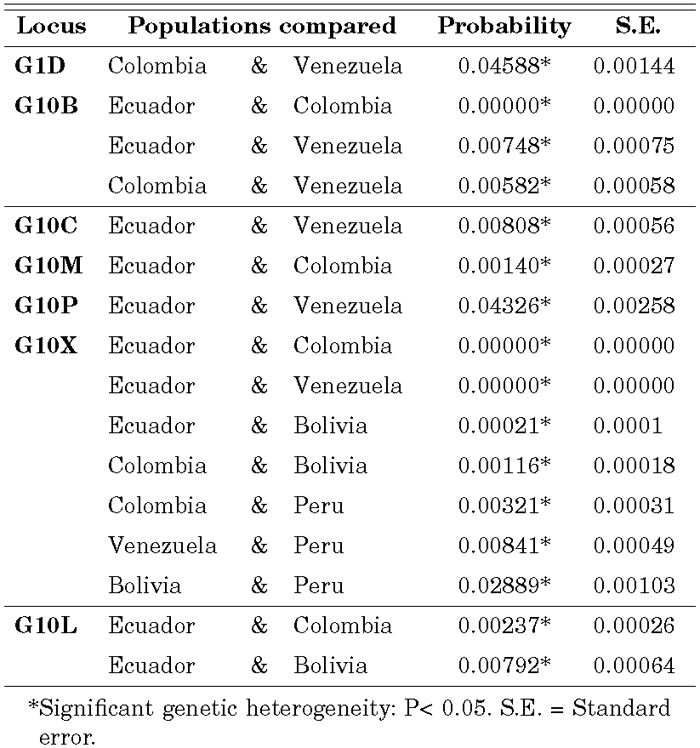 View Details | Table 1. All significant population pair comparisons for each one of the microsatellites studied. |
F hierarchical estimates revealed the existence of a significant structure for the spectacled bear (Table 2). The overall values of FIT (= 0.386), FIS (= 0.254), and FST (= 0.176) clearly revealed this fact. G10C and G10P did not add relevant amounts to this structure; G1D showed important deviations from HWE at the total and at the subpopulation levels; meanwhile, all the other polymorphic microsatellites yielded strong HWE deviations at both hierarchical levels as well as high heterogeneity levels. Especially relevant was the apportionment effectuated by G10X to this structure. Jackknifing and bootstrapping over loci yielded standard errors and confidence intervals, which clearly supported the statistical significance of the F values obtained (Table 2). With Bonferroni’s criteria, G1D and G10X were the loci that showed the most significant FIS values; G1D, G10B, G10M, G10X and G10L and all loci yielded significant FIT values. Assuming random mating within samples, G10B, G10C, G10M, G10X, G10L and all loci together presented significant FST values. Meanwhile, if random mating within samples was not assumed, only G10B, G10X and G10C showed significant FST values.
 View Details | Table 2. A) Hierarchical F-statistics of the Andean bear populations studied. B) Significance probabilities of FIS , FIT and FST statistics by means of 10000 randomisations of alleles within samples (FIS), of alleles over samples (FIT), assuming random mating within samples with exact G-tests (FST), and not assuming random mating within samples with log-likelihood G tests (FST). |
The gene flow estimates with these statistics were low but slightly higher than those obtained with the private allele method. The average FST value yielded Nm = 1.170 for the infinite island model and Nm = 0.658 for the n-dimensional model.
Two appro-aches were employed for this analysis. First, uninformative priors on all K were assumed, which means that before applying the model to the data, all samples were assigned to a hypothetical single population (USEPOPINFO = 0). The probability of the number of populations (K) for the pooled data was estimated, without using prior population information, by fixing prior values of K = 1–6 and comparing the Ln likelihood values for each one of the K values. If the hypothetical single population is admixed and includes more than one population within itself, the likelihood values will be increased with K. Once the value of K has been determined, the second modeling approach is applied. Then we assume that samples should belong to one of the K populations predefined and asked the program to assign the individuals and infer the ancestry of possible hybrids by means of the option USEPOPINFO = 1. We analyzed different cases: Colombia and Ecuador, only Colombia, only Ecuador, and finally Venezuela, Colombia and Ecuador, all of them pooled. In this analysis, the Bolivian and the Peruvian data were excluded because of their small sample sizes. When the Colombia-Ecuador group as well as the Venezuela-Colombia-Ecuador data were analyzed, the most optimal Ln likelihood value corresponded to K = 2 (Table 3). Therefore, it is clear that two spectacled bear gene pools exist across all the northern Andean area. When the analysis was extended to only the samples from Colombia or from Ecuador, the highest Ln likelihood value corresponded to K = 1. Hence, each population in these countries represents a single gene pool, and Venezuelan bears might be included into the gene pool of the Colombian population.
 View Details | Table 3. Determination of the most probable number of gene pools forming the Andean bear populations of Venezuela. Colombia and Ecuador (Ven/Col/Ecu), of Ecuador and Colombia (Ecu/Col) taken together, and Ecuador and Colombia individually. We assumed uninformative priors on all K as each sample belonged to a hypothetical single population (USEPOPINFO = 0). The highest Ln likelihood value indicates the most probable number of different gene pools within these samples. Two gene pools were detected for the Venezuela-Colombia-Ecuador sample and for the Colombia-Ecuador sample, whereas only one gene pool was detected within Ecuador and within Colombia, respectively. |
The analysis extended to an assignment of individuals to specific gene pools was as follows. When USEPOPINF = 0 was employed (no bear was assigned a priori to a determined country ), the probability (q) that each genotype belonged to each of the two clusters detected was 0.761 (Ecuadorian pool) and 0.239 (Colombian pool) for the Ecuadorian individuals, and 0.692 (Colombian pool) and 0.308 (Ecuadorian pool) for the Colombian specimens. Several Ecuadorian individuals yielded higher q probabilities for belonging to the Colombian-Venezuelan cluster than to its own cluster. All these animals were from the Cosanga region (Ecuadorian Eastern Andes) and from the Alto Chocó region (Ecuadorian Western Andes) placed at the north of Ecuador. Two individuals showed similar q probability values (0.443–0.557 and 0.496–0.504, respectively), which suggests that they are hybrids of both gene pools or direct descendents of such hybrids. Also, several Colombian individuals showed higher q probability values for the Ecuadorian cluster than for the Venezuelan-Colombian group. Most of these Colombian bears were from the Nariño region, which, as it was previously mentioned, is limiting with Ecuador. A few individuals were probably hybrids or descendents of such hybrids among both these gene pools (five animals). One individual clearly belonged to the Ecuadorian cluster (0.953 vs 0.047) although it was sampled within Colombia. Four Venezuelan bears with known geographical origins were included in this analysis. Three of them were clearly assigned together to the Colombian animals, whereas one exemplar was more likely to belong to the Colombian cluster. When USEPOPINF = 1 was employed (animals classified in the countries’ samples before the assignment analysis), the posterior probability (q) of each genotype to belong to each of the two clusters detected was 0.982 (Ecuadorian pool) and 0.018 (Colombian pool) for the Ecuadorian individuals, and 0.944 (Colombian pool) and 0.056 (Ecuadorian pool) for the Colombian specimens, while the probabilities for the Venezuelan animals were 0.658 to belong to the Colombian set and 0.342 to belong to the Ecuadorian cluster. With this procedure, the individuals were assigned correctly to the countries where they were sampled. The single exception was a Colombian individual showing a higher probability to belong to the Ecuadorian cluster than to the Colombian-Venezuelan group.
Significant values were not obta-ined in either of the Garza and Williamson (2001) test. For the Colombian sample, the average M obtained was 0.8262, while the expected average mean of M in equilibrium was 0.7898 and 95% of the equilibrium values should be under the critical value of Mc = 0.6782 for an equilibrium population. For Ecuador, the average M obtained was 0.8450, while the expected average mean of M in equilibrium was 0.7844 and 95% of the equilibrium values should be under the critical value of Mc = 0.6692 for an equilibrium population. Finally, for the total sample, the average M obtained was 0.8863, while the expec-ted average mean of M in equilibrium was 0.8068 and 95% of the equilibrium values should be under the critical value of Mc = 0.7011 for an equilibrium population. Therefore, no bottlenecks were detected in the Colombian, Ecuadorian or total samples, although the levels of gene diversity were limited in our samples.
The gene diversity of the spectacled bear populations analyzed by countries was limited and lower, in general, than that reported for other neotropical carnivores using microsatellite DNA markers as well. The Venezuelan estimate was slightly higher (H = 0.57) than the values found for the other country sets, while the levels of Colombia (0.43), Ecuador (0.4) and Bolivia-Peru (0.4) were practically identical. For instance, these amounts were approximately only half the gene diversity levels determined for jaguars (H = 0.83), pumas (H = 0.75), Leopardus pardalis (H = 0.84), and L. wiedii (H = 0.85) in Colombia for a similar number of microsatellites studied (Ruiz-Garcia, 2001; Ruiz-Garcia et al. 2005a, b). Even some neotropical primate species, such as Lagothrix lagotricha (H = 0.61), which showed strong evidence of crossing a recent bottleneck (Ruiz-Garcia, 2004), also yielded higher gene diversity levels than the spectacled bear. The effect of “ascertainment bias” (Ellegren et al., 1995, 1997, Amos and Rubinsztein, 1996) cannot be excluded in the case of the microsatellites employed herein for the spectacled bear, because they were designed for the American black bear. Previous studies have revealed that the split among the Ursus and the Tremarctos lineages occurred 12–15 millions years ago (Waits et al., 1999) and this could be the motif of the low gene diversity level found in the Andean bear. Nevertheless, the microsatellites employed for the Neotropical wild cats, which include the ocelot and the Pantherine lineages, were constructed for the domestic cat (Menotti-Raymond and O’Brien, 1995). These lineages diverged with regard to the domestic cat 6–7 and 4–5 millions years ago, respectively (Johnson and O’Brien, 1997). Therefore, the same “ascertainment bias” could be invoked for these other Neotropical mammal species. However, none of these species showed levels of gene diversity as low as the spectacled bear.
The gene diversity levels reported for other bear species were higher than those reported herein for the spectacled bear. Waits et al. (2000) showed a list of genetic diversity values for several brown bear studies in North America and Scandinavia with the same markers employed here. Those studies determined heterozygosity levels that ranged from 0.61 to 0.78. The population of brown bear with the lowest genetic diversity reported up to now was that of Kodiac Island (H = 0.265) (Paetkau et al., 1998b). Two black bear populations surveyed in two continental Canadian areas showed a genetic diversity level around 0.8, whereas an insular Newfoundland population had an average heterozygosity value of 0.41 (Paetkau and Strobeck, 1994), similar to the gene diversity of the spectacled bear populations reported herein.
Ruiz-Garcia (2003) analyzed 82 samples of spectacled bears, including 8 individuals from Venezuela and 32 individuals from Colombia (from four different areas), and both populations showed the highest levels of gene diversity. In the current work with greater sample sizes, the northernmost populations (again Venezuela and Colombia) also showed slightly higher levels of gene diversity than the southernmost Andean bear populations studied. Hence, the level of genetic diversity seems not to be biased by the sample size employed. This may reflect the original colonization process of this species across South America, with the northernmost populations being the original ones (and showing the highest levels of gene diversity) while the southern populations were formed by little propagules coming from the northern populations and thus lost gene diversity by reiterative founder effects. However, more southern samples must be studied before definitively affirming that the more southern a spectacled bear population is, the lower its gene diversity is.
One potential use of the presence of private alleles and other alleles with highly differentiated frequencies between Ecuador and Colombia as well as the existence of some private alleles detected in Venezuela or Bolivia is the exact geographical determination of the origins of exemplars in the zoos or from decommissions. All the spectacled bears in European zoos, for example, are descendants from a single pair of unknown origin. Our microsatellite data will be utilized to determine the geographical origins of these animals.
The detection of private alleles in the Venezuelan and in the Bolivian samples, of which the sample sizes were small, could be an indication that more new alleles could be found within these populations and the discrimination power could significantly increase.
Several possibilities can account for the heterozygous deficiencies at the global level and in the Ecuador samples (Rooney et al., 1999, Spong et al., 2000): population subdivision (Wahlund effect), strong genetic drift and consanguinity, hitchhiking, null alleles, synteny or natural selection in favor of homozygotes. The most plausible explanation for the spectacled bear could be population subdivision by the existence of diverse gene pools due to current habitat fragmentation or more possibly due to ancestral population fragmentation during the colonization of the continent by this species. Strong gene drift and elevated consanguinity could be not totally ruled out since the genetic diversity levels of the spectacled bear populations seem to be low for the molecular markers employed. Nevertheless, elevated consanguinity should affect all loci studied similarly at the lowest sampling levels and this was not apparent in the samples studied. Hitchhiking and synteny were ruled out since the loci studied were deliberately distributed in different chromosomes, and the possibility of all loci being affected is low. The same explanation could be used to rule out natural selection in favor of homozygosity. Null alleles also seem unlikely to produce similar levels of homozygous excess simultaneously for all the loci studied. As previously cited, the possible levels of null allele frequencies were low in the current data.
The fact that in each country’s sample the microsatellite loci which showed significant homozygous excess were different (for instance, G1D, G10M and the overall for Ecuador and Colombia) together with the differential allele behavior within each locus for G1D, G10M, G10X in each population is an indication that these HWE deviations were not the result of uniform selective constrictions on these microsatellites; rather, they were more dependent on the population dynamics within each population considered.
Although the gene diversity levels detected with microsatellites for the spectacled bear are limited in comparison with other mammals, no bottlenecks were detected in Colombia, Ecuador, nor in the total sample analyzed. In a previous study (Ruiz-García, 2003) using fewersamples, the bottleneck program following the theory of Cornuet and Luikart (1996) did not detect any significant evidence of recent bottlenecks in the spectacled bear. In the current work, employing another bottleneck test, again no evidence of population reduction was obtained. Therefore, we believe that the spectacled bear populations have maintained small effective sizes from the onset of the colonization to South-America, and no drastic reduction in size occurred in recent times.
We showed that the major fraction of pairs with significant genetic heterogeneity were between the Ecuadorian sample and those from Colombia and Venezuela. This could be taken as the first strong evidence for two differentiated gene pools in these countries. The Peruvian and the Bolivian samples were relatively similar to the Ecuadorian one, although several findings may also indicate subdivision between them (G10X and G10L), but more DNA samples from Bolivia and Peru should be studied to determine if they constitute gene pools different from that shown for Ecuador.
Recall that Wright (1943, 1951) showed that if Nm > 1 (in an infinite island model) or Nm > 4 (in a stepping-stone model), the gene flow is sufficient to attenuate the genetic differentiation between populations balanced for migration and gene drift. According to the infinite island model, if 1 < Nm < 0.5, genetic differentiation among populations could be small but important in a stepping-stone model. When Nm < 0.5, the populations are largely unconnected under any model of gene flow. Our estimates indicated that the Colombian and the Ecuadorian samples represented two populations that evolved independently long time ago, but a certain small amount of gene flow could have occurred between them. Interestingly, the gene flow could have been higher among populations of central and northern Colombia and the Venezuelan ones, and among the Ecuadorian population and the surrounding Peruvian and Bolivian ones. It is interesting to note that all the gene flow estimates obtained with different procedures were similar and that Slatkin and Barton (1989) showed that the methods employed herein are robust independently of the geographical position of the populations, the lack of existence of gene drift-gene flow equilibrium or, even under the presence of natural selection affecting some marker.
The high levels of the correct assignment with and without prior geographic information among the Ecuadorian and the Colombian samples further supported the finding of the previous analyses: basically the Ecuadorian and the Colombian-Venezuelan populations constituted two highly differentiated gene pools. Similarly, when the number of potential different gene pools was analyzed within Ecuador and Colombia, only one population was detected within each of these countries. The STRUCTURE results with incorporated geographical information practically differentiated all samples by countries (Ecuador and Colombia) except one (1.7%). Keeping in mind that more microsatellites and other molecular traits should be analyzed (mitochondrial and Y-chromosome sequences), it is probably important to consider each one of these gene pools as separate management units (MUs) (Moritz, 1994) for the moment. If comparative forthcoming results with mtDNA and Y-chromosome markers could demonstrate a strong phylogeographic structure, even the category of evolutionary significant units (ESUs) could be assigned for these different Andean bear populations.
It is also remarkable that some Ecuadorian individuals from the middle northern part of Ecuador (Cosanga region at the Eastern Andean cordillera and Alto Chocó at the Western Andean cordillera) were more related genotypically to the Colombian group than to the Ecuadorian one when no “a priori” geographical information was provided. Two explanations are possible: (1) it is a simple spurious result; (2) they represent immigrants, or descendents of immigrants, from central Colombia, subsequent to the formation of the Ecuadorian gene pool, which did not hybridize with the oldest Ecuadorian pool. If so, within the Ecuadorian pool we could find animals representing lineages which have typically Venezuelan-Colombian traits and that migrated within these areas more recently and did not mix with individuals from the most ancestral Ecuadorian pool. This explanation agrees quite well with the significant homozygous excess detected within Ecuador. What historical event, or geographical barrier, occurred between the Colombian and Venezuelan gene pool and the Ecuadorian one is unknown at present. It might be informative to analyze the possibility of a hybrid zone at the extreme southern area of Colombia and the northern area of Ecuador.
Some of the future analyses that we want to undertake with the spectacled bear are as follows: 1) Testing microsatellite markers that were constructed for other species such as the Giant Panda bear (Lu et al., 2001)(Ame-μ). As this last species represents another different bear lineage, it would be interesting to observe whether the gene diversity is also low for the spectacled bear, which could demonstrate if this species really has an important depression of gene diversity. 2) Sequencing several mtDNA genes to determine the possible females lineages and the migration routes of the females and 3) Further genetic analyses with larger numbers of samples, especially for the populations in Peruvian and Bolivian lands, to determine exactly how many different gene pools are present in those countries. These forthcoming results will help us to construct a proper conservation program for the spectacled bear.
The authors are extremely grateful to the WSPA (World Society for the Protection of Animals) at its Latin America office in Costa Rica (Mr. Huertas) and to the Academic Vicerrectory of the Pontificia Universidad Javeriana at Bogotá, Colombia, for providing monetary resources to carry out this investigation. Also thanks go to many researchers who contributed to obtaining samples of Andean bears. They are Andres Eloy Bracho (Venezuela), Sergio Sandoval, Fernando Nassar, Jorge Gardeazabal, Luz Mercedes Borrero, Marcela Ramirez, Ricardo Botero, Luis Carrillo, Daniel Rodriguez, Jhon Poveda, Haidy Monsalve and Pedro Moreno (Colombia), Heinz Pflenge, Hugo Galvez and Judith Figueroa, “Pocahontas” (Peru) and Robert Wallace (WCS), Susan Paisley and Alvaro Gaitan as director of the Coleccion Boliviana de Fauna (CBF) at the Natural History Museum of La Paz (Bolivia), Huascar Azurday and the Noel Kempff Natural History Museum at Santa Cruz (Bolivia). Finally, the authors are indebted to Dr. Diana Alvarez for help with tables and figures.
|