| Edited by Fumio Tajima. Hidenori Tachida: Corresponding author. E-mail: htachscb@mbox.nc.kyushu-u.ac.jp |
DNA polymorphisms record past evolutionary processes more fully than other types of genetic data, such as allozymes and RFLPs (Tajima 1983; Hudson 1990). Recent progress in sequencing technology provides us opportunities to obtain such data in various organisms, each of which has its own evolutionary history and thus is expected to have been influenced by different evolutionary processes. Indeed, contrasting patterns of DNA polymorphisms are starting to be revealed among species and suggest differing evolutionary forces in the history of the species (e. g., Bustamante et al. 2002). Accumulation of such data for a wide variety of species is important for a general understanding of mechanisms of molecular evolution.
Conifers generally have long generation times, and their local populations are less genetically differentiated compared to other plant species, probably due to wind-pollination (Hamrick and Godt 1996). Therefore, we expect to find different patterns of evolution in these species compared to herbaceous species such as Arabidopsis, Zea and rice, that have been studied extensively as plant model organisms (Aguadé 2001; Tenaillon et al. 2001; Miyashita et al. 2005; Wright and Gaut 2005). In a previous paper (Kado et al. 2003), we investigated DNA polymorphisms at seven nuclear loci in a conifer, Cryptomeria japonica. This species, which is presently distributed only in Japan, has low levels of genetic diversity compared to the herbaceous species listed above. Also the patterns of genetic variation indicated past population size change, low population recombination rates and a few loci suggesting action of selection. Several questions have arisen during that study: Firstly, because we wanted to sequence haploid genomes, we sampled plus trees from artificial forests. This was because it was easy to obtain seeds (and thereby megagametephytes) from them. Plus trees are elite trees that have favorable characteristics, such as fast growth, pathogen resistance and freeze resistance. Thousands of plus trees were selected from artificial and natural forests and have been kept in local seed orchards. We assumed that plus trees represented samples from nearby natural forests, but this assumption needs to be examined empirically. Secondly, we examined DNA polymorphisms only in C. japonica. Therefore, we do not know how specific the patterns of polymorphisms are to the species. So it would be interesting to examine DNA polymorphisms of other related species. Taxodium distichum is one of the closet relatives of C. japonica (Gadek et al. 2000; Kusumi et al. 2000). The average silent divergence between the two species across 7 nuclear loci is 0.0898 per site (Kado et al. 2003) and it is, for example, smaller than the silent divergences at five loci between Arabidoposi thaliana and A. lyrata (Kuittinen and Aguade 2000). Taxodium distichum includes three varieties, bald cypress (var. distichum), pond cypress (var. imbricarium) and Montezuma bald cypress (var. mexicanum) (Watson 1985). Samples from bald cypress and pond cypress were used in this study and both occur in the south-eastern United States. Both C. japonica and T. distichum can live more than 1000 years in the absence of natural disasters and human activity (Page 1990). Though both species are considered to have retreated to refugia during the last glacial maximum (Tsukada 1982; Watts 1980; Watts et al. 1992), they currently have very different habitats, T. distichum being much more widely distributed and adapted to aquatic environments. Because most gene functions are expected to be similar in closely related species, differences of diversity patterns, if they are detected, would reflect subtle changes in environments and population structures among them. Thus, one may naturally ask what different patterns of polymorphisms would be observed in these two closely related species.
In this paper, we report a survey of DNA polymorphisms in natural populations of C. japonica and T. distichum using diploid DNA extracted from leaves to address the two questions mentioned above. In order to avoid cloning of PCR products, we chose one exon each from some of the nuclear loci surveyed by the previous study (Kado et al. 2003) and directly sequenced PCR products. We found that, as a whole, natural and artificial forests of C. japonica were little differentiated from each other and that T. distichum had different patterns of DNA polymorphisms compared to C. japonica. These results suggest that different evolutionary processes have influenced the current variation of the two species.
Leaves of eight individuals of C. japonica were collected from each of four natural populations in Japan: Fuji (FUJ), Toudoh-Sado (TDS), Tateyama (TTY), and Yanase (YNS) (Fig. 1A). Sampled individuals were at least 50 m apart from each other in FUJ, TDS and YNS populations and at least 5 m apart in the TTY population because this population was small and isolated from the other populations and it was difficult to obtain enough samples. Leaves of bald cypress (T. distichum var. distichum) were collected from St. Mark in Florida (SMB), and leaves of pond cypress (var. imbricarium) were collected from Starkey in Florida (SD1) (Fig. 1B). Eight individuals of each variety were used for the analyses.
 View Details | Fig. 1. Locations of samples. (A) C. japonica. (B) T. distichum. |
We analyzed partial sequences of four genes coding for ferredoxin (Ferr), glutamyl-tRNA reductase (HemA), lycopene beta cyclase (Lcyb), and phosphoribosylanthranilate transferase (Pat) in the two species. We also analyzed the Class I Chitinase (Chi1) gene in C. japonica but not in T. distichum. A published Chi1 sequence of T. distichum (GenBank accession no. AB096607; Kado et al. 2003) was used for the analyses. These loci were used for studies of molecular evolution (Kusumi et al. 2002) and/or of population polymorphisms (Kado et al. 2003). Primers for PCR amplifications (Table 1) were designed based on the expressed sequence tags (ESTs) database (Ujino-Ihara et al. 2000) and sequenced-tagged-site (STS) markers (Tsumura et al. 1997; unpublished results).
 View Details | Table 1. List of primers used for PCR amplification |
We used genomic DNA of C. japonica extracted by the authors of Tsumura and Tomaru (1999) and that of T. distichum extracted by the authors of Tsumura et al. (1999) using the modified CTAB method (Murray and Thompson 1980). Amplified products were purified by QIAquick PCR purification kit (QIAGEN) and then directly sequenced for both strands on the ABI Prism 3100 sequencer (Applied Biosystems Inc.) using BigDyeTM Terminator v 3.0 Cyclesequencing Ready Reaction Kit. Primers for cycle sequencing reactions were designed about every 400 bp in both strands.
We aligned sequences manually using SeqPup (http://iubio.bio.indiana.edu/soft/molbio/seqpup/). Because we determined DNA sequences of two alleles within an individual together by direct sequencing, we could not determine their haplotypes. Polymorphism data were analyzed using the program package DnaSP ver. 3.5 (Rozas and Rozas 1999). We obtained estimates of the population mutation parameter, θ, using π (Nei and Li 1979), and θw (Watterson 1975). Tests of neutrality based on D (Tajima 1989), D*, D, F*, F (Fu and Li 1993) and H = π – θH, where θH is an estimator of θ from frequencies of derived variants (Fay and Wu 2000), were carried out. We used the program provided by J. Fay’s web page (http://crimp.lbl.gov/index.html) for the H test. In the H test, we used K/3 as the back mutation rate, where K is divergence between the two species. The McDonald and Kreitman (MK) and Hudson-Kreitman-Aguadé (HKA) tests were also performed to test neutrality (McDonald and Kreitman 1991; Hudson et al. 1987). The FST statistics (Hudson et al. 1992b) between populations or varieties were estimated to quantify the levels of differentiation. A permutation test for detecting genetic differentiation utilizing KST, proposed by Hudson et al. (1992a), was conducted by shuffling diploid samples instead of haploid ones. Averages of KST across loci were used as test statistics. Note that more powerful tests based on KST* and Snn proposed by Hudson et al. (1992a) and Hudson (2000) were not carried out because these statistics require information of haplotypes.
Our sequences consist of one exon of 345 bp for the Ferr, one exon of 1047 bp for the HemA, one exon of 1575 bp and 3’ untranslated region (UTR) of 78 bp for the Lcyb, and one exon of 573 bp and 3’ UTR of 185 bp for the Pat. We also studied variation at the Chi1 in C. japonica. Although PCR products of the Chi1 locus included the 5’ UTR, we used sequence information of only the region downstream of the initiation codon because indel polymorphisms in the 5’ UTR disturbed direct sequencing of diploid samples. Thus, there was no indel variation within or between species at any loci except for the Chi1. There were a three-amino-acid (9bp) indel in the exon and one 2bp indel in an intron between the two species at the Chi1 locus. Polymorphic sites within species are shown in Fig. 2.
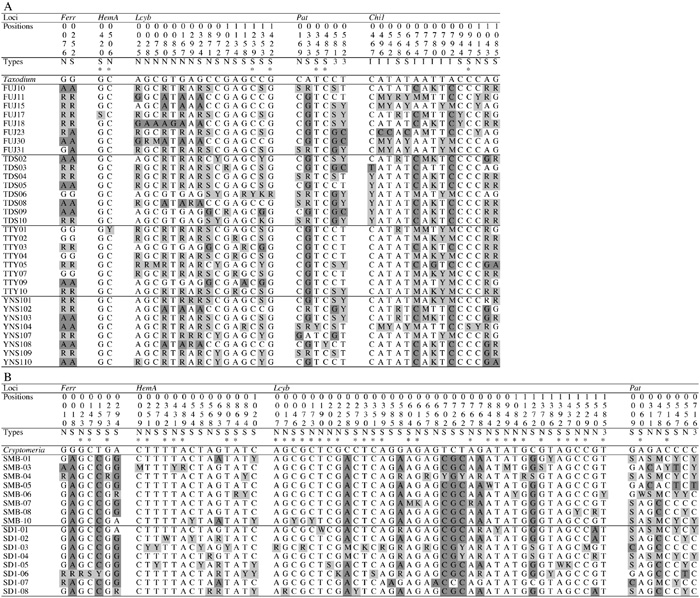 View Details | Fig. 2. A. Polymorphic sites. (A) C. japonica. (B) T. distichum. The notations N, S, 3 and I in Types denote nonsynonymous, synonymous, 3’ UTR and intron sites, respectively. Asterisks denote singleton variants. Heterozygous sites in each individual are denoted by R (A/G), Y (C/T), S (C/G), W (A/T), M (A/C) and K (G/T), respectively. Homozygotes (dark) or heterozygotes (light) with putative derived variants are shaded. |
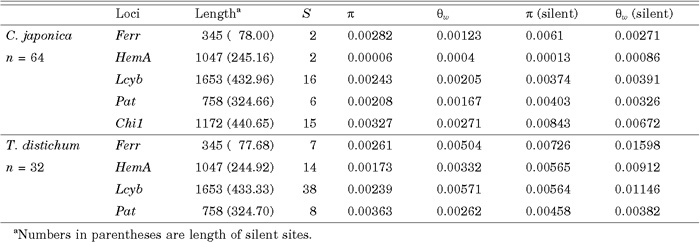
Values of number of segregating sites (S), nucleotide diversity (π), and Watterson’s estimate of θ (θw), are summarized in Table 2. The average value of nucleotide diversity (π) over five loci at silent sites was 0.0045 (SE 0.0015) in C. japonica but 0.0035 (SE 0.0012) over four loci excluding the Chi1. The average over the same four loci was 0.0058 (SE 0.0006) in T. distichum. The level of polymorphism was greater in T. distichum than in C. japonica though the difference was not significant. Estimates of divergence between the two species are summarized in Table 3. The average divergence between the two species at silent sites was 0.0829 (SE 0.0198). Frequency spectra in the two species are shown in Fig. 3. An excess of variants from the expectation of the standard neutral model was found in the class 33–40 in C. japonica (Fig. 3a), but the deviation was not significant.
 View Details | Table 2. Summary of amounts of DNA variation |
 View Details | Table 3. Summary of nucleotide divergence between C. japonica and T. distichum |
 View Details | Fig. 3. The frequency spectra of polymorphic sites. (A) C. japonica. (B) T. dictichum. The nucleotide base of the other species at the corresponding site is assumed to be the ancestral state. |
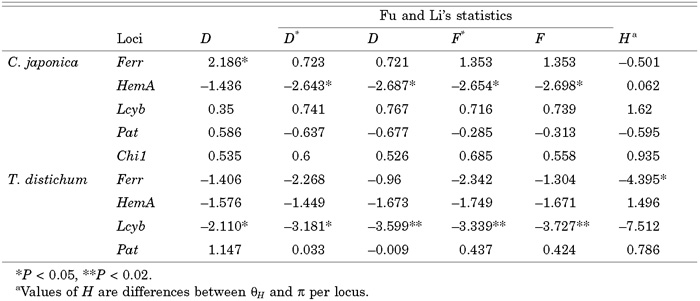
Significant deviations from the expectations of the standard neutral model were detected at the Ferr and the HemA in C. japonica, and at the Ferr and the Lcyb in T. distichum at least by one of the four tests, although all significances disappeared if we applied Bonferroni correction for multiple tests (Table 4). In MK tests (Table 5), excesses of replacement polymorphisms were observed at the Lcyb locus in both species, and excesses of replacement fixations were observed at the Ferr locus, though none of the results were significant. The product of the Ferr gene is presumably divided into a transit peptide (DNA positions 1–126) and mature protein (positions 127–345) (Smeekens et al. 1985). While all three polymorphisms at replacement sites were found in the transit peptide region, 11 of 12 fixed differences at replacement sites were found in the region encoding the mature protein. If we analyzed the region encoding the mature protein alone, P value of the MK test was 0.0048 and this was significant after Bonferroni correction. The HKA tests did not show any significant deviations from the neutral expectations (data not shown).
 View Details | Table 4. Summary of tests of neutrality |
 View Details | Table 5. Summary of MK tests |
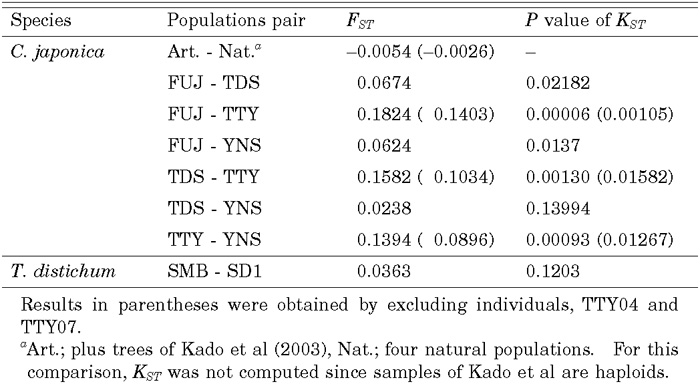
Average values of FST (Hudson et al. 1992b) across loci and significance levels of the test based on KST (Hudson et al. 1992a) are summarized in Table 6. We excluded the HemA locus from the analysis of C. japonica because this locus had only two singleton variants and was not informative for this analysis. While levels of differentiation among FUJ, TDS and YNS were low (FST = 0.0238 ~ 0.0674), those between TTY and the others were quite high (FST = 0.1394 ~ 0.1824). In fact, in TTY population, individuals, TTY02, TTY04, and TTY07, had the same genotype at all five loci. Therefore, we suspected that those three samples were clones. When we reanalyzed the data excluding TTY04 and TTY07, values of FST involving TTY decreased and ranged from 0.0896 to 0.1403, still higher than those between the other populations. When we compared plus trees and all samples from natural forests pooled together, the estimate of FST was -0.0054 and was very low. In T. distichum, the average value of FST between the two varieties over the four loci was 0.0363.
 View Details | Table 6. Summary of FST and P values of KST statistics |
Average values of π and θw at silent sites 0.0035 and 0.0027, respectively, excluding Chi1, in C. japonica differed from those of Kado et al. (2003) over the same set of loci by less than 10%. Therefore, there seems to be not much differences of diversities between artificial and natural forests. Levels of polymorphisms in T. distichum were higher than those in C. japonica, with the difference in numbers of polymorphic sites being much larger. Only a few data are available for comparison with other tree species. Our estimates of nucleotide diversity at silent sites are similar to 0.0064 across 63 genes in loblolly pine, Pinus taeda (Neale and Savolainen 2004), and 0.0043 at the BpMADS2 locus in silver birch, Betula pendula (Järvinen et al. 2003), but larger than the average, 0.0029, over three loci (the Pal, PHYP and PHYO) in Scots pine, Pinus sylvestris (Dvornyk et al. 2002; García-Gil et al. 2003). These values are lower than the value of 0.016 based on five loci in Populus tremula (Ingvarsson 2005), 0.010 based on nine loci in Arabidopsis thaliana (Aguadé 2001) and about 0.0212 based on 21 loci in Zea mays (Tenaillon et al. 2001; Whitt et al. 2002). It is interesting to note that the long-lived conifer trees have less nucleotide diversities than annual plants. The mutation rate per generation is expected to be higher in organisms with a longer generation time than for organisms with a shorter generation time. Because the nucleotide diversity is proportional to the product of population size and the mutation rate per generation, the observation suggests that conifer trees have smaller population size than the annual plants such as Arabidopsis and maize.
In a previous study (Kado et al. 2003), we reported excesses of intermediate frequency polymorphisms in C. japonica that might have been caused by past demographic events such as population size reduction in the glacial period or by human exploitation. In that study, we sampled plus trees from artificial forests. So one of the aims of this study was to examine whether these features are also found in natural forests or not.
In contrast to the result from the artificial forests, we found a certain amount of differentiation among populations, especially between pairs involving TTY population. However, a part of the stronger differentiation was due to sampling of close relatives or clones. Actually, three individuals in this population had the same genotypes at all five loci. When we estimated FST excluding two (TTY04 and TTY07) of these three individuals, FST became lower though they were still high (0.0896–0.1403). So there seem to be some factors promoting differentiation of this population. Taira et al. (1997) reported regeneration systems within six plots (16m × 16m or 24m × 24m) at different altitudes (900m ~ 2050m) in populations near TTY (Tateyama) by investigating root connection and surveying 13 allozyme loci encoding 9 enzymes. They showed that regeneration by layering is more frequent than by seedling, especially at high altitudes in Tateyama. Regeneration by layering seems to be common in regions with heavy snow. Thus, in those populations with heavy snow, chances of sampling clones are high. Note also that we sampled closely located trees in this population because of difficulties in obtaining enough samples. In such populations with layering, effective population size would be smaller since each individual occupies a larger area. Therefore, if we further assume that the population has been isolated from other populations, we expect TTY population to differentiate from the other populations by genetic drift.
Although natural populations were a little more differentiated from each other than the artificial populations, if we pooled data of all natural populations and compute FST between the natural and artificial populations, we obtained a very low estimate of FST (–0.0054 on average). Therefore, we conclude that genetic composition of the artificial forests is very similar to that of natural forests as a whole. The difference seem to be found only in populations (e. g. TTY) that are suspected to be small.
Excesses of intermediate frequency variants were previously found in the samples of plus trees (Kado et al. 2003). A similar trend was also found if we pooled data from all natural populations (Fig. 3), although the deviation from the expectation of the standard neutral model was not significant in the present samples. This suggests that the previous observation of the trend was not an artifact of using samples from artificial forests. One possible explanation for the deviation is a bottleneck event or recent reduction of population size as given by Kado et al. (2003) but further works are necessary to evaluate the validity of this explanation and quantify the size change or explore other possibilities.
In a previous study using Cleaved Amplified Polymorphic Sites (CAPS) markers, most of genetic variation (91.9%) in T. distichum was found within populations, 3.2% between bald cypress and pond cypress, and 4.9% among populations within each variety (Tsumura et al. 1999). In this study, FST between bald cypress and pond cypress was estimated to be 3.6%, and KST was not significant. Because we analyzed only one population in each variety, our estimate of FST includes variation among populations in addition to that between varieties and thus we can compare our estimate with the value 3.2 + 4.9 = 8.1% in Tsumura et al. (1999). Therefore, our estimate was somewhat lower than that based on the CAPS markers. However, in the CAPS study, most of variation between varieties was due to a single locus, CD618, and most of variation among populations was due to a single population, Fargo, in pond cypress. Indeed, estimates of FST between two varieties were 25.6% at CD618 and 0 ~ 4.4% at the other loci. When we reanalyzed the CAPS data excluding CD618 and the Fargo population, 0.4% of variation in this species was found between the two varieties and 2.0% was found between populations within each variety. So, our estimate of FST, 3.63%, is comparable to 2.4% (2.0% + 0.4%) obtained by the CAPS markers and confirms that populations and varieties are weakly differentiated in T. distichum. This may allow us to generalize our results to the whole species excluding Montezuma bald cypress although only one population per subspecies were examined here. A marker with a high FST, such as CD618, might be closely linked to a locus contributing to phenotypic differentiation between varieties, as is the case in an allozyme study in which the PGI-2 showed a high level of FST between bald cypress and pond cypress (Lickey and Walker 2002).
In T. distichum, excesses of singleton variants were observed in three out of four loci and Fu and Li’s statistics and Tajima’s D were negative except at the Pat locus (Table 4). Also there were excesses of derived variants at the Ferr and Lcyb (see Fig. 2), and Fay and Wu’s H statistics were negative (Table 4). P values of H were 0.012 at the Ferr and 0.079 at the Lcyb. At first, we thought that the significantly negative H at the Ferr might indicate a recent selective sweep at or near the locus (Fay and Wu 2000). However, this locus lacks another sign of a recent selective sweep, i. e., low nucleotide diversity. So we need to consider non-selective explanations for the observation.
There are several possibilities. Firstly, the population size might have changed in T. distichum and this may have caused increases of variances of the statistics used here, inflating the probability of rejection. Secondly, excesses of both singleton and high frequency variants occur when the population is subdivided and migration rates between subpopulations are low (Fay and Wu 2000; Wakeley and Aliacar 2001). Although the subpopulations of T. distichum are currently only weakly differentiated (Tsumura et al. 1999 and the current study), there might be isolated populations not surveyed thus far or in the past, for example, in the glacier period. Therefore, such population structure may explain our observation. Finally, unequal sampling from different subpopulations is known to cause excesses of high frequency variants (Przeworski 2002). Because this explanation assumes differentiation between subpopulations, it is related to the second explanation. However, because we sampled equal number (16) of genes for each subpopulation, this effect is not considered large. At present, we can not determine which explanation is appropriate for our observation of excesses of both singleton and high frequency variants. For this purpose, we need to increase the number of loci surveyed to more accurately infer the past population structure
At the Lcyb locus, excesses of replacement polymorphism were observed in both species by the MK test, though the results were not significant (Table 5). This pattern can be explained by presence of nearly neutral variants at replacement sites (Ohta 1992) but frequencies of the variants were intermediate to high in C. japonica. Therefore, we suggested in our previous paper (Kado et al. 2003) that a reduction of population size strengthened effects of genetic drift so that those nearly neutral variants became effectively neutral in C. japonica. In T. distichum, we observed significantly negative values of Fu and Li’s statistics and Tajima’s D and those negative values were mostly due to singletons at replacement sites. Indeed, 16 out of 18 variants at replacement sites were newly derived singletons. The observation is consistent with the nearly neutral mutation hypothesis. If T. distichum experienced a recent expansion as we suggested above as one possible explanation for a significantly negative H and generally negative values of the neutrality test statistics, such size change would increase the probabilities of rejection in Tajima’s and Fu and Li’s tests but decrease that in MK test under a nearly neutral model (Tachida 2000). Probably, the recovery of population size in T. distichum made those variants weakly selected while the recent size reduction in C. japonica made them neutral resulting in non-significant values of D, D* and F*.
Kado et al. (2003) reported a low level of polymorphism (only one singleton variant was found) at the HemA locus in C. japonica, although no significant deviation from the standard neutral model was found by the HKA tests, Fu and Li’s statistics or Tajima’s D statistics. In this study we found two additional singleton mutations at the HemA locus in C. japonica. Values of all of Fu and Li’s statistics were significantly negative (Table 4). When we put the previous and present data at the HemA locus together, there were three singleton mutations and the P value of D* was less than 0.02. Interestingly, the nucleotide diversity at the HemA in T. distichum was not low and thus the low diversity does not seem a locus-specific characteristic. Because the nucleotide diversity was low at the HemA specifically in C. japonica and D* and F* were significantly negative, we suggest that a selective sweep by positive selection occurred recently at or near this locus in C. japonica. Considering the low recombination rate in this species (Kado et al. 2003), the region swept by this event may be large and this locus may not be the target of selection.
Using the ML method of Yang et al. (2000), Kusumi et al. (2002) showed that the Ka/Ks ratio, ω, at three sites of the Ferr locus was larger than one among species in Cupressaceae s. l. that includes C. japonica, T. distichum and other related species. The observation suggested that positive selection acts on some sites at this locus. The result of the MK test supports this possibility if we restrict our attention to the region coding for the mature protein. Therefore, successive adaptive substitutions seem to have occurred at this locus. However, the substitutions may not be due to simple fixations of advantageous mutations because a significantly positive value of Tajima’s D was observed in C. japonica (Table 4). Because the region sequenced was short (345bp) and only two sites were polymorphic, this may be just a type I error but some type of balancing selection at or near this locus might be responsible for this pattern. In order to examine these possibilities, we plan to survey the region surrounding the locus in future studies.
In this paper, we investigated DNA polymorphisms in natural populations of C. japonica and T. distichum. We found that natural populations as a whole were little differentiated from the artificial populations investigated previously but one local population showed a certain amount of differentiation from the other populations probably due to its smaller size and some isolation from other C. japonica populations. We also found that C. japonica seemed to have lower diversity and excess variants with intermediate frequencies but T. distichum had higher diversity and excesses of rare and high-frequency variants though many of the differences were not statistically significant. These patterns may be explained by assuming a recent population reduction in C. japonica and a recent expansion event in T. distichum. Probably for this reason, we observed different patterns of action of selection, for example, at the Lcyb. By extending such an analysis, we may get more insights into the interaction of various evolutionary factors such as population structure and selection.
We thank two anonymous reviewers and Dr. Christopher S. Campbell for many helpful comments on the earlier version of the manuscript. This work was partially supported by grants from a Grant-in-Aid for Scientific Research from the Japan Society for the Promotion of Science (no. 16370101), the Program for the Promotion of Basic Research Activities for Innovative Biosciences (PROBRAIN) and Uehara Memorial Foundation.
|