| Edited by Kiyotaka Okada. Hiroaki Shimada: Corresponding author. E-mail: shimadah@rs.noda.tus.ac.jp. Each nucleotide sequence data reported appears in the EMBL, GenBank and DDBJ Nucleotide Sequence Databases under the accession number AB192574 for OsGASR1 and AB192575 for OsGASR2. |
We performed a microarray analysis to study specific gene expression in the stage of panicle formation using the panicles-deficient mutants and the wild-type, and found genes whose expressions were fluctuated. Among them, the expression of a rice GAST homologue gene was significantly decreased in the mutants.
Gibberellin (GA) -stimulated transcript (GAST) family genes have been reported in many kinds of plants as GA-responsive genes whose expressions are induced by GA. GA-stimulated transcript 1 (GAST1) is originally found in the GA-deficient tomato mutant, gib1 (Shi et al., 1992). Other GAST homologue genes have also been isolated from tomato (Taylor and Scheuring, 1994), Arabidopsis (Herzog et al., 1995), Gerbera hybrida (Kotilainen et al., 1999), potato (Segura et al., 1999; Berrocal-Lobo et al., 2002), and Petunia hybrida (Ben-Nissan and Weiss, 1996; Ben-Nissan et al., 2004). These GAST family proteins consist of about 100 amino acid residues and contain a highly conserved cysteine-rich domain termed GASA domain in their C-terminal region instead of low similarity of their N-terminal regions.
It has been shown that plant hormones control expressions of GAST family genes. GA induces the expression of GAST1 however it is reduced by the addition of abscisic acid (ABA) (Shi and Olszewski, 1998). The expression of RSI-1, another tomato GAST1 homologue gene, is induced by auxin (Taylor and Scheuring, 1994). GA induced the expression of GEG, a GAST1 homologue in G. hybrida, in corollas and carpels (Kotilainen et al., 1999). Four Arabidopsis GASR homologue genes termed GASA1-4 show different expression patterns in response to GA. GA induces GASA1 and GASA4 expressions, but does not affect GASA2 and GASA3 expressions (Herzog et al., 1995; Aubert et al., 1998).
Organ specificity of GASA expressions is observed. GASA1 is expressed in siliques and flower buds, GASA2 and GASA3 in dry siliques and seeds, and GASA4 in growing roots and flower buds (Herzog et al., 1995; Aubert et al., 1998). In petunia, four GIP (GIP1, GIP2, GIP4, and GIP5) genes are isolated and all expressions are induced by GA3. Expression analysis of GIP genes suggests that GIP1 and GIP2 function in cell elongation while GIP4 and GIP5 in cell division (Ben-Nissan and Weiss, 1996; Ben-Nissan et al., 2004). To understand the function of GAST family genes in detail, transgenic plants enhancing or repressing expressions of GAST family genes are constructed. None of the transgenic tomato plant in which GAST1 expression is enhanced or repressed shows difference in phenotype (Shi and Olszewski, 1998). Interestingly, overexpression of GEG inhibits the elongation of petal cells leading to promoting the expansion of radial cells (Kotilainen et al., 1999). Moreover, a GIP2 transformant whose expression is repressed by RNA interference shows late flowering and low stem elongation under low-temperature conditions (Ben-Nissan et al., 2004). These findings suggest GAST family genes play important roles in a variety of development program of plants.
In the rice genome, two different GAST family genes were found, one of whose partial cDNA sequence has been reported (Ikeda et al., 1997). To elucidate the function of the rice GAST family genes, we isolated two GAST homologue genes and designated them OsGASR1 and OsGASR2, respectively. Here, we report on the characterization of these genes and discuss their physiological roles during panicle development.
Rice seedlings (Oryza sativa L. cv. Nipponbare) were grown in a growth cabinet under a 16 h day/8 h night cycle at 28°C after germination at 30°C under dark conditions for 3 days. The panicles-deficient mutants, which showed a similar phenotype to the frizzy panicle (fzp) mutant (Komatsu et al., 2003) in reproductive phase, were generated as somaclonal mutants. The rice dwarf mutant d-18, Housetsu-waisei (Kinoshita and Shinbashi, 1982), was a kind gift from Dr. K. Tanaka and Dr. O. Masumura at the Kyoto Prefectural Institute of Agricultural Biotechnology. The wild type rice seedlings and the panicles deficient mutants were grown in a green house. Suspension-cultured cells of rice were cultured in AA medium (Toriyama and Hinata, 1985) as described previously by Baba et al. (1986).
After germination, GA3 (Wako Pure Chemical Industries, Osaka, Japan) was supplied to rice seedlings at the final concentration of 0.1mg l–1. GA3-treated rice seedlings were transferred to a growth cabinet and grown under the same conditions as described above.
Total RNAs from various organs, suspension cultured-cells and immature panicles were prepared using the RNeasy plant mini kit (Qiagen, Hilden, Germany) with RNase-Free DNase set (Qiagen, Hilden, Germany) according to the manufacture’s protocol. cDNA was synthesized with the Revertra-Ace cDNA synthesis kit (TOYOBO, Osaka, Japan) according to the manufacturer’s protocol. Eight primers used for PCR were OsActin1 forward, 5’- TGT CAT GGT CGG AAT GGG -3’, and OsActin1 reverse, 5’- TGC CAG GGA ACA TAG TGG -3’; and OsGASR1 forward, 5’- TTG AAT TCA TGA AGC TCA ACA CCA -3’, and OsGASR1 reverse, 5’- TTC TCG AGT GGG CAC TTG GGC CTC T -3’: and OsGASR2 forward, 5’- CCG AAT TCA TGG CTC CCG GCA AGC T -3’ and OsGASR2 reverse, 5’- GGC TCG AGC GGG CAC TTG GTC ATG T -3’; and rice ribosomal protein L34 forward, 5’- GCA CAG CTA CGC CAC GAA AT -3’, and rice ribosomal protein L34 reverse, 5’- GCT GAC TTG TCC TTG GTC TT -3’. PCR for the transcripts of actin, ribosomal protein L34, and OsGASR1 was performed for each cycle of 94°C for 1 min, 52°C for 30 s, and 72°C for 1 min. PCR using OsGASR2 primers was performed for each cycle of 94°C for 1 min, 48°C for 30 s, and 72°C for 1 min. PCR cycles for semiquantitative PCR were optimized by determining the amount of PCR product using agarose gel electrophoresis.
Riboprobes for in situ hybridization were labeled with digoxigenin-11-rUTP using a DIG RNA labeling kit (Roche, Mannheim, Germany) according to the manufacturer’s protocol. The riboprobes, which were used at a concentration of 2 mg ml–1, were subjected to mild alkaline hydrolysis by heating at 60°C in the carbonate buffer. Tissues from 20-day-old rice plants were fixed for 16 h at 4°C with a mixture of 4% (W/V) paraformaldehyde and 0.25% (V/V) glutaraldehyde in 50 mM sodium phosphate buffer (pH 7.2). The fixed tissues were dehydrated in a series of xylene and ethanol and embedded in paraffin (HISTPREP 568, Wako). Embedded tissues were sectioned at a thickness of 10 μm and placed on microscope slides precoated with 3-aminopropyltrietoxysilane (APS). Sections were deparaffinized with xylene and rehydrated through a graded ethanol series. After pretreatment with 10 mg ml–1 of proteinase K (Sigma-Aldrich corp., USA) in 100 mM Tris-HCl (pH 7.5) and 50 mM ethylenediamine tetraacetic acid (EDTA) at 37°C for 30 min, sections were dehydrated through a graded ethanol series and dried under vacuum for 2 h. Hybridization and detection of hybridized signals with the riboprobes were performed as previously described (Sato et al., 1996).
The coding regions of the OsGASR1 and OsGASR2 genes were amplified by PCR and inserted into the EcoRI-XhoI sites of the CaMV35S-sGFP (S65T) vector. These recombinant genes were incubated with gold particles and DNA coated-gold particles were delivered into onion epidermal cells using the PDS-1000/He particle bombardment system (Bio-Rad Laboratories, CA, USA). The conditions of bombardment were: vacuum of 28 inches of Hg, helium pressure of 1100 psi, and a 10 cm target distance. Bombarded onion cells were cultured on solid Murashige & Skoog medium containing 2% agarose at 28°C for 6 h under dark condition (Murashige and Skoog, 1962). The resultant GFP images were observed with LSM 510 confocal microscope system (Zeiss, Jena, Germany).
Genomic information of OsGASR1 and OsGASR2 is cited at the website, INE “http://rgp.dna.affrc.go.jp/giot/INE.html”. The rice expression sequence tag (EST) database was searched using the tBLASTn program to identify cDNA clones with high homology to GAST family proteins. Individual rice EST clones were obtained from the National Institute of Agrobiological Sciences. Phylogenetic analyses were performed based on amino acid sequences with the UPGMA using GENETYX-MAC ver.13 (GENETYX Co. Ltd., Tokyo, Japan).
We searched the rice EST database using the tBLASTn program and two EST clones, E30018 (GenBank Accession No. AU091675) and E61602 (Accession No. AU065318), were found with high degrees of homology to GAST family proteins. The gene of E30018 was designated as Oryza sativa GA-stimulated transcript-related gene 1 (OsGASR1) and E61602 as O. sativa GA-stimulated transcript-related gene 2 (OsGASR2), respectively. The amino acid sequence of OsGASR1 protein was identical to that of GASR1 whose partial sequence has been reported by Ikeda et al. (1997). Similar to other GAST family proteins, it was found that corresponding proteins of these genes, OsGASR1 and OsGASR2, also contained the GASA domain in their C-terminus (Fig. 1A). In their GASA domains, 12 cysteines were completely conserved (Fig. 1B).
 View Details | Fig. 1. Structure of OsGASR genes and proteins. (A) Structure of OsGASR1 and GASR2 proteins. The GASA domain is indicated with hatching. (B) Alignment of the deduced amino acid sequences of GASA domains with those of other GAST proteins. Arrowheads show conserved cysteine residues. (C) Unrooted phylogenetic tree depicting the relationship between OsGASR proteins and other plant GAST homologues. Accession numbers of other GAST family proteins were shown in the right side. (D) Maps of OsGASR1 and OsGASR2 genes in each rice chromosome (O. sativa) genome. CEN: centromeric region. Genomic organization of OsGASR genes is shown below. Boxed areas indicate exons and lines show introns of 5’-upstream and 3’-downstream regions. The shaded boxes correspond to the coding region. |
To determine the phylogenetic relationship between GAST family proteins, a phylogenetic tree was drawn with distance matrices employing the unweighted pair-group method using arithmetic averages (UPGMA). Fig. 1C shows the phylogenetic distances of GAST family proteins reported or predicted to date. It indicates that OsGASR1 was most closely related to StSN1, and that OsGASR2 was closely related to AtGASA2 and AtGASA3. The OsGASR1 protein had a 38.7% sequence identity with the OsGASR2 protein, indicating that OsGASR1 was evolutionarily diverged from OsGASR2. The corresponding genes of OsGASR1 and OsGASR2 were determined according to the integrated rice genome explorer (INE) site as chromosome 3 with two exons and chromosome 4 with three exons, respectively (Fig. 1D).
As it had been previously reported that GA3 enhanced the expression of GAST family genes, we analyzed the effect of GA3 on the expression of both OsGASR genes. GA3 promoted cell growth in wild-type Nipponbare plants as well as in the GA-synthesis deficient mutant, d-18. GA3 treatment also recovered the growth defect of d-18 (Fig. 2A). Semiquantitative reverse transcriptase-polymerase chain reaction (RT-PCR) analyses showed that GA3 enhanced the expression of both OsGASR1 and OsGASR2 in wild-type and d-18 plants. The expression level of OsGASR1 increased 2.3-fold in the wild type and 3.5-fold in d-18 (Fig. 2B, upper lane). OsGASR2 expression increased 2.8-fold in the wild type and 2.2-fold in d-18 (Fig. 2B, middle lane). These results clearly indicate that GA3 stimulates the expression of OsGASR genes in a similar fashion to GAST genes reported in other plants.
 View Details | Fig. 2. Stimulation of expression of OsGASR genes by GA3. (A) The effect of GA3 on the growth of rice seedlings. WT, wild-type Nipponbare and d-18, the GA synthesis-deficient mutant. (B) RT-PCR using each OsGASR gene-specific primer. Total RNAs were prepared from rice seedlings with or without GA3 treatment. Control RT-PCR was performed using primers for rice actin (accession no. X16280) (lowermost lane). Repeated cycles of PCR were shown in the right side. Each experiment was repeated four times and the strength of each signal was determined from an NIH image. |
As it has been reported that GA stimulates cell division (Richards et al., 2001; Izhaki et al., 2002), it was presumed that OsGASR genes might be involved in cell proliferation. For this reason, we analyzed the alteration of the expression level of each OsGASR gene in the growth phase using suspension-cultured rice cells. A proliferation of rice suspension-cultured cells entered the logarithmic phase after 3–4 days (Fig. 3A). The expression of both OsGASR genes gradually increased and reached a maximum 4 days after inoculation (Fig. 3B). The high level of expression of the OsGASR1 gene was continuously maintained until the stationary phase, however, OsGASR2 expression decreased at the stationary phase (Fig. 3B). Fig. 3C showed the expressions of OsGASR1 and OsGASR2 genes when rice cells were cultured in the medium with or without sucrose. In this experiment, sucrose was supplied as the sole carbohydrate to the medium and removal of it from the medium resulted in a cessation of cell proliferation of the suspension-cultured cells. Both OsGASR1 and OsGASR2 genes were apparently expressed in suspension-cultured cells (Fig. 3C, lane 1). When cell proliferation was temporarily halted for 6 or 10 days by the removal of sucrose from the growth medium, expression levels of both genes were significantly reduced (Fig. 3C, lane 2 and 3). When proliferation of the growth-halted cells was induced to resume in response to the addition of sucrose to the medium, their expressions were recovered (Fig. 3C, lane 4). These results suggest that expressions of OsGASR genes are tightly correlated with cell proliferation.
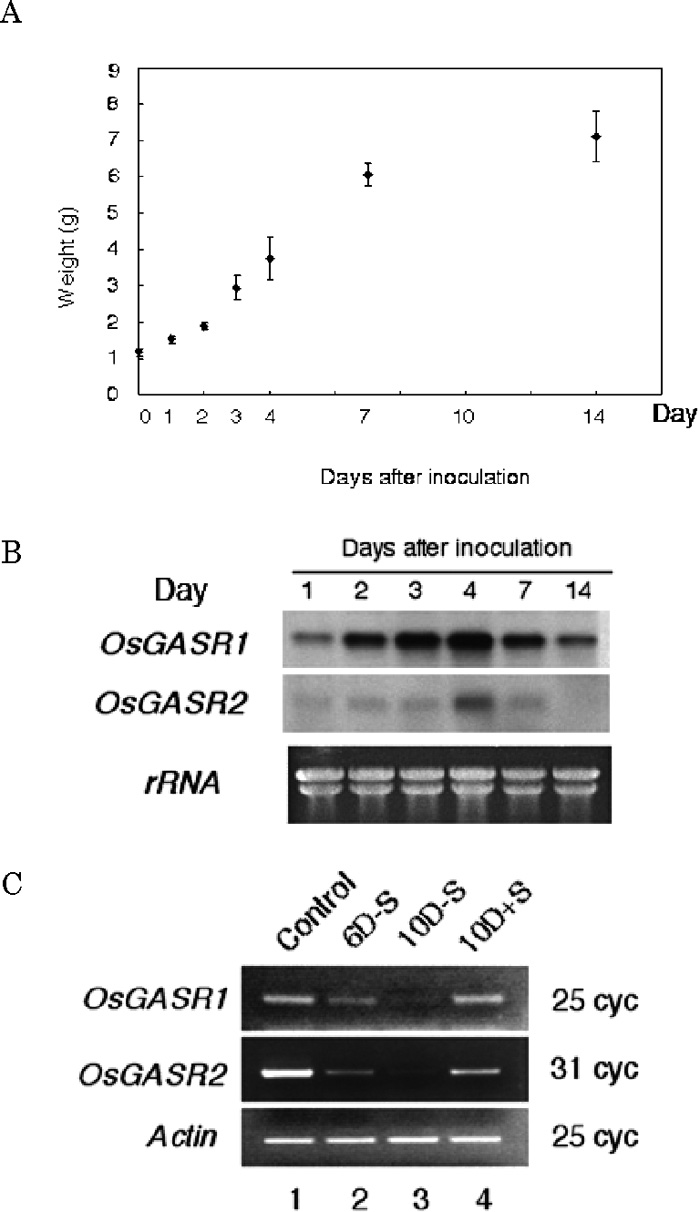 View Details | Fig. 3. The relationship between expression of OsGASR genes and cell proliferation. (A) A growth curve of Oc cells determined by the packed cell volume. (B) Northan blot analysis for expression of OsGASR genes during the growth phase. Aliquots of 20 μg of total RNA prepared from the cultured cells were separated on a 1.2% agarose gel containing formaldehyde and then blotted. The blot was probed with each 32P-labeled OsGASR1 or OsGASR2 cDNA. (C) Effects of sucrose starvation on the expression levels of OsGASR genes. Rice cells were cultured in suspension for 6 (lane 1 and 2) or 10 days (lane 3) with (lane 1) or without (lane 2 and 3) sucrose in the AA medium. Rice cells were cultured for 6 days without sucrose, and then sucrose was added to the medium and culture was continued for a further 4 days (lane 4). |
To determine expression patterns of OsGASR genes in various organs of the rice plant, we performed RT-PCR using RNAs prepared from various organs (Fig. 4). Tissues except flag leaves and panicles were prepared from 50-days-old rice plants. Both OsGASR1 and OsGASR2 were highly expressed in suspension-cultured cells and the shoot apical meristem (SAM) (Fig. 4, lane 1 and 3). Moderate expression occurred in young leaves and roots containing the root apex (Fig. 4, lane 2 and 4). No signals were detected in mature and flag leaves (Fig. 4, lane 5 and 6). In these organs, they showed similar expression patterns. Diversity in the expression pattern was observed in panicles after heading prepared from 90-days-old rice plants. OsGASR1 was strongly expressed while OsGASR2 was weakly expressed (Fig. 4, lane 7).
 View Details | Fig. 4. Expression of OsGASR genes in different organs. Flag leaves and panicles were isolated from 90-days-old rice plants, and other tissues were prepared from 50-days-old rice plants. RT-PCR was performed using total RNAs prepared from various tissues. |
We performed in situ hybridization using digoxigenin-labeled antisense cRNAs as probes to study spatial expression patterns of OsGASR genes. In the shoot apex, an antisense probe for OsGASR1 gene showed strong hybridization signals in the SAM, young leaves and tiller buds (Fig. 5A). OsGASR2 was also expressed in the SAM and young leaves (Fig. 5B). In the root apex, strong hybridization signals for both genes were detected in the region corresponding with the root cap (RC) and root apical meristem (RAM) (Fig. 5D, E). The hybridization signal of OsGASR1 was also detected in vascular tissues (Fig. 5D), whereas that of OsGASR2 was not observed (Fig. 5E). When digoxigenin-labeled sense cRNA was used as probes, no signal was detected (Fig. 5C, F). These results showed that both OsGASR genes are strongly expressed in meristems where cell proliferation actively occurs.
 View Details | Fig. 5. Spatial expression patterns of OsGASR genes determined by in situ hybridization. In situ hybridization was performed using longitudinal sections from the shoot apex (A, B, C) and the root apex (D, E, F). The plant tissues of 14-days-old rice seedlings were sectioned and probed with OsGASR1 (A, D) or OsGASR2 (B, E) antisense riboprobes labeled with digoxigenin-UTP. The sense OsGASR1 riboprobe was used as a control (C, F). Bars, 100 μm. SAM, shoot apical meristem; ML, mature leaf; YL, young leaf; TB, tiller bud; RAM, root apical meristem; RC, root cap. |
Because the expression pattern of OsGASR genes clearly differed in panicles (Fig. 4), we investigated the specific expression of OsGASR genes during the stage of panicle development. Both OsGASR1 and OsGASR2 were strongly expressed in immature panicles before heading, and these expressions gradually reduced after heading (Fig. 6A). To determine OsGASR expressions in immature panicles, immature spikes were collected from rice plants before heading and separated into florets and remaining rachis. OsGASR1 was expressed strongly in florets but not in rachis, whereas OsGASR2 was expressed at the same level in both tissues (Fig. 6B). To determine the involvement of the expression of OsGASR genes in panicles development, we analyzed the expression level of OsGASR genes in immature spikes of a panicle-deficient mutant. The panicle-deficient mutant showed normal appearances in the vegetative phase, but completely lost the florets instead of producing termless branches in the productive phase (Fig. 6C). As shown in Fig. 6D, a contrast expression pattern of OsGASR genes was observed in the panicles-deficient mutant. The expression of OsGASR1 was diminished while that of OsGASR2 was increased. This observation confirmed the result of the microarray analysis on the immature panicles of this mutant. The microarray analysis showed that the rate of OsGASR1 expression in the mutants to that in the wild type was 0.405. These results may suggest that OsGASR1 functions in frolets whereas OsGASR2 in whole immature panicles before heading.
 View Details | Fig. 6. Estimation of expressions of OsGASR genes in the panicles. (A) Expression of OsGASR genes during panicle development. Total RNAs were prepared from immature panicles before heading (BH), panicles 3 days after heading (3 DAH), and panicles 10 days after heading (10 DAH). (B) Expression of OsGASR genes in rachis and florets of the panicles. The gene-encoding rice ribosomal protein L34 (Rbs: accession no. AK103424) was used as a control. (C) Phenotype of panicles in the wild type (left) or the panicles-deficient mutant (right). (D) Expression of OsGASR genes in the spikelets of the panicle-deficient mutant. Each numbers (71, 72 and 73) meaned the name of the mutant lines. |
In potato, abiotic or biotic stresses influenced expressions of GAST family genes (Segura et al., 1999; Berrocal-Lobo et al., 2002). We investigated the effect of abiotic stress on the expression of OsGASR genes. UV induced OsGASR1 expression and it gradually declined after reaching to the maximal level at 1 h after irradiation. On the other hand, UV did not influence OsGASR2 expression (Fig. 7). Other abiotic stresses such as cold, high salt concentration and drought did not influence expressions of both OsGASR genes (data not shown). These results suggest that OsGASR1 is a UV-responsive gene.
 View Details | Fig. 7. Effect of UV irradiation on the expression of levels of OsGASR genes. 14-days-old rice seedlings were exposed to UV at 25 J/m2 and kept in the dark. Rice seedlings were collected at the various time points after UV irrdiation. Numbers on the figure indicate that the incubation time after irradiation. |
Ben-Nissan et al. (2004) have reported that GIP1, a P. hybrida GAST homologue, is localized to the endoplasmic reticulum (ER) membrane when expressed in tobacco BY2 cells. To determine the subcellular localization of OsGASR proteins, we constructed genes for both OsGASR1-sGFP (S65T) and OsGASR2-sGFP (S65T) fusion proteins that were expressed under the regulation of the cauliflower mosaic virus (CaMV) 35S promoter (Fig. 8A). When they were transiently expressed in onion epidermal cells, both transformed cells showed fluorescence of the green fluorescent protein (GFP) in the apoplasm, a region between the cell wall and cell membrane, and cell wall (Fig. 8B, C). The control GFP protein was uniformly localized in the nucleus and cytoplasm (Fig. 8D). These results demonstrate that OsGASR proteins are localized in the apoplasm or cell wall.
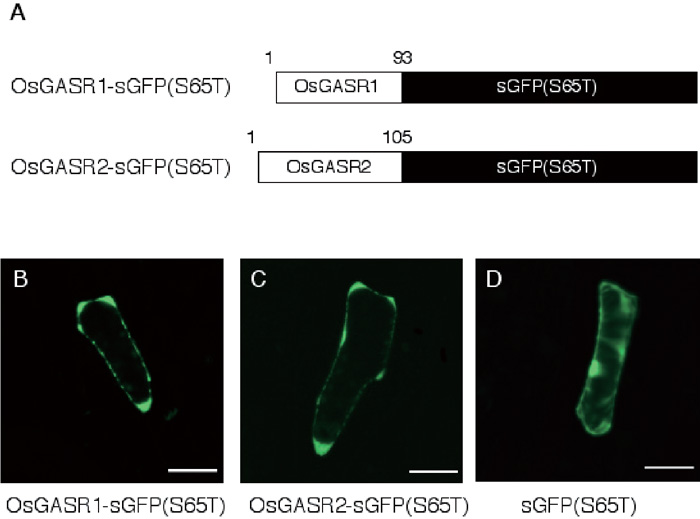 View Details | Fig. 8. Intracellular localization of OsGASR-sGFP fusion proteins transiently expressed in onion epidermal cells. (A) Structure of OsGASR-sGFP (S65T) fusion proteins. (B)–(D): Fluorescence micrographs of onion epidermal cells expressing the OsGASR1-sGFP(S65T) fusion protein (B), the OsGASR2-sGFP(S65T) fusion protein (C), and the control GFP protein (D). Bars, 100 μm. |
GA controls plant cell growth and development by inducing many kinds of gene expression. GAST family genes are known as genes whose expression is upregulated by GA treatment. To date, GAST homologue genes have been identified in various higher plants and they have a common featuring domain called GASA in the C-terminus region. In this study, we found two GAST homologue genes in rice (O. sativa L. cv. Nipponbare) and showed that both corresponding proteins also conserved the GASA domain in the C-terminus region (Fig. 1). Other than a structural similarity in amino acid sequences, the GA3 treatment induced the expression of both OsGASR1 and OsGASR2 in the wild-type rice seedlings as well as d-18 (Fig. 2B). These results confirm that both OsGASR1 and OsGASR2 belong to the GAST family of genes although the degree of induction was different (Fig. 2B).
It has been also reported that biotic and abiotic stresses also induce the expression of GAST family genes (Segura et al., 1999; Berrocal-Lobo et al., 2002). In potato, StSN1 expression was stimulated by plant pathogens (Segura et al., 1999), while both wounding and pathogen infection induce StSN2 expression (Berrocal-Lobo et al., 2002). Our study revealed that OsGASR1 expression was induced by UV irradiation but that of OsGASR2 was not induced (Fig. 7). This result suggests functional differences between OsGASR1 and OsGASR2 in response to UV irradiation.
As shown in Fig. 3, expression levels of both OsGASR genes were well synchronized with the degree of cell proliferation. Maximum expression was observed 3–4 days after inoculation when cell proliferation entered the logarithmic phase. Expression of both genes was reduced according to the cessation of cell proliferation by sucrose starvation in the medium, and expression of both was recovered by supplements of sucrose to the medium. Such synchronization suggests that both OsGASR genes play important roles in cell proliferation.
RT-PCR and in situ hybridization showed that expression signals were strongly observed in the meristems (SAM and RAM). However, no signals were detected in mature and flag leaves where little cell proliferation occurred (Fig. 4 and Fig. 5). The spatial expression of GAST family genes has previously been reported (Taylor and Scheuring, 1994; Herzog et al., 1995; Aubert et al., 1998; Kotilainen et al., 1999; Berrocal-Lobo et al., 2002; Ben-Nissan et al., 2004). It was reported that Arabidopsis GASA genes and petunia GIP genes showed different expression patterns in various organs (Herzog et al., 1995; Aubert et al., 1998; Ben-Nissan et al., 2004). On the other hand, OsGASR genes showed similar expression patterns except for root apex and panicles (Fig. 4 and Fig. 5). The expression pattern of OsGASR1 in roots was similar to that of RSI-1, a tomato GAST homologue (Taylor and Scheuring, 1994). OsGASR1 was expressed in the root cap and vascular tissues in the roots. OsGASR2 was expressed only in the root cap, and not in vascular tissues (Fig. 5). Different expression patterns were evident between OsGASR1 and OsGASR2 in panicles (Fig. 4). Although both genes showed their strongest expression in immature panicles before heading (Fig. 6A), the expression of OsGASR1 was limited to the florets while that of OsGASR2 was detected in both florets and rachis (Fig. 6B). They showed a different expression pattern in panicle-deficient mutants, somatic mutants that completely lacked spikelet formation. Diminished little expression of OsGASR1 was observed but enhanced expression of OsGASR2 was found (Fig. 6D). Murakami (1983) had revealed that GAs were most abundant in anthers during the development of panicles, suggesting that the floret-specific expression of OsGASR1 might be induced by GAs in anthers. We also investigated expressions of two OsGASR genes in the panicles of the antisense SPK transgenic plant as a mutant of seed development because it bears watery seeds without accumulation of starch storage despite showing a normal appearance before heading (Asano et al. 2002). The expression of OsGASR1 and OsGASR2 seemed as normal in this plant as in the wild type (unpublished data). Our findings suggest that both OsGASR1 and OsGASR2 genes are involved in the formation of panicles but not in seed development. Functions of these genes may be different in differentation of panicles according to their specific gene expressions. In coclusion, we showed that expressions of OsGASR1 and OsGASR2 were related with cell proliferation in meristems and panicles development.
This work was supported in part by Grants-in Aid for Scientific Research from the Ministry of Education, Science, Sports and Culture, Japan (Grants Nos. 15570042, 17310115 and 17657020 to HS). We thank Dr. Y. Niwa at University of Shizuoka for providing the sGFP(S65T) expression vector. We thank Dr. J. Hashimoto for useful discussion, and appreciate Mr. S. Miki, Ms. M. Teruse, Ms. K. Ochi, Ms. S. Fujita and Ms. S. Ohashi for technical assistance.
|